I. Core Data Overview: Overseas Output Growth Slows but Remains in Positive Territory
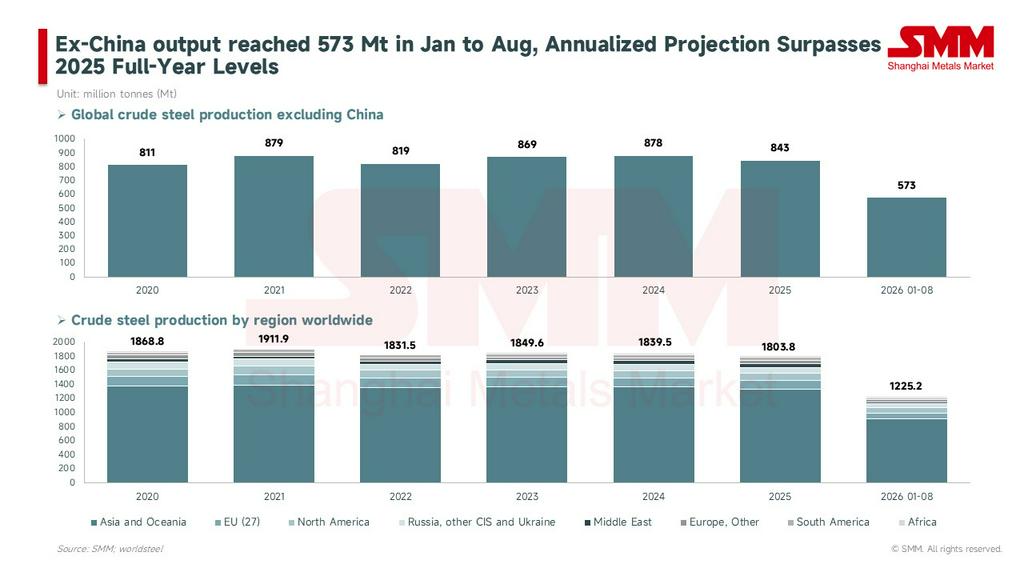
Overall, cumulative crude steel production outside China (overseas) reached 573 million tonnes in January–August 2026. Based on World Steel Association (WSA) data, overseas year-on-year (YoY) growth was approximately +2.2%, with an annualized output of about 860 million tonnes, remaining above the full-year 2025 level of 843 million tonnes. Global cumulative production for the first eight months was 1.225 billion tonnes, down 0.7% YoY, with the entire decline still driven by the Chinese market (down 3.1% YoY).
Notably, overseas supply growth showed signs of slowing: overseas output for August alone was approximately 69.6 million tonnes, with YoY growth narrowing to +1.6% (compared to +3.5% in July) and dropping 3.7% month-on-month (MoM). The primary reasons for this slowdown were the YoY contraction in EU output and renewed weakness in the CIS region.
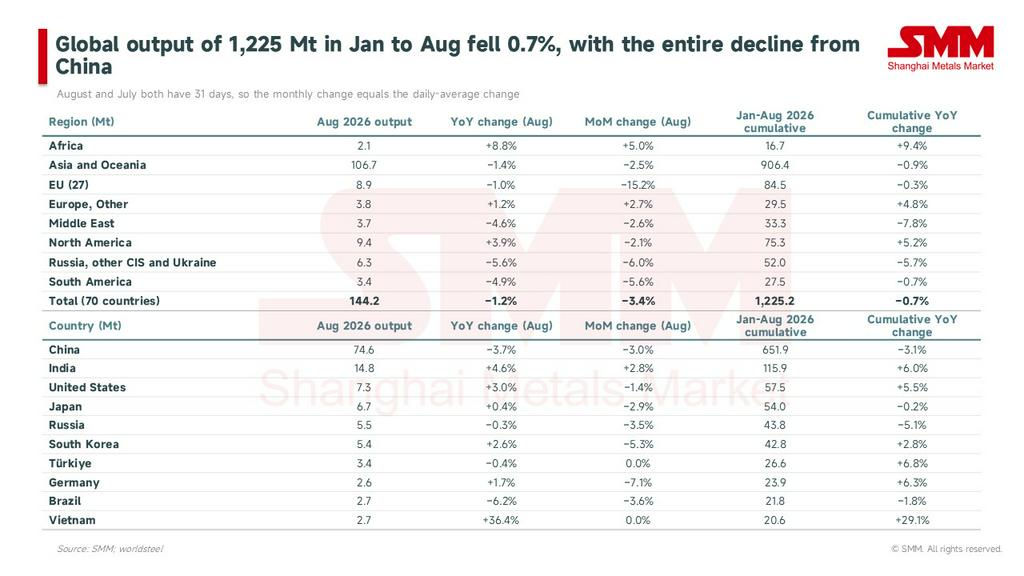
Global crude steel production in August was 144.2 million tonnes, down 1.2% YoY. Since both July and August have 31 calendar days, the absolute MoM change in monthly production directly reflects the daily average MoM change, providing an intuitive view of actual supply and demand adjustments for the month.
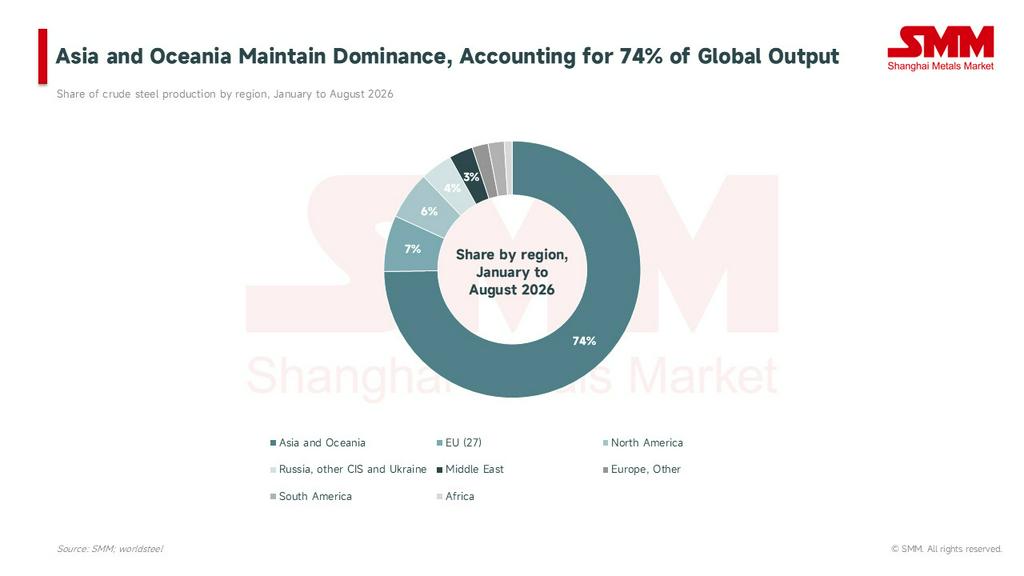
Looking at the global supply landscape, regional shares remained structurally unchanged: in January–August, Asia and Oceania accounted for 74% of global crude steel production, the EU for 7%, and North America for 6%.
II. In-Depth Analysis of Key Overseas Markets
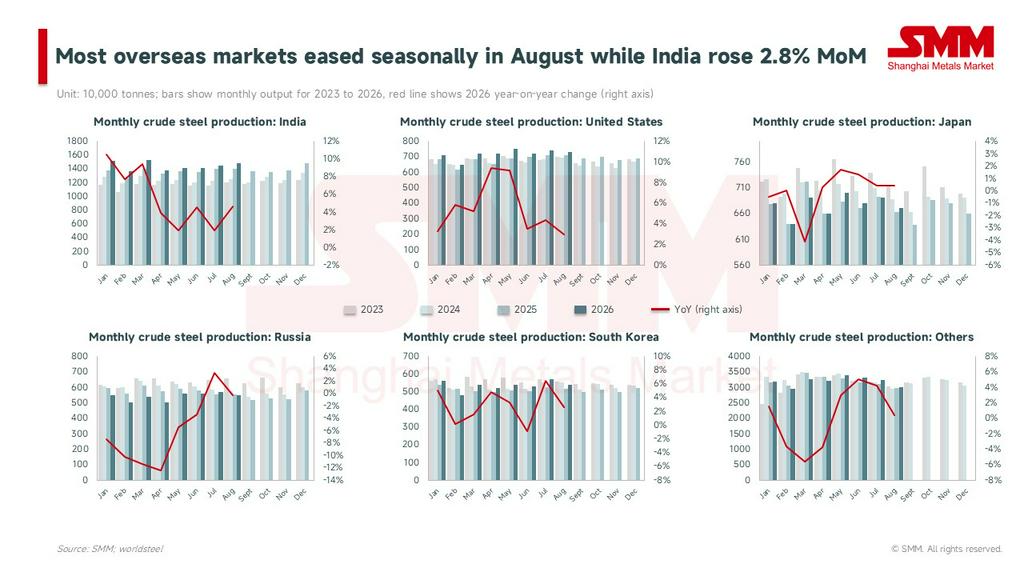
Among the six major markets—India, the United States, Japan, Russia, South Korea, and other regions—output performance diverged in August. "Other regions" (global total excluding China and the aforementioned five countries) produced approximately 29.9 million tonnes in August, up 0.4% YoY, remaining essentially flat compared to the same period last year. Within this statistical basket, the output recovery in the Middle East offset the production cuts in the EU.
1. European Union (27) - Turned Negative YoY (-1.0%), Driven by Previous Inventory Overdraft:
EU output in August was 8.9 million tonnes, down 1.0% YoY and significantly down 15.2% MoM, ending consecutive positive growth in June (+4.6%) and July (+3.8%). While the steep MoM decline has clear seasonal characteristics (August being the traditional European summer holiday period), the YoY contraction was primarily driven by the inventory side rather than the tariff side.
- Inventory Overdraft: To front-run the new tariffs effective July 1, European buyers preemptively stockpiled large volumes of imported inventory between Q4 2025 and Q2 2026. The market shifted into a destocking wait-and-see phase in Q3, leaving mill order books only half-full in September and prompting mills to extend their summer maintenance shutdowns.
- Logistical Constraints: Affected by low water levels on the Rhine River (the Kaub gauge dropped to approximately 55 cm in mid-July), ThyssenKrupp withdrew its own barge fleet and reduced hot metal output in Duisburg. These logistical constraints contributed directly to Germany's 7.1% MoM output decline in August.
- Tariff Realities: Mid-September data from the European Commission indicated that several country quotas within the Q3 window had already been exhausted, including Indian organic coated sheets and welded pipes, Australian HRC, and Chinese sections. Cargoes exceeding the quotas must either pay a 50% tariff or wait at ports for the Q4 quota reset. Despite weak demand, European mills continued to raise prices, validating the logic of tightening imports. The market expects buyers to return to domestic European mills for restocking once imported inventories are depleted in November.
2. Middle East - Contraction Continues to Narrow (-4.6%), Output Recovery Exceeds Expectations:
The YoY decline in Middle Eastern production accelerated its narrowing trend, moving from -27.6% in April to -4.6% in August, closing in on last year's levels. Cumulative Jan–Aug output declined by 7.8%. Contributions from restarted facilities in Iran, such as Hormuzgan and Kish South Kaveh, are ramping up. The return of Middle Eastern supply will begin to pressure the Mediterranean billet and Gulf long products markets again starting in Q4.
3. Russia and Other CIS Countries - Returned to Negative Territory (-5.6%), Base Effect Materializes:
Regional output fell 5.6% YoY in August, with Russia domestic output down 0.3% YoY (compared to +3.3% in July). The fluctuation in the YoY reading was primarily influenced by the base effect collapse in the second half of 2025. The remaining additional shortfall in the region came mainly from member states like Ukraine, Belarus, and Kazakhstan, where combined output dropped from approximately 1 million tonnes in July to about 800,000 tonnes. Cumulative regional output dropped 5.7%, remaining the largest drag on overseas supply.
4. Vietnam - Eve of the High Base Effect:
Vietnam's August output reached 2.7 million tonnes, surging 36.4% YoY and remaining flat MoM, with cumulative output for the first eight months up 29.1% YoY. Given that Hoa Phat Dung Quat Phase 2's No. 2 blast furnace was ignited in September 2025, Vietnam's YoY base will rise significantly starting next month. It is expected that next month's YoY reading will automatically fall back to single digits; this is a base normalization phenomenon rather than an actual production cut.
5. India, South Korea, and Germany - Diverging Trends:
- India: August output was 14.8 million tonnes, up 4.6% YoY, defying seasonal trends to achieve a 2.8% MoM increase, making it the strongest MoM performer among the top 10 steel-producing nations. Cumulative Jan–Aug output grew 6.0% YoY, demonstrating a clear structural capacity expansion trend with step-by-step annual increases.
- South Korea: August output was 5.4 million tonnes, up 2.6% YoY but down 5.3% MoM. The acceleration seen in July's daily average was partially surrendered, mainly due to summer maintenance, but cumulative output maintained a positive growth of +2.8%.
- Germany: August output was 2.6 million tonnes, up 1.7% YoY but down 7.1% MoM. Despite being suppressed by the dual factors of summer holidays and low Rhine water levels, its cumulative growth of +6.3% remains at the forefront of the overseas production growth tier.
6. China - Production Control Takes Effect, Expected Restarts to be Mild:
China's daily average crude steel output in August was 2.4068 million tonnes (-3.0% MoM), and daily average hot metal output was 2.1823 million tonnes (-1.0% MoM). Cumulative Jan–Aug output was 651.9 million tonnes, down 3.1% YoY. Production resumption expectations for September are relatively mild, with the traditional "Golden September" peak season showing strong expectations but weak reality. China's supply restraint, combined with peak season expectations, has driven a rebound in Asian coil prices, causing European imports to lose their cost advantage and simultaneously pulling Turkish scrap prices back up to $400/t. This indicates that the pricing driver in Asia is shifting toward the price side.
III. Core Variables to Monitor in September–October
- EU Policies and Quota Milestones: The new melt-and-pour proof requirements, effective October 1, will directly impact the compliant customs clearance of rerolled materials transiting through regions like Turkey and Vietnam. On the same day, Q4 quotas will reset, and backlogged cargo exceeding previous quotas will be released in a concentrated manner. Catalyzed by European restocking expectations in November (depletion of imported inventory combined with mill price hikes), Q4 EU production is expected to return to positive YoY growth. Additionally, attention should be paid to the first product scope review dynamics of the new regulations on December 31.
- Re-evaluation of International Scrap Pricing: International scrap prices (CFR Turkey) have touched the $400/t mark, driven by multiple factors including Turkish autumn restocking, constrained European domestic supply (such as logistical issues in Benelux), and the diversion of US cargoes. If European EAFs increase production in October due to restocking expectations, there will still be upside room for scrap prices, and the price spread between Asian ports and Turkey will further converge.
- Return of Middle Eastern Supply: The slope of Iran's capacity recovery will determine the timing of supply pressure returning to the Mediterranean billet and Gulf long products markets. If Middle Eastern YoY growth turns positive in September–October, it will become the primary marginal supply increment for overseas long products in Q4.
- Spillover Effects of Chinese Exports: The combination of mild production restarts and rising export prices in China implies that China's role in overseas markets in Q4 is shifting from a "low-price suppressor" to a "price support factor". A potential downside risk lies in a drop in export prices if peak season demand is falsified post-October.
To summarize the current market landscape, while overseas crude steel production YoY growth slowed to 1.6% in August, the cumulative growth for the first eight months remained robust at +2.2%, with an annualized level of 860 million tonnes far exceeding last year's total. The temporary YoY contraction in EU production is primarily attributed to the overdraft from front-running tariffs in the first half of the year and physical logistical constraints; tariff policies themselves remain effective. Looking ahead to the fourth quarter, market dynamics will revolve heavily around the execution of the EU's melt-and-pour policy on October 1, the Q4 quota reset, and the European restocking window in November. The upward trend in international scrap prices has been established, while the anticipated automatic drop in Vietnam's YoY production reading next month due to base effects should be viewed objectively as a statistical normalization rather than a physical decline.
![[SMM Steel] Competitive Vietnam Galvanized Coil Supports EU Sales](https://imgqn.smm.cn/usercenter/JAnHq20251217171716.jpg)
![[SMM Malaysia Weekly Review] HRC Steady; Long Steel Offers Diverge, Semi-Finished Supply Tightens](https://imgqn.smm.cn/usercenter/fljuJ20251217171715.jpg)
![[Weekly Review and Outlook of China Export Prices]](https://imgqn.smm.cn/usercenter/zbJUC20251217171718.jpg)