
Copper Wire Rod Exports in July Pulled Back Nearly 30% MoM, High Copper Prices and High Premiums Suppress Foreign Demand [SMM Analysis]

Published: Aug 21, 2026 17:09
[SMM Analysis: Copper Wire Rod Exports in July Pulled Back Nearly 30% MoM, High Copper Prices and High Premiums Dampened Foreign Demand] In July, total exports of copper wire rod (HS codes 74081100 and 74081900) decreased MoM but increased YoY. The specific data are as follows:......


In July, total exports of copper wire rod (HS codes 74081100 and 74081900) declined MoM but increased YoY. Specific data are as follows:
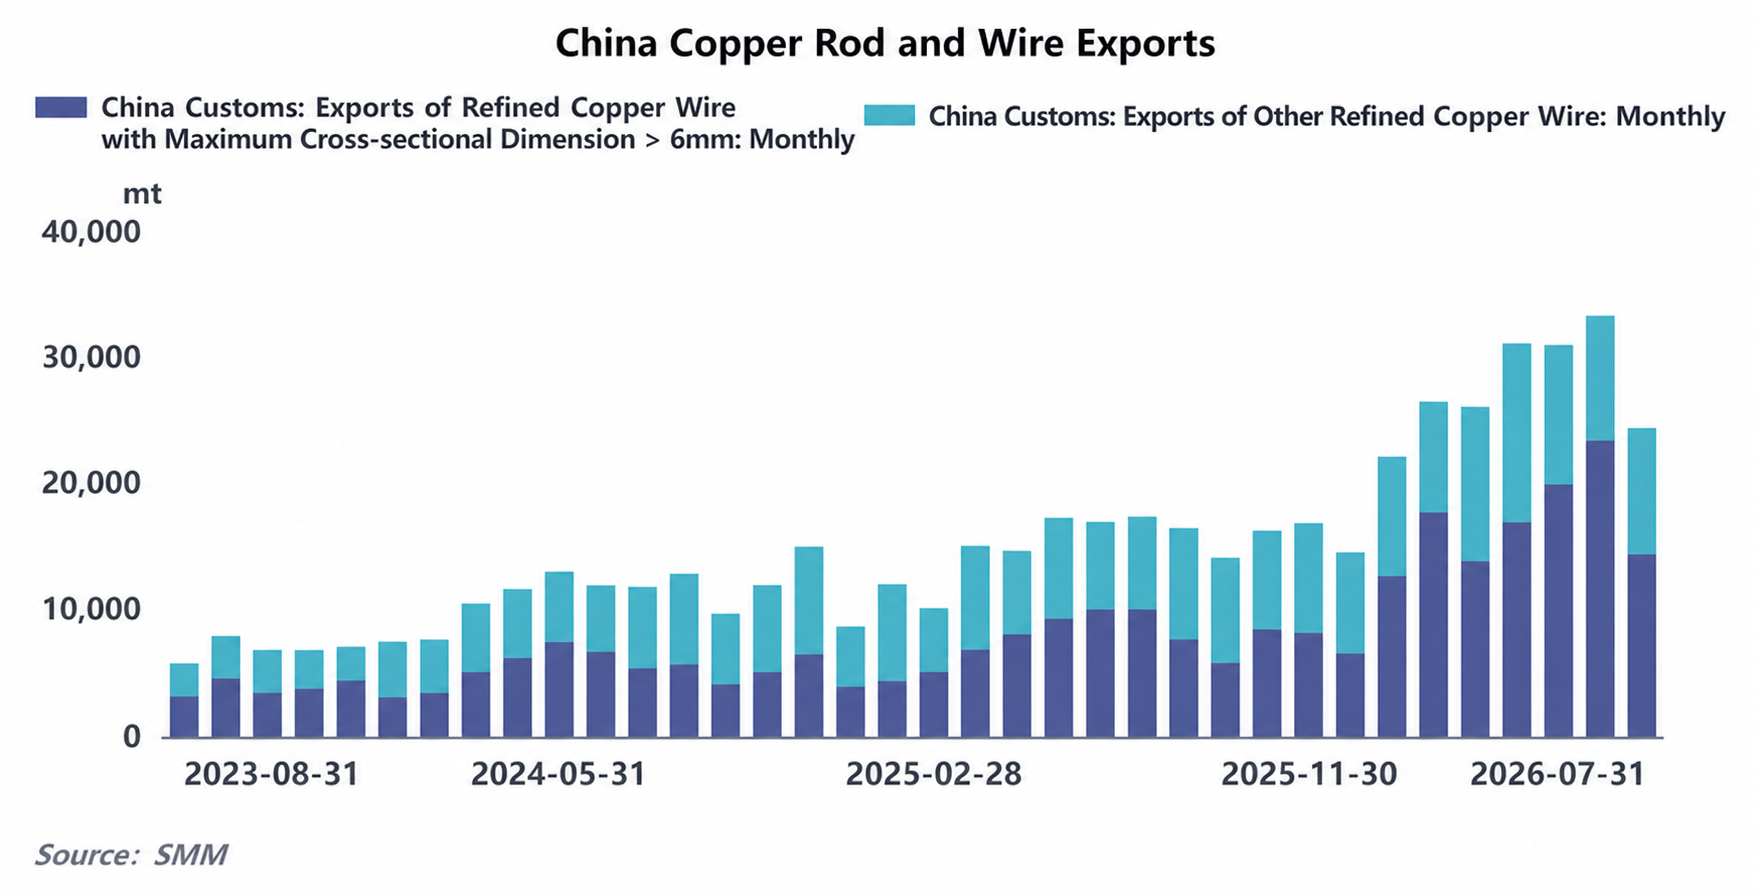
According to customs statistics, China's total exports of copper wire rod stood at 23,800 mt, down 27.01% MoM and up 39.6% YoY. Exports of refined copper wire with a maximum cross-sectional dimension >6 mm were 14,200 mt, down 38.53% MoM and up 43.57% YoY. Monthly exports of other refined copper wire reached 9,700 mt, up 0.62% MoM and up 34.17% YoY.
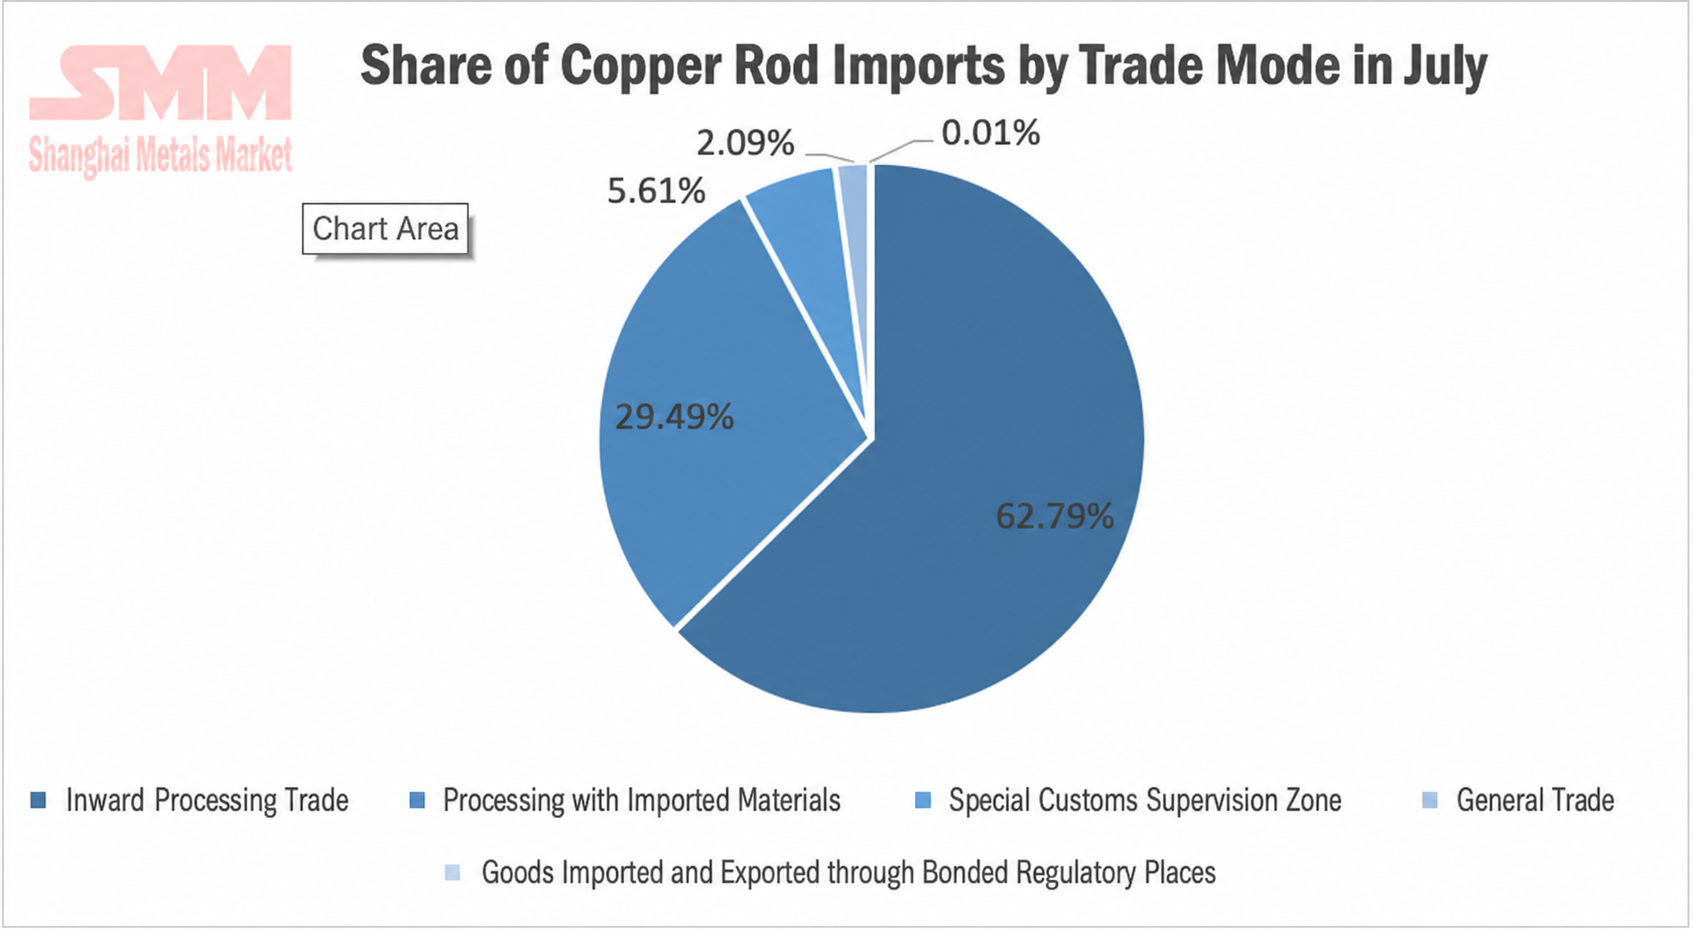
In July 2026, exports of copper wire rod (HS codes 74081100, 74081900) declined notably,driven by higher copper prices and elevated premiums for imported copper, which pushed up export costs and quotes. Overseas inquiries were scarce, with only essential orders underpinning demand.By trade mode, exports of China's copper wire rod in July 2026 remained dominated by processing trade. Among this, processing trade with imported materials accounted for 62.79% of total exports, processing trade with supplied materials for 29.49%, Entrepot Trade by Customs Special Control Area for 5.61%, and Ordinary Trade for 2.09%.
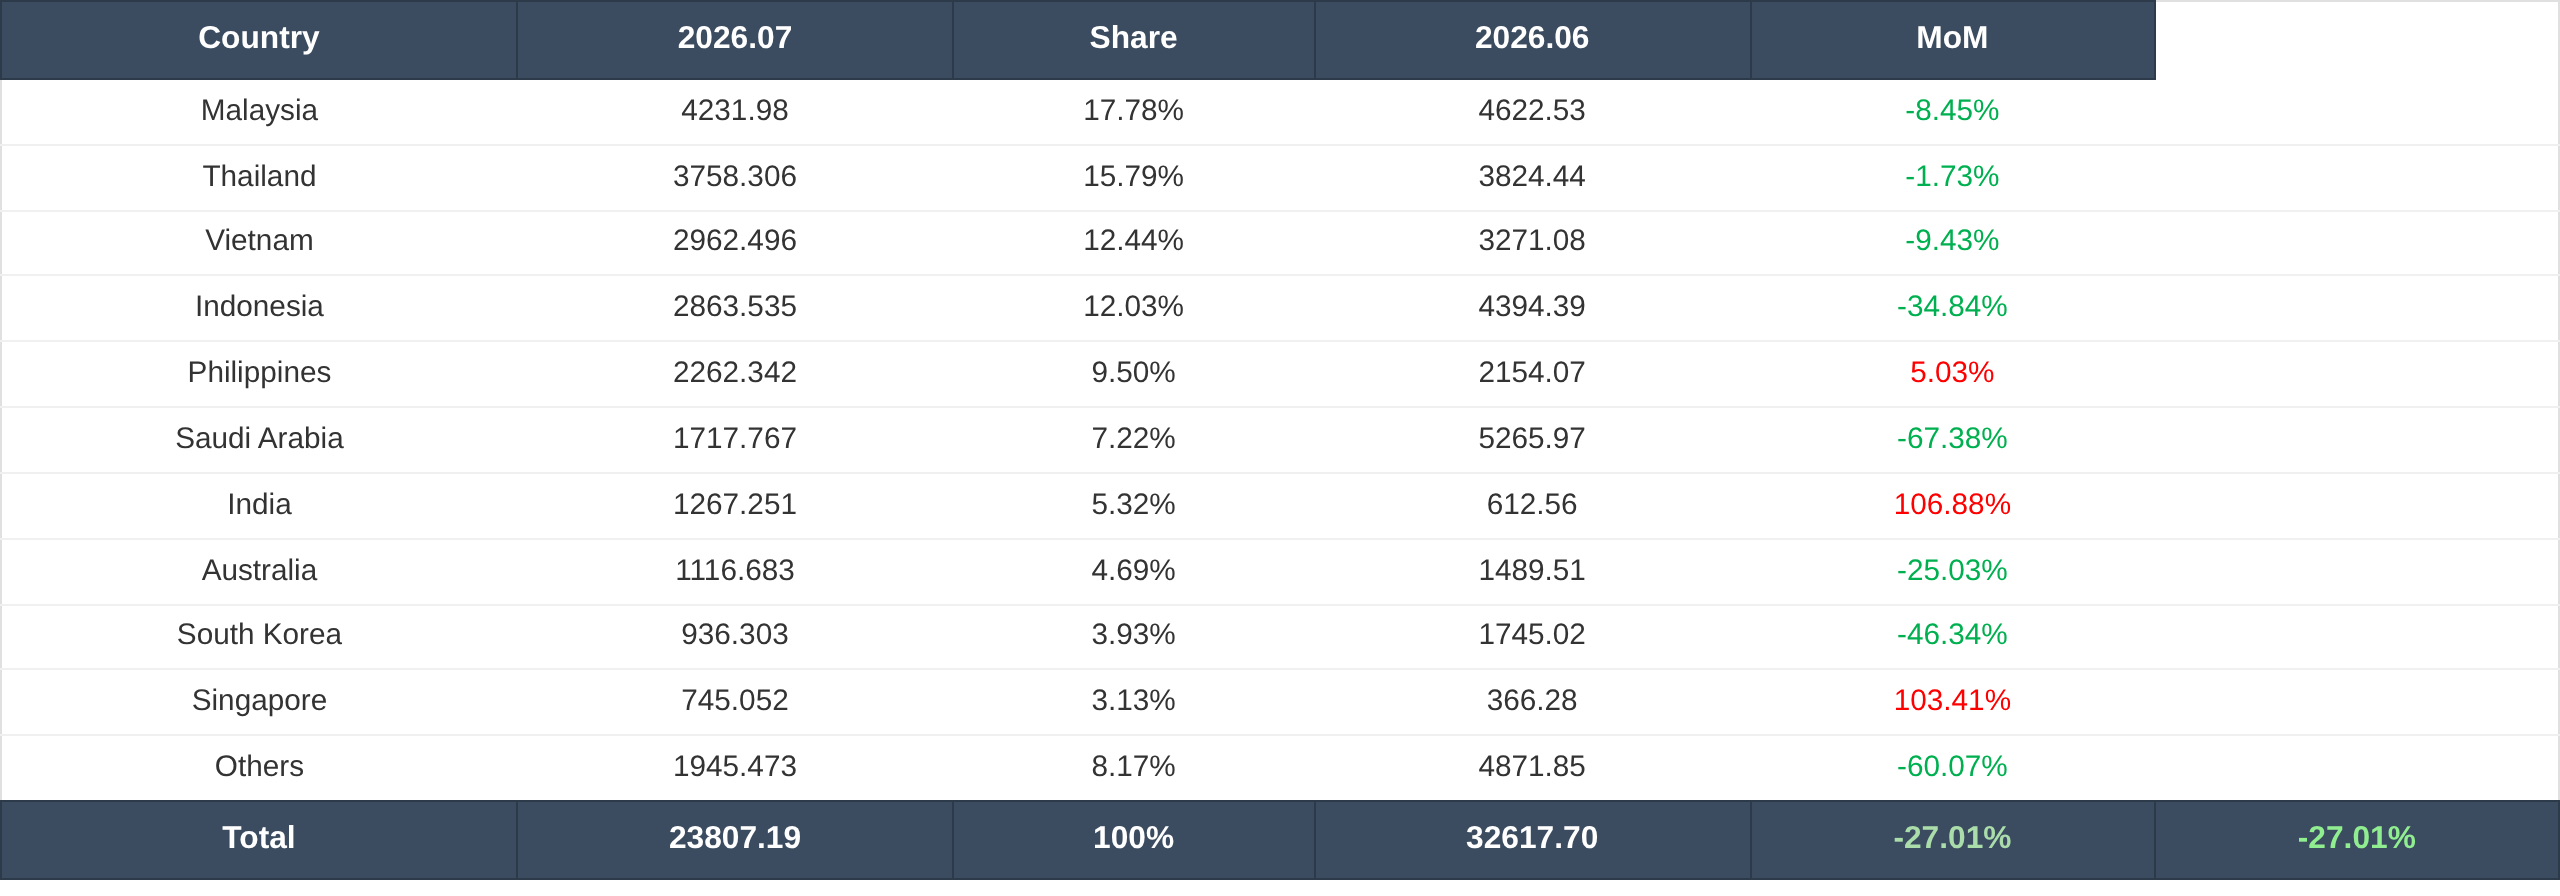
By country, the top five export markets for copper wire rod in July were Malaysia, Thailand, Vietnam, Indonesia, and the Philippines, together accounting for over 60% of total exports, a share down MoM. Malaysia fell 8.45% MoM but remained the top market supported by essential demand. India showed strong performance, boosted by concentrated construction and stockpiling for infrastructure projects such as PV and power grid. Local copper rod capacity could not meet demand, leading to sustained import demand release, which drove China's copper rod exports to India up 106.88% MoM. Exports to other countries fell under pressure from high prices.
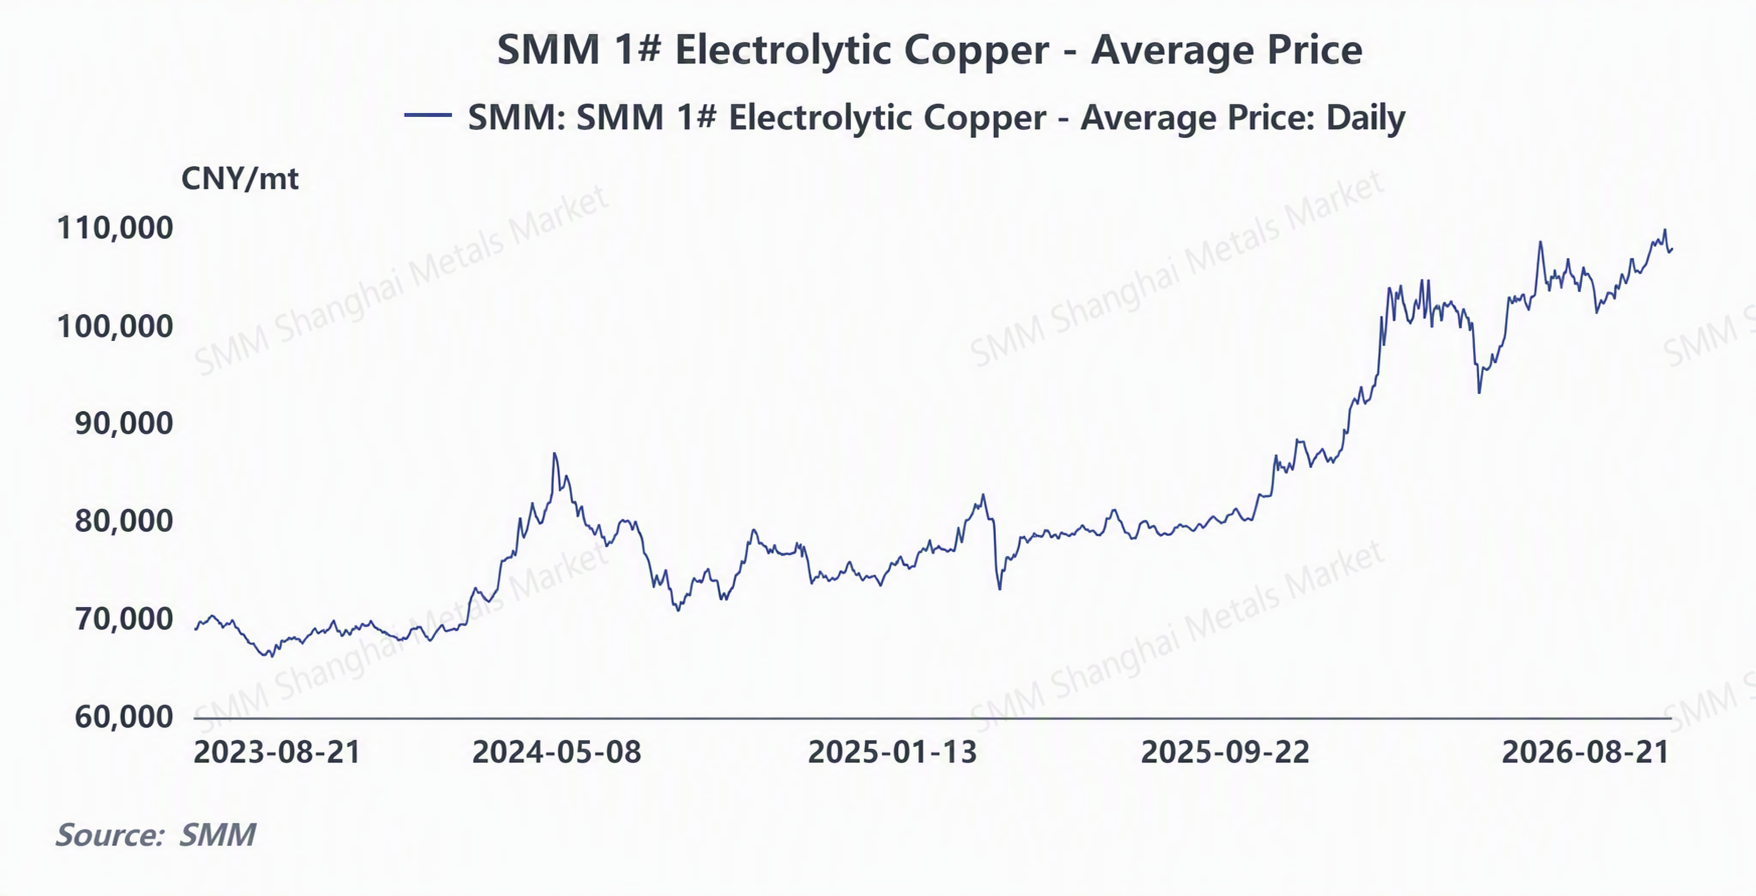
In summary, China's copper wire rod exports fell under pressure in July 2026, with high copper prices and elevated imported copper premiums pushing up export costs, suppressing and delaying overseas demand, ultimately resulting in a MoM decline in export volumes.Entering August, as imported copper premiums pull back and export processing fees decline, the previously suppressed delayed demand is released conentrately, and export orders rebound clearly. It is expected that copper wire rod exports in August will rebound MoM.

Data Source Statement: Except for publicly available information, all other data are processed by SMM based on publicly available information, market communication, and relying on SMM's internal database model. They are for reference only and do not constitute decision-making recommendations.

Images in this article contain AI-translated captions for reference only.

For any inquiries or for more information, please contact: lemonzhao@smm.cn
For more information on how to access our research reports, please contact:service.en@smm.cn
Related News
July Copper Foil Imports and Exports Both Down MoM, YoY Still Maintains High Growth [SMM Analysis]
24 mins ago
July Copper Foil Imports and Exports Both Down MoM, YoY Still Maintains High Growth [SMM Analysis]
Read More
July Copper Foil Imports and Exports Both Down MoM, YoY Still Maintains High Growth [SMM Analysis]
[SMM Analysis: July Copper Foil Imports and Exports Both Down MoM but Still High Growth YoY] According to data from the General Administration of Customs, China's copper foil (HS codes: 74101100, 74102190) imports in July 2026 were 7,908.95 mt, up 22.2% YoY and down 7.06% MoM; cumulative imports from January to July 2026 were 53,039.26 mt, up 13.64% YoY......
24 mins ago
[SMM Flash] China Sulphur and Sulphuric Acid Import and Export Data for July
1 hour ago
[SMM Flash] China Sulphur and Sulphuric Acid Import and Export Data for July
Read More
[SMM Flash] China Sulphur and Sulphuric Acid Import and Export Data for July
[SMM Flash] China Sulphur and Sulphuric Acid Import and Export Data for July
n July 2026, China's total monthly sulphur imports were 385,403.834 mt in physical content, up 161.99% MoM and down 64.76% YoY, with major import sources being the UAE, Oman, Kuwait, Japan, and Taiwan, China. China's total monthly sulphur exports were 1,311.35 mt in physical content, down 96.35% MoM and up 47.87% YoY, with major export destinations being Indonesia, Myanmar, Vietnam, South Korea, and Cambodia. China's total monthly sulphuric acid imports were 1,066.527 mt in physical content, down 94.56% MoM and down 88.11% YoY, with major import sources being Taiwan, China, South Korea, Germany, the US, and Japan. China's total monthly sulphuric acid exports were 976.24 mt in physical content, up 8.82% MoM and down 99.75% YoY, with major export destinations being Hong Kong, China, Vietnam, Angola, Cambodia, and Singapore.
1 hour ago
[SMM Flash] Canada Sulphur and Sulphuric Acid Import and Export Data for June
1 hour ago
[SMM Flash] Canada Sulphur and Sulphuric Acid Import and Export Data for June
Read More
[SMM Flash] Canada Sulphur and Sulphuric Acid Import and Export Data for June
[SMM Flash] Canada Sulphur and Sulphuric Acid Import and Export Data for June
In June 2026, Canada's total monthly sulphur exports were 527,305 mt, down 15.43% MoM and 8.62% YoY, with major export destinations being Indonesia (198,612 mt), the US (158,031 mt), Chile (54,672 mt), Guinea (41,272 mt), and China (32,730 mt), among others; Canada's total monthly sulphur imports were 1,035 mt, down 20.08% MoM and up 3.19% YoY, with major importing countries being the US (912 mt) and China (105 mt), among others; Canada's total monthly sulphuric acid exports were 123,140 mt, up 101% MoM and down 12.086% YoY, with the US as the main export destination and a minimal amount to Morocco; Canada's total monthly sulphuric acid imports were 11,160 mt, down 66.059% MoM and up 8.0132% YoY, with the US (11,080 mt) as the main import source, among others.
1 hour ago
Register to Continue Reading
Gain access to the latest insights in metals and new energy
Already have an account?Sign in here