Key points: In July 2026, China imported only 17,000 mt of phosphate ore, down 87.3% MoM, hitting a near three-year low; exports fell to zero. Average import price was $84.5/mt, down 7.6% MoM. Among importing provinces, only Guangxi maintained 14,000 mt, while the rest fell to zero; source country Egypt's volume plummeted 81%, while Kazakhstan saw a marginal increase. Exports surged in June but fell to zero in July, mainly due to order fulfillment, off-season demand, and regulatory policies. Imports are unlikely to rebound in the short term; watch for winter stockpiling and export policy changes.
I. Total Imports: 17,000 mt, Down 87.3% MoM, Hitting a Periodic New Low
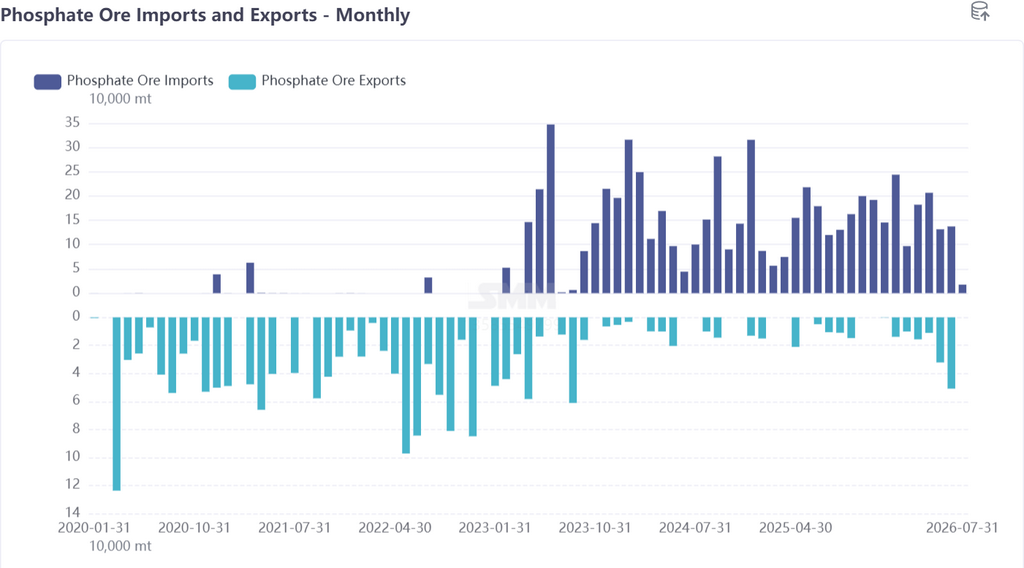
In July 2026, China imported only 17,000 mt of phosphate ore, down 87.3% MoM from 137,000 mt in June.
From the monthly trend, imports experienced a cliff-like decline. In January 2026, the single-month volume of 243,900 mt was the H1 peak; April's 206,600 mt and March's 182,100 mt stayed high; May plummeted to 131,000 mt due to Egypt's policy impact; June rebounded slightly to 137,000 mt; then July further collapsed to 17,000 mt, the lowest monthly import volume in nearly three years.
The core constraining factors behind this plummet included sustained high sulfur prices, weak demand from phosphate fertiliser producers, and a slowdown in China's procurement during the off-season. In July, upstream phosphate ore mines in China were disrupted by environmental protection, safety supervision, and mining license renewal; supply side continued to have contraction expectations. However, downstream traditional phosphate fertiliser demand was in the off-season, with overall transactions stagnant.
II. Import Value and Average Price: Total Value Fell to $1.479 Million, Average Price $84.5/mt
In terms of import value, July's total phosphate ore import value was only $1.479 million, down 88.2% MoM from $12.567 million in June, basically matching the decline in import volume.
In terms of average import price, the national average in July was $84.5/mt, down 7.6% MoM from $91.5/mt in June.
III. Import Province Pattern: Guangxi Alone Held the Line, Other Provinces Nearly All Fell to Zero
The import pattern by province showed a comprehensive contraction in July, with imports from all provinces except Guangxi basically falling to zero.
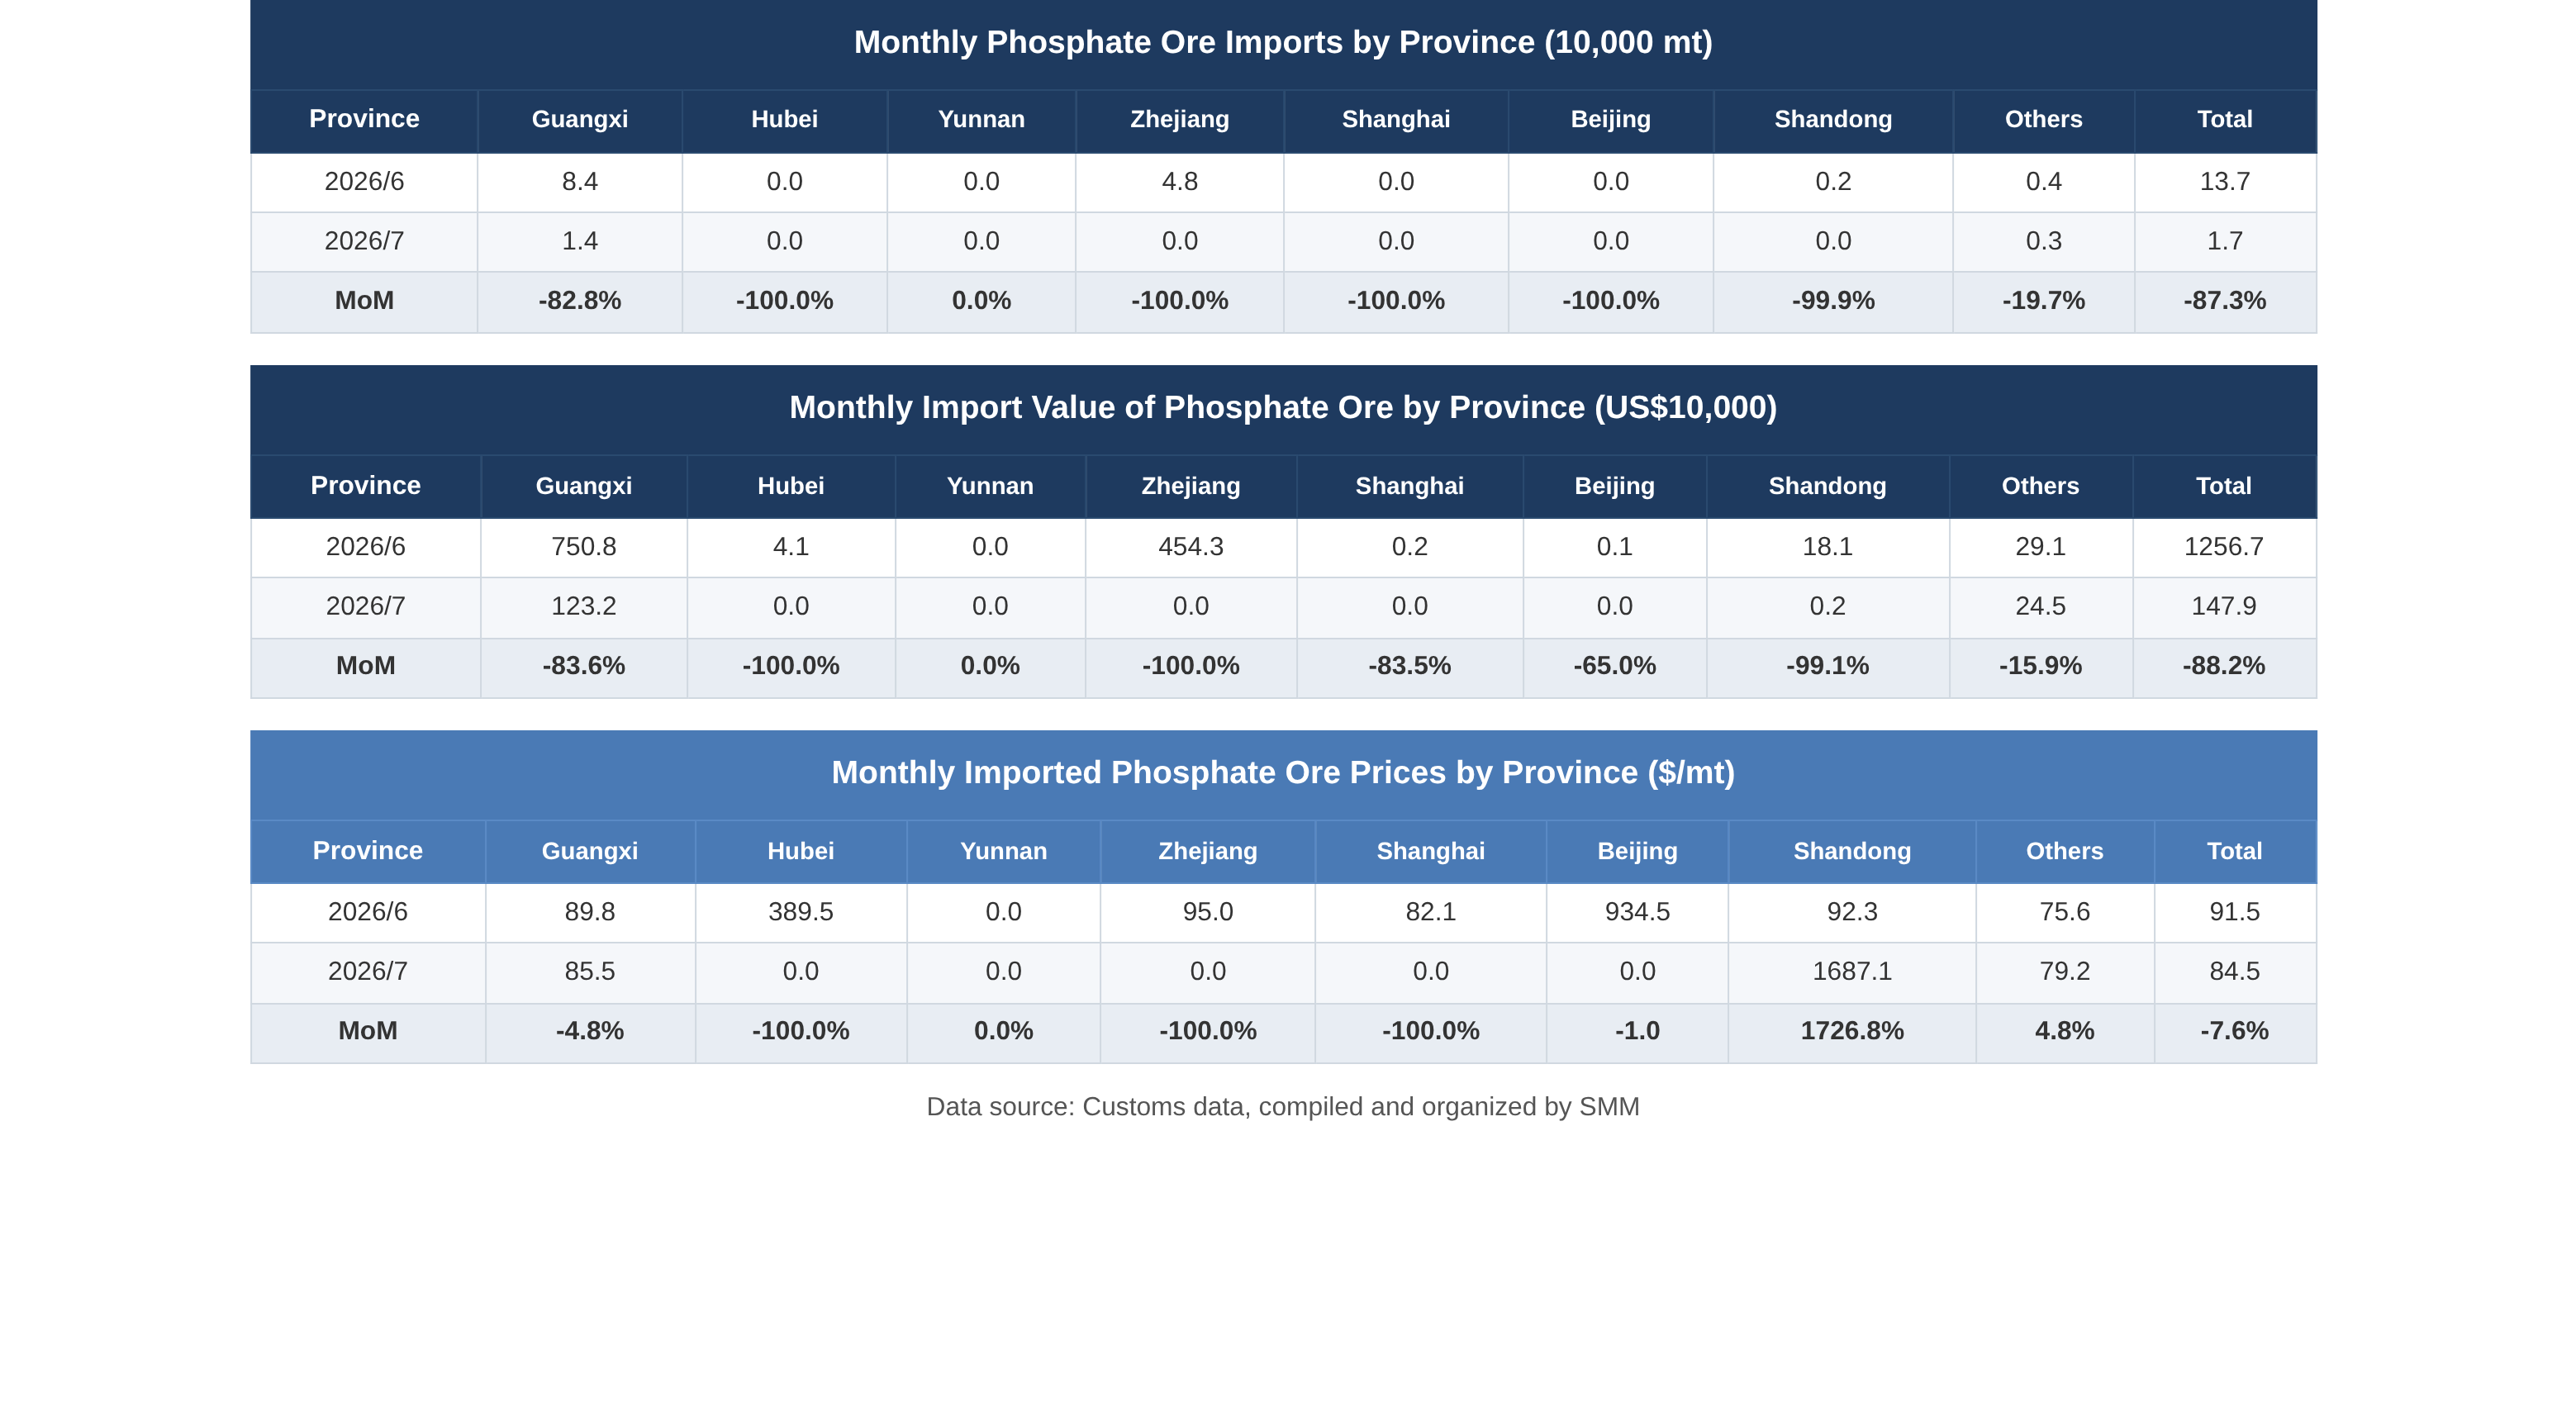
3.1 Guangxi: Import volume 14,000 mt (down 82.8% MoM), import value $1.232 million (down 83.6% MoM), unit price $85.5/mt (down 4.8% MoM). Despite the significant MoM decline, Guangxi remained the only province with sizable imports, continuing its traditional unloading advantages for sources from North Africa and the Middle East, such as Egypt and Jordan.
3.1 Other Provinces Total: Import volume only 3,000 mt (down 19.7% MoM), import value $245,000 (down 15.9% MoM), unit price $79.2/mt.
Hubei, Yunnan, Zhejiang, Shanghai, Beijing, and Shandong: imports all returned to zero in July. Among them, Zhejiang, after experiencing a MoM surge of about 89 times to 48,000 mt in June, returned to zero in July; Beijing maintained small-batch imports at a high unit price of $934.5/mt in June, and also returned to zero in July.
The import provinces abruptly changed from a diverse spread in June (Guangxi, Zhejiang, Shandong, etc.) to "Guangxi standing alone" in July, reflecting a comprehensive contraction on the downstream purchasing side during the off-season demand.
4. Import Source Country Landscape: Egypt Dominant but Scale Plummets
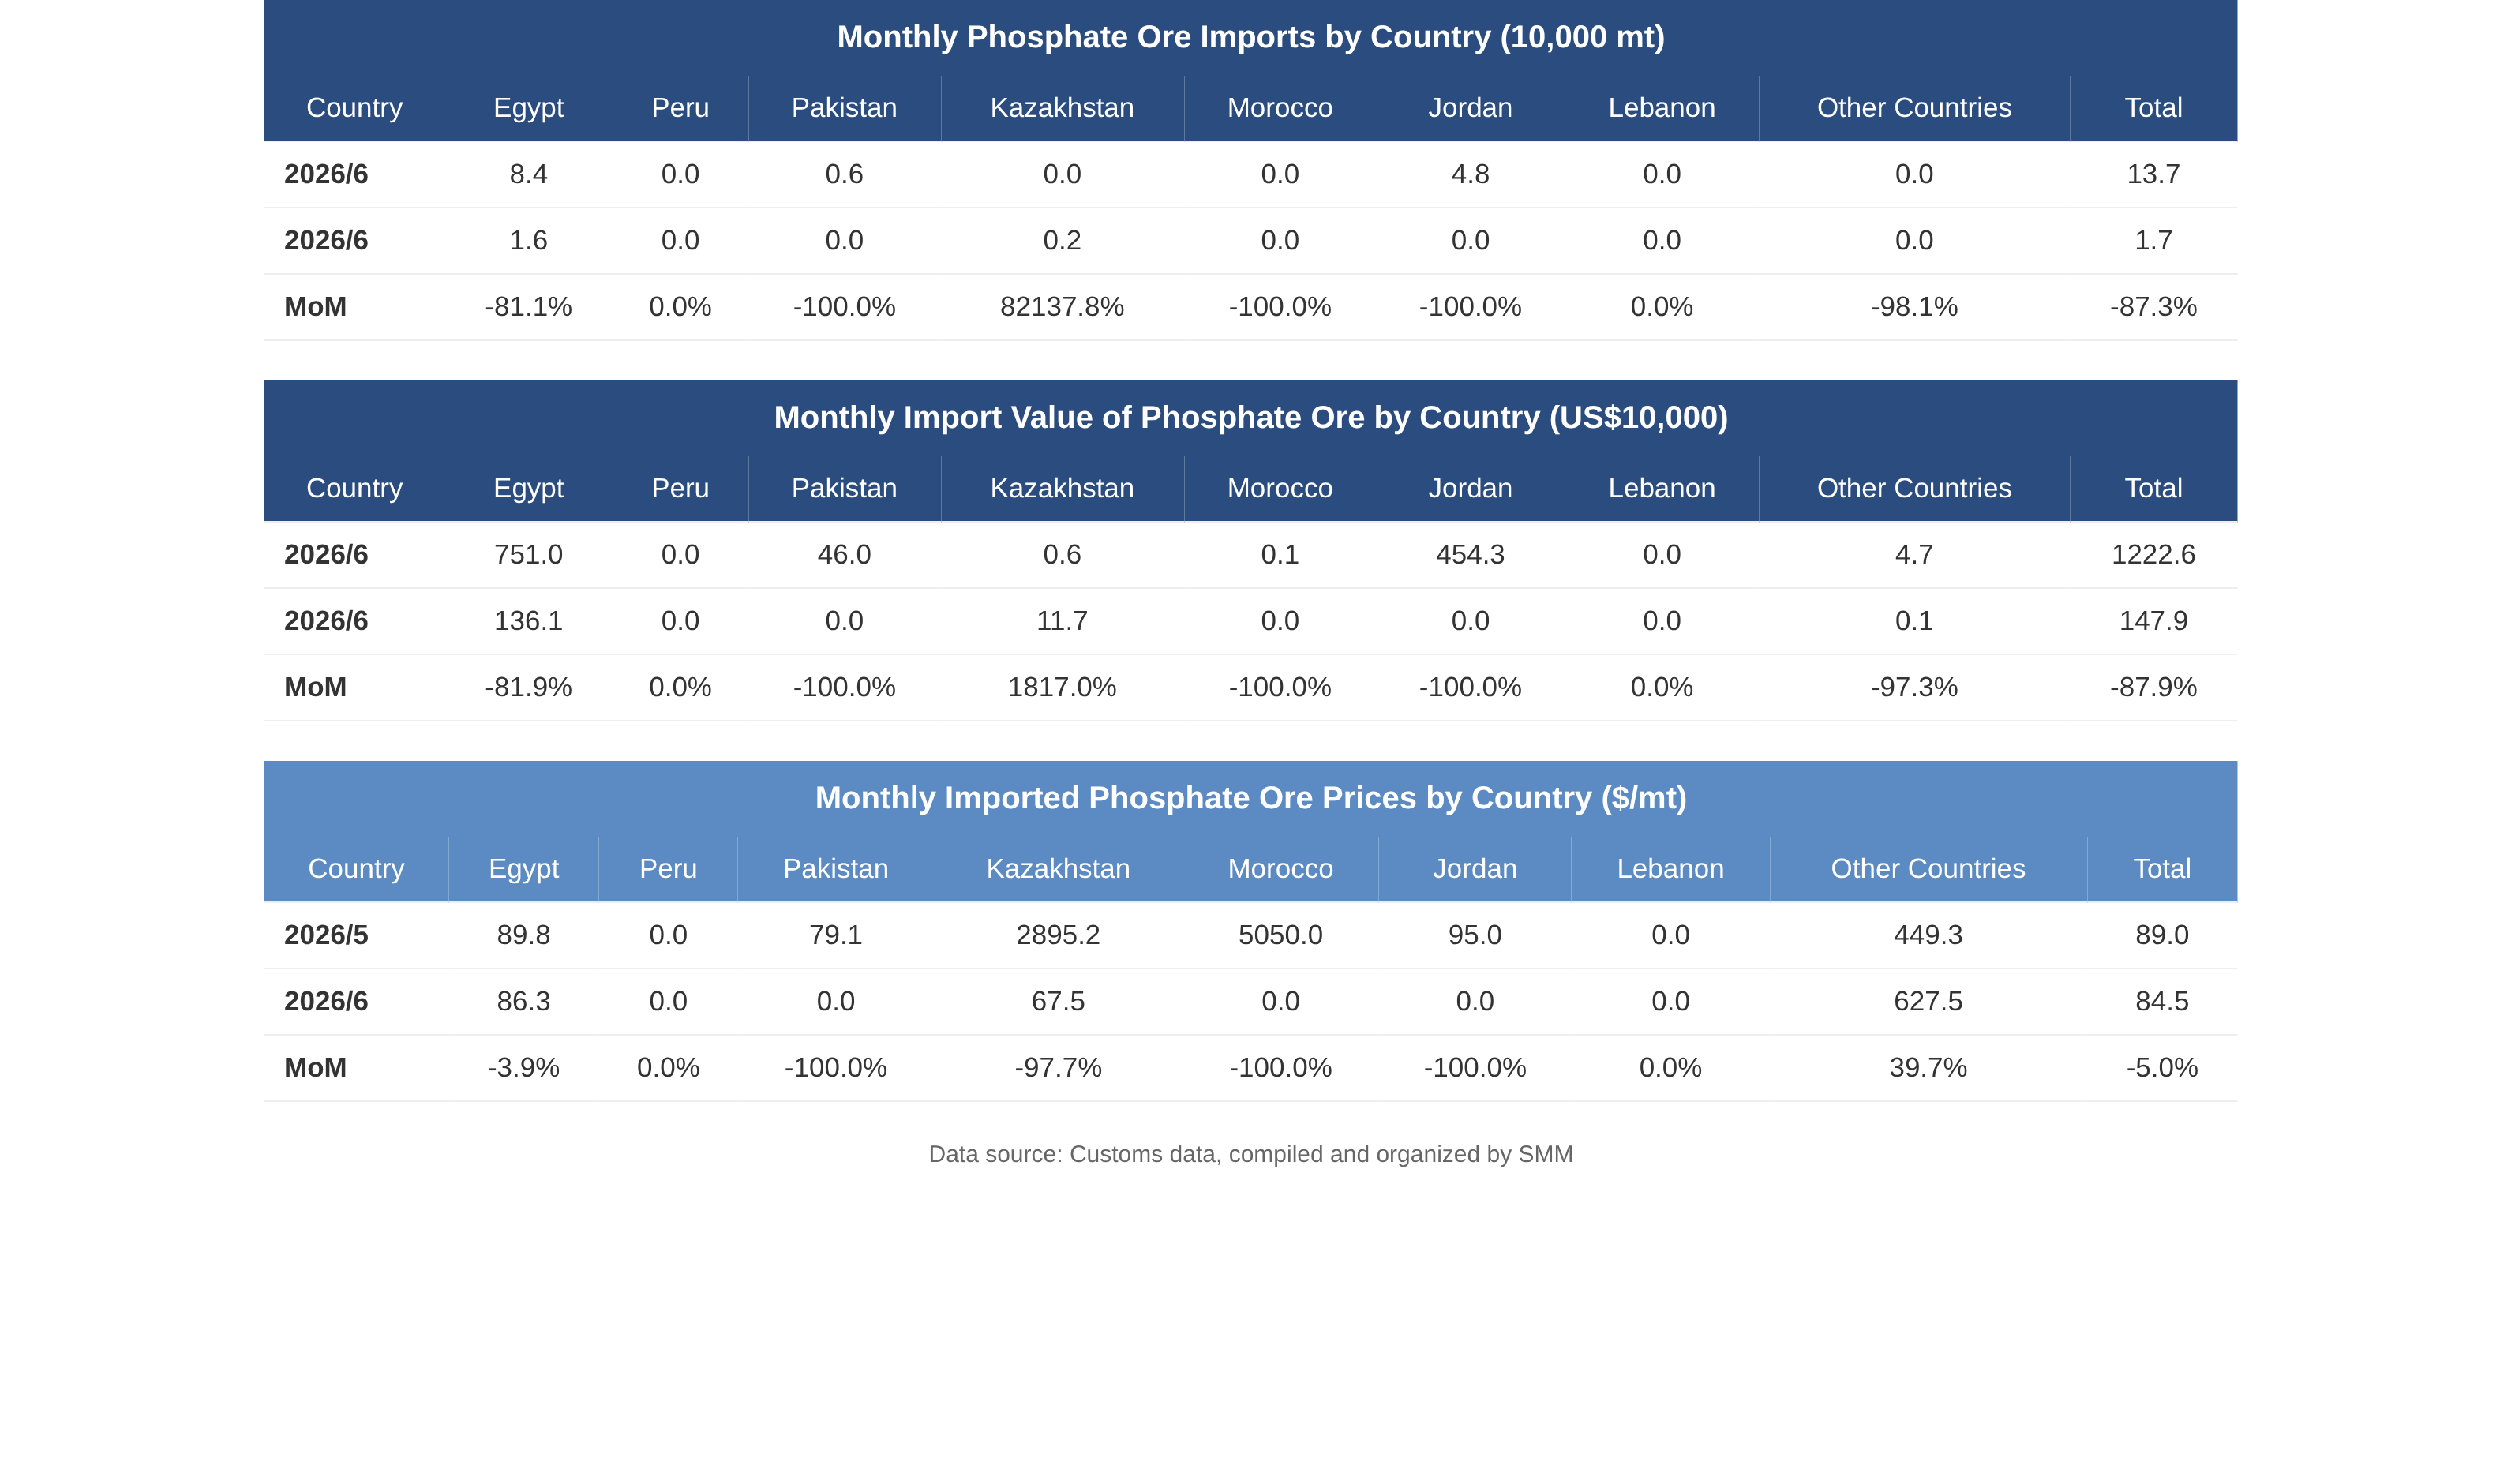
July source country data were highly consistent with provincial data. In June, Egypt with 84,000 mt (accounting for about 61%) and Jordan with 48,000 mt were the main source countries; in July, total volume collapsed to 17,000 mt, with import scales from all source countries declining in step:
Egypt:16,000 mt (down 81.1% MoM), import value $1.361 million (down 81.9% MoM), unit price $86.3/mt (down 3.9% MoM)
Kazakhstan:2,000 mt (up 82,137.8% MoM), import value $117,000 (up 1,817.0% MoM), unit price $67.5/mt (down 97.7% MoM)
Other countries:small and negligible imports
Although Egypt's share remained dominant, its absolute volume shrank from 84,000 mt in June to 16,000 mt, a decline of 81%. The previous market expectations that "alternative supply sources such as Jordan and Morocco would continue to ramp up" did not materialize in July, and the simultaneous contraction across all source countries reflects that the contraction on the demand side was the main cause, rather than a simple shift in source countries.
5. Exports: Return to Zero in July after June Surge
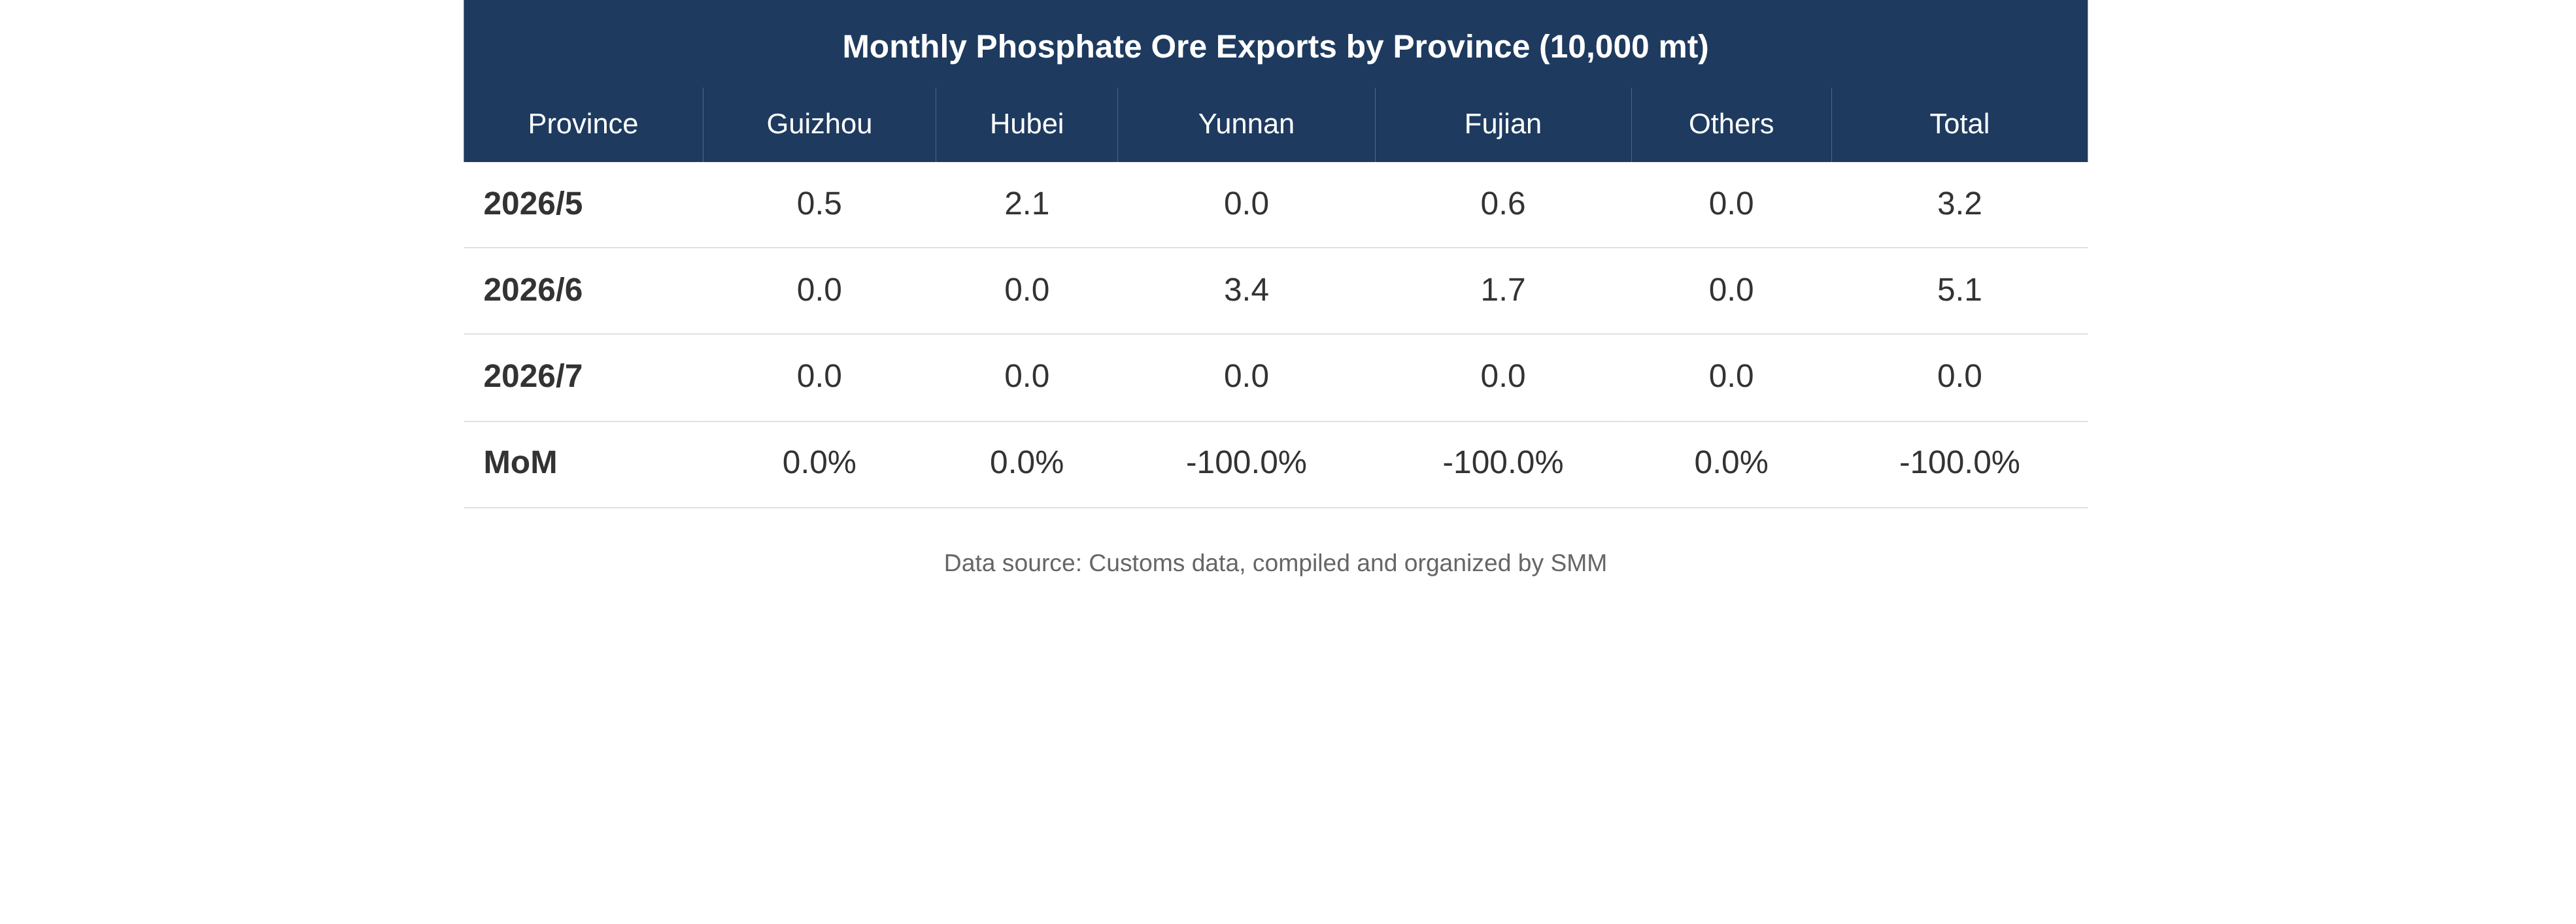
In July 2026, China's phosphate ore exports were zero, plunging 100% MoM from 51,000 mt in June.
The June exports of 51,000 mt were the H1 peak, driven mainly by the "last-chance effect" after Egypt announced on May 13 that it would stop signing new phosphate ore export contracts, with domestic enterprises rushing to complete concentrated deliveries of export orders before the window closed. In the June export structure, Yunnan jumped to the top with 34,000 mt (no exports in May), and Fujian exported 17,000 mt (up 158.5% MoM).
Entering July, with the completion of delivery of previous orders, exports came to a complete halt. In addition, in July, China's phosphate ore was affected by disturbances from environmental protection, safety supervision, and mining rights certificate renewal, leading to contraction expectations on the supply side; downstream traditional phosphate fertiliser demand was in the off-season; coupled with the Ministry of Commerce's export licensing management for phosphate ore and strengthened expectations of strategic mineral controls, multiple factors jointly led to the return to zero of exports in July.
SMM previously predicted that exports from July to September would be about 100,000-200,000 mt, but based on the actual data for July, the pace of export recovery may be slower than expected. Close attention should be paid to the export policies and order recovery in August-September.
VI. Summary
Import side:Total volume of 17,000 mt plunged 87.3% MoM, hitting a new low for the period; average import price of $84.5/mt fell 7.6% MoM; the provincial pattern abruptly changed from a diversified distribution in June to a situation where Guangxi alone supported the imports, while Hubei, Zhejiang, Beijing, etc. all dropped to zero; source countries also shrank synchronously, with Egypt still dominating but its absolute scale plummeting 81%.
Export side:After a pulse surge of 51,000 mt in June, exports directly dropped to zero in July, caused by a combination of factors including the completion of previous order deliveries, contraction of domestic supply, off-season demand, and export controls.
Market outlook: In the near term, imports are unlikely to rebound significantly, as low operating rates of downstream phosphate fertilisers continue to suppress procurement demand. On the export side, close attention should be paid to the marginal demand changes brought by the implementation of export policies for TSP and SSP in August, as well as the pace of winter stockpiling procurement in H2. For the full year, imports in H1 have already reached 998,200 mt; even if the pace slows down in H2, the total annual import volume will remain at a relatively high level. On the export side, cumulative exports in H1 of 133,900 mt surged 226% YoY; whether exports can resume volume in H2 will depend on the domestic supply-demand balance and policy direction.
Note: If you have any supplements to the details mentioned in this article or are interested in issues related to phosphorus chemicals (phosphate ore, iron phosphate, LFP, etc.) and solid-state batteries, feel free to contact us. Contact information:
Tel: 021-20707860 (or add WeChat: 13585549799), Yang Chaoxing. Thank you!
![Cobalt Products Quotations in the Doldrums; Refined Cobalt Has Dropped Over 20,000 Yuan in a Single Week; Cobalt Sulphate Quotations Have Fallen for Five Consecutive Days! [Weekly Review]](https://imgqn.smm.cn/usercenter/Jgxij20251217171726.jpg)
![[Lithium Battery: Panasonic Plans To Divest European Power And Battery Business]](https://imgqn.smm.cn/usercenter/PPLUj20251217171727.jpg)