Recently, the China Automotive Power Battery Industry Innovation Alliance released the monthly power battery data for July 2026.
The data showed that in July, China’s power battery installations totaled 74.6 GWh, down 2.5% MoM and up 33.5% YoY. From January to July, China’s cumulative power battery installations reached 410.2 GWh, up 15.4% YoY on a cumulative basis.
In terms of market concentration,in July, a total of 31 power battery enterprises in China’s NEV market achieved installation matching, down by 2 enterprises compared to the same period last year. Power battery installations by the top 2, top 5, and top 10 power battery enterprises were 45.7 GWh, 60.0 GWh, and 70.4 GWh, respectively, accounting for 61.2%, 80.5%, and 94.3% of total installations, respectively; the top 10 share was flat YoY.
From January to July, a total of 40 power battery enterprises in China’s NEV market achieved installation matching, down by 8 enterprises compared to the same period last year. Power battery installations by the top 2, top 5, and top 10 power battery enterprises were 257.3 GWh, 329.9 GWh, and 384.3 GWh, respectively, accounting for 62.7%, 80.4%, and 93.7% of total installations, respectively; the top 10 share fell by 0.5 percentage points YoY.
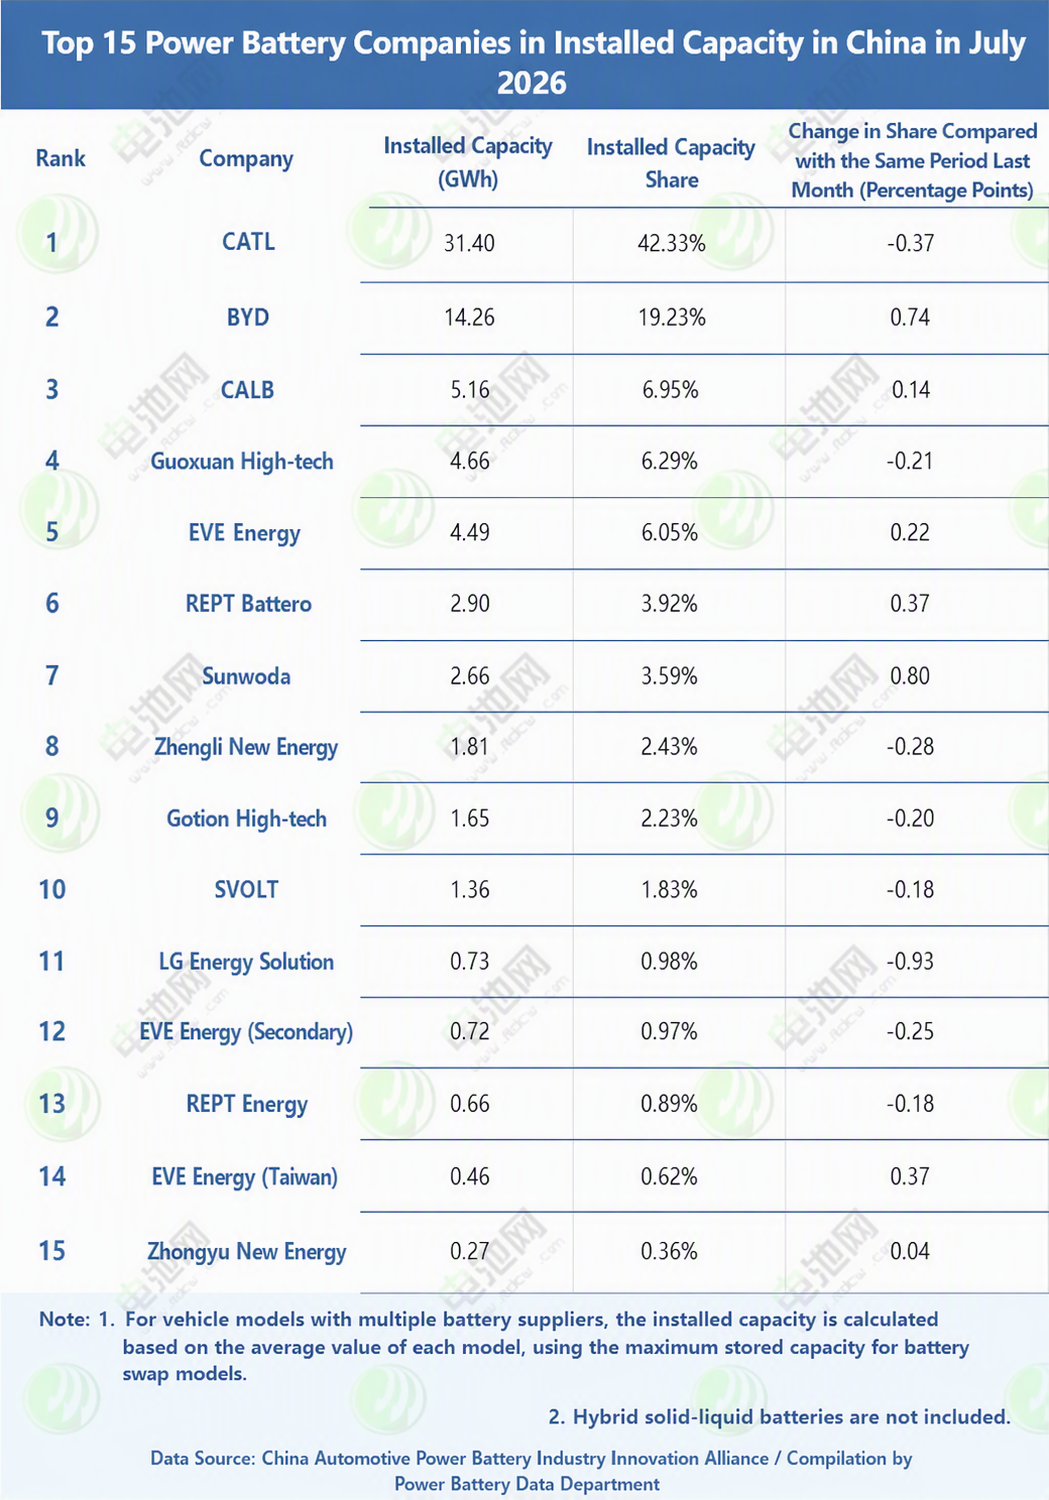
In terms of market share,among China’s TOP15 power battery enterprises, compared with June, in July, LG Energy Solution posted the largest decline, while CATL’s decline narrowed significantly; BYD, CALB, EVE, REPT Battero, Sunwoda, Gotion High-tech, and China Auto New Energy recorded increases to varying degrees.
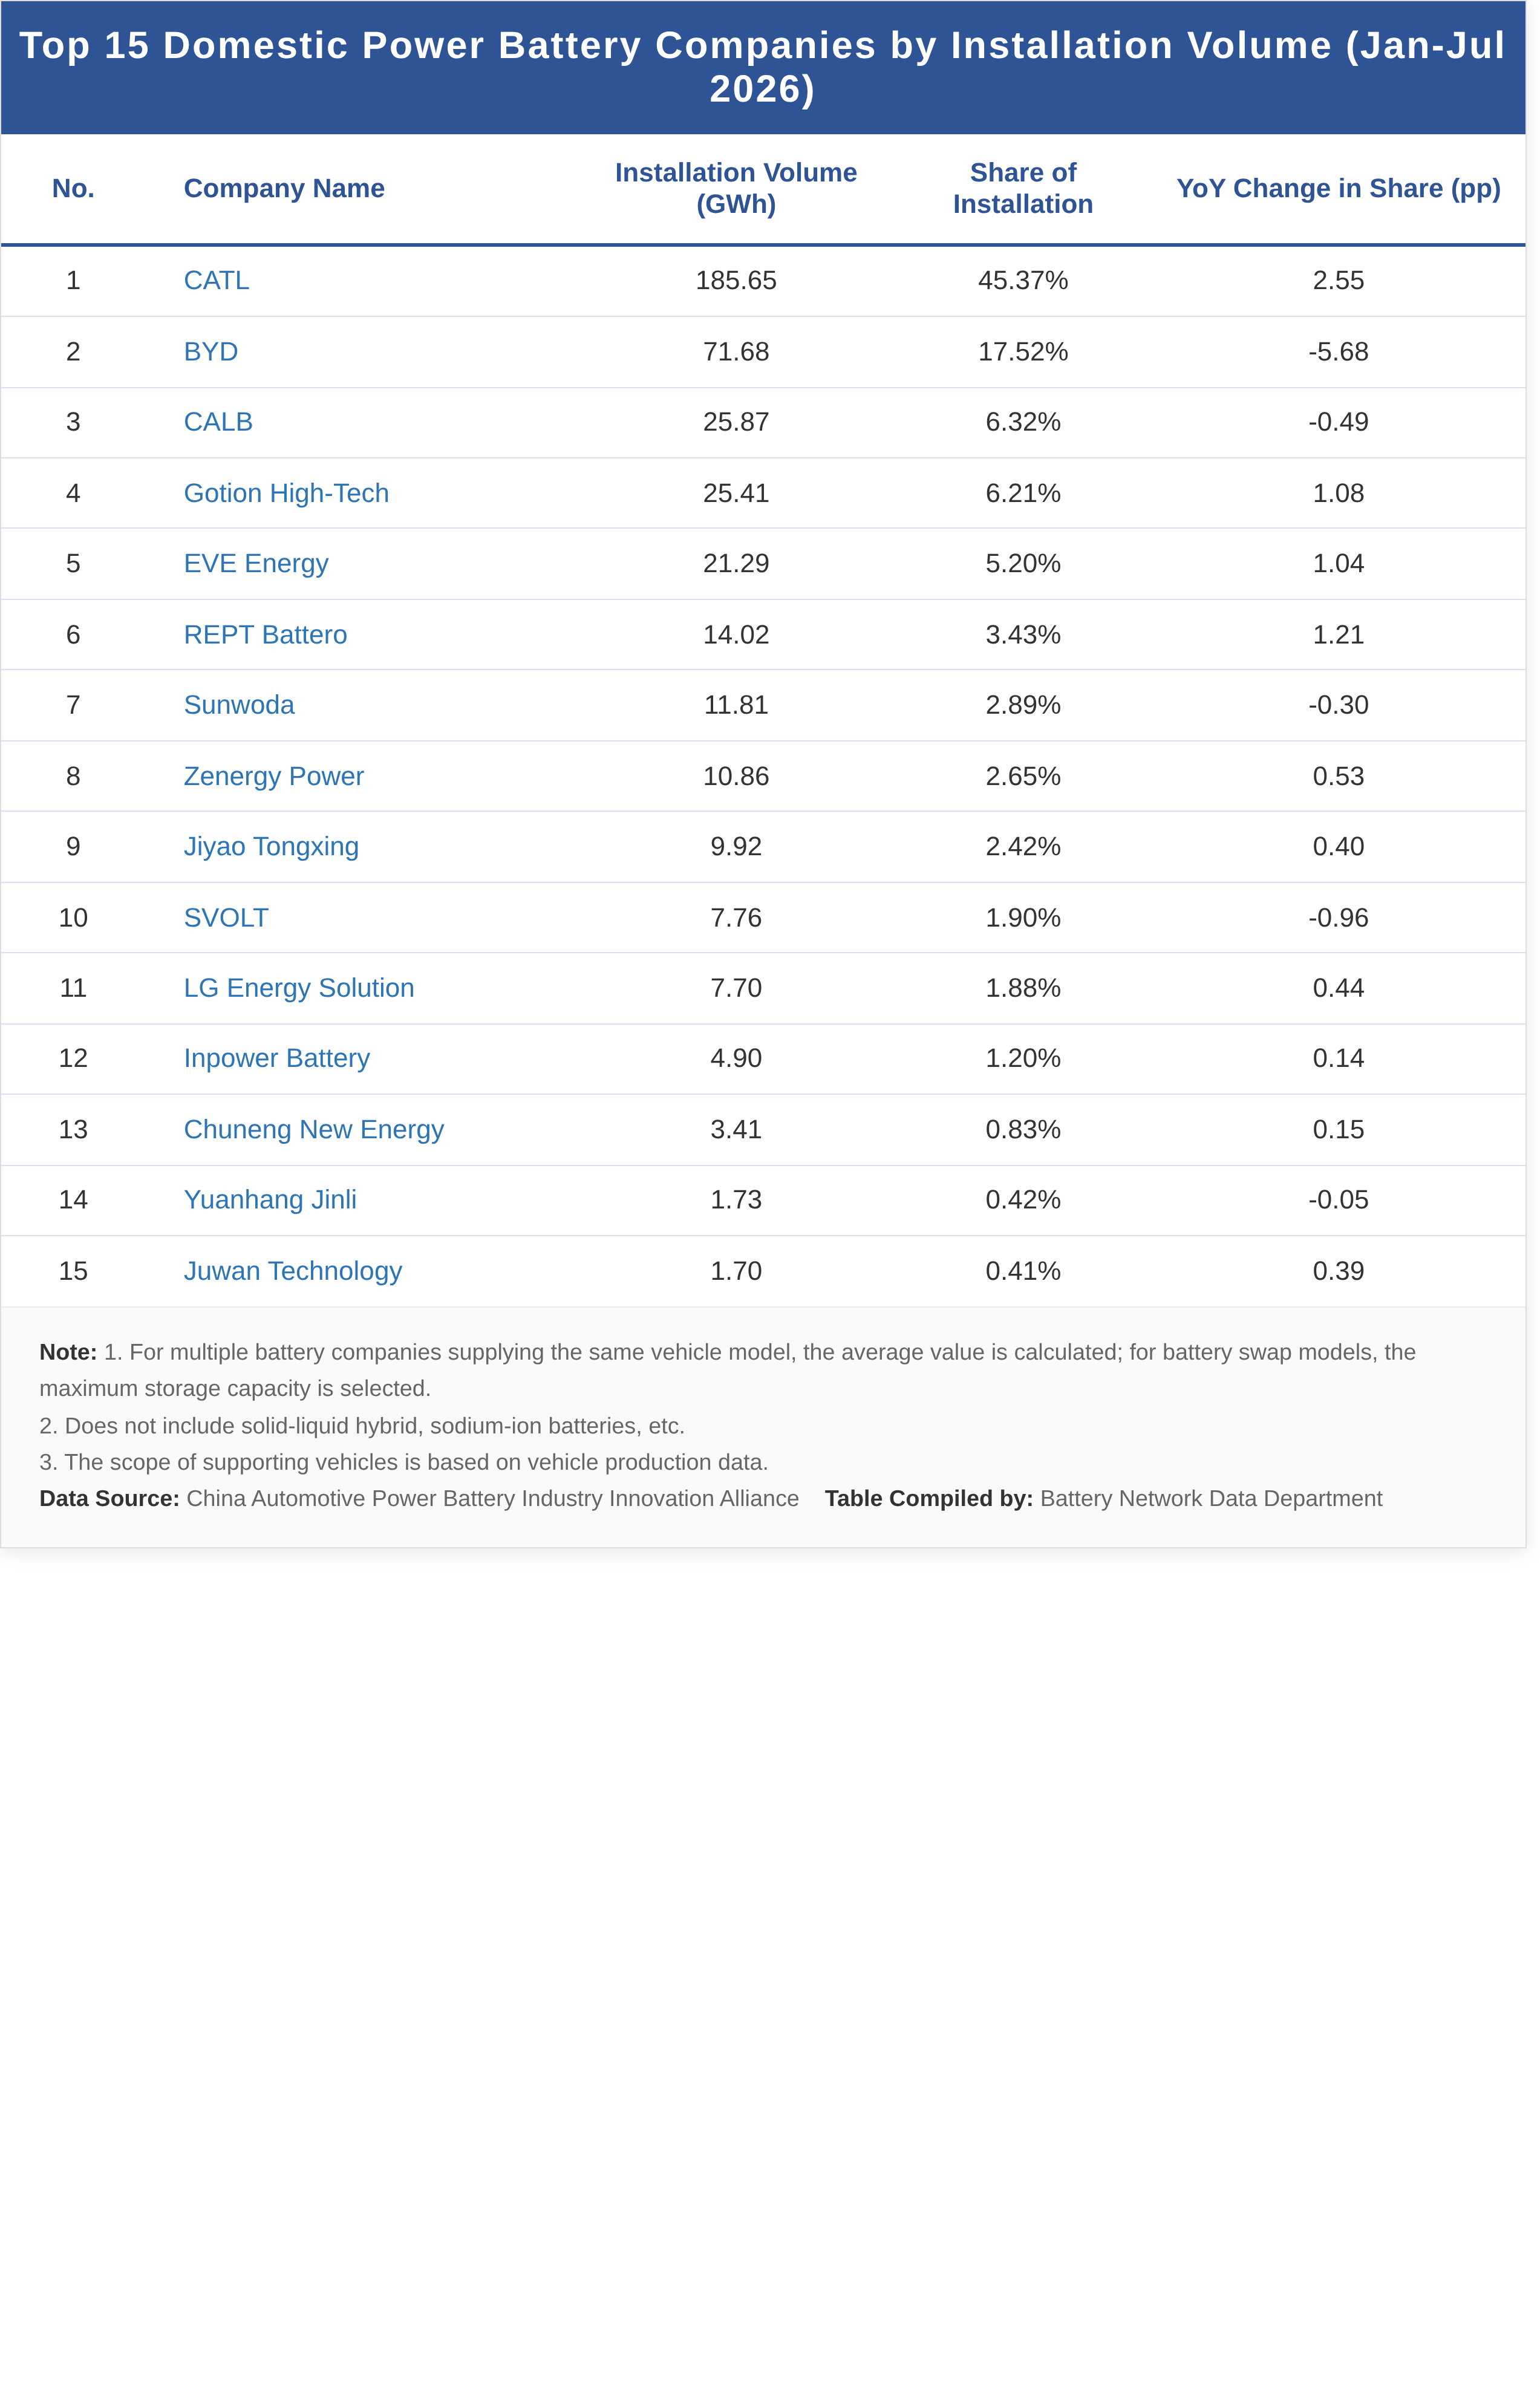
Compared with the same period in 2025, from January to July this year, CATL, Gotion High-tech, EVE, REPT Battero, Zenergy, Jiyao Tongxing, LG Energy Solution, Yinpai Battery, CORNEX New Energy, and Gotion High-tech recorded increases to varying degrees; among them, CATL posted the largest increase, at 2.55 percentage points.
In terms of changes in the domestic TOP15 power battery rankings,compared with June, in July, the TOP13 rankings remained unchanged; Gotion High-tech re-entered the list, replacing Sany Hongxiang, ranking 14th, while Sany Hongxiang dropped out; 15th place remained China Auto New Energy.
Compared with the same period in 2025, from January to July this year, the TOP5 rankings remained unchanged; REPT Battero rose from 8th to 6th; Sunwoda fell by one place to 7th; Zenergy and Jiyao Tongxing each rose by one place, ranking 8th and 9th, respectively; SVOLT fell from 7th to 10th; LG Energy Solution and Yinpai Battery remained unchanged, ranking 11th and 12th, respectively; CORNEX New Energy and Yuanhang Genlead each rose by one place, ranking 13th and 14th, respectively; Gotion High-tech entered the list, ranking 15th.
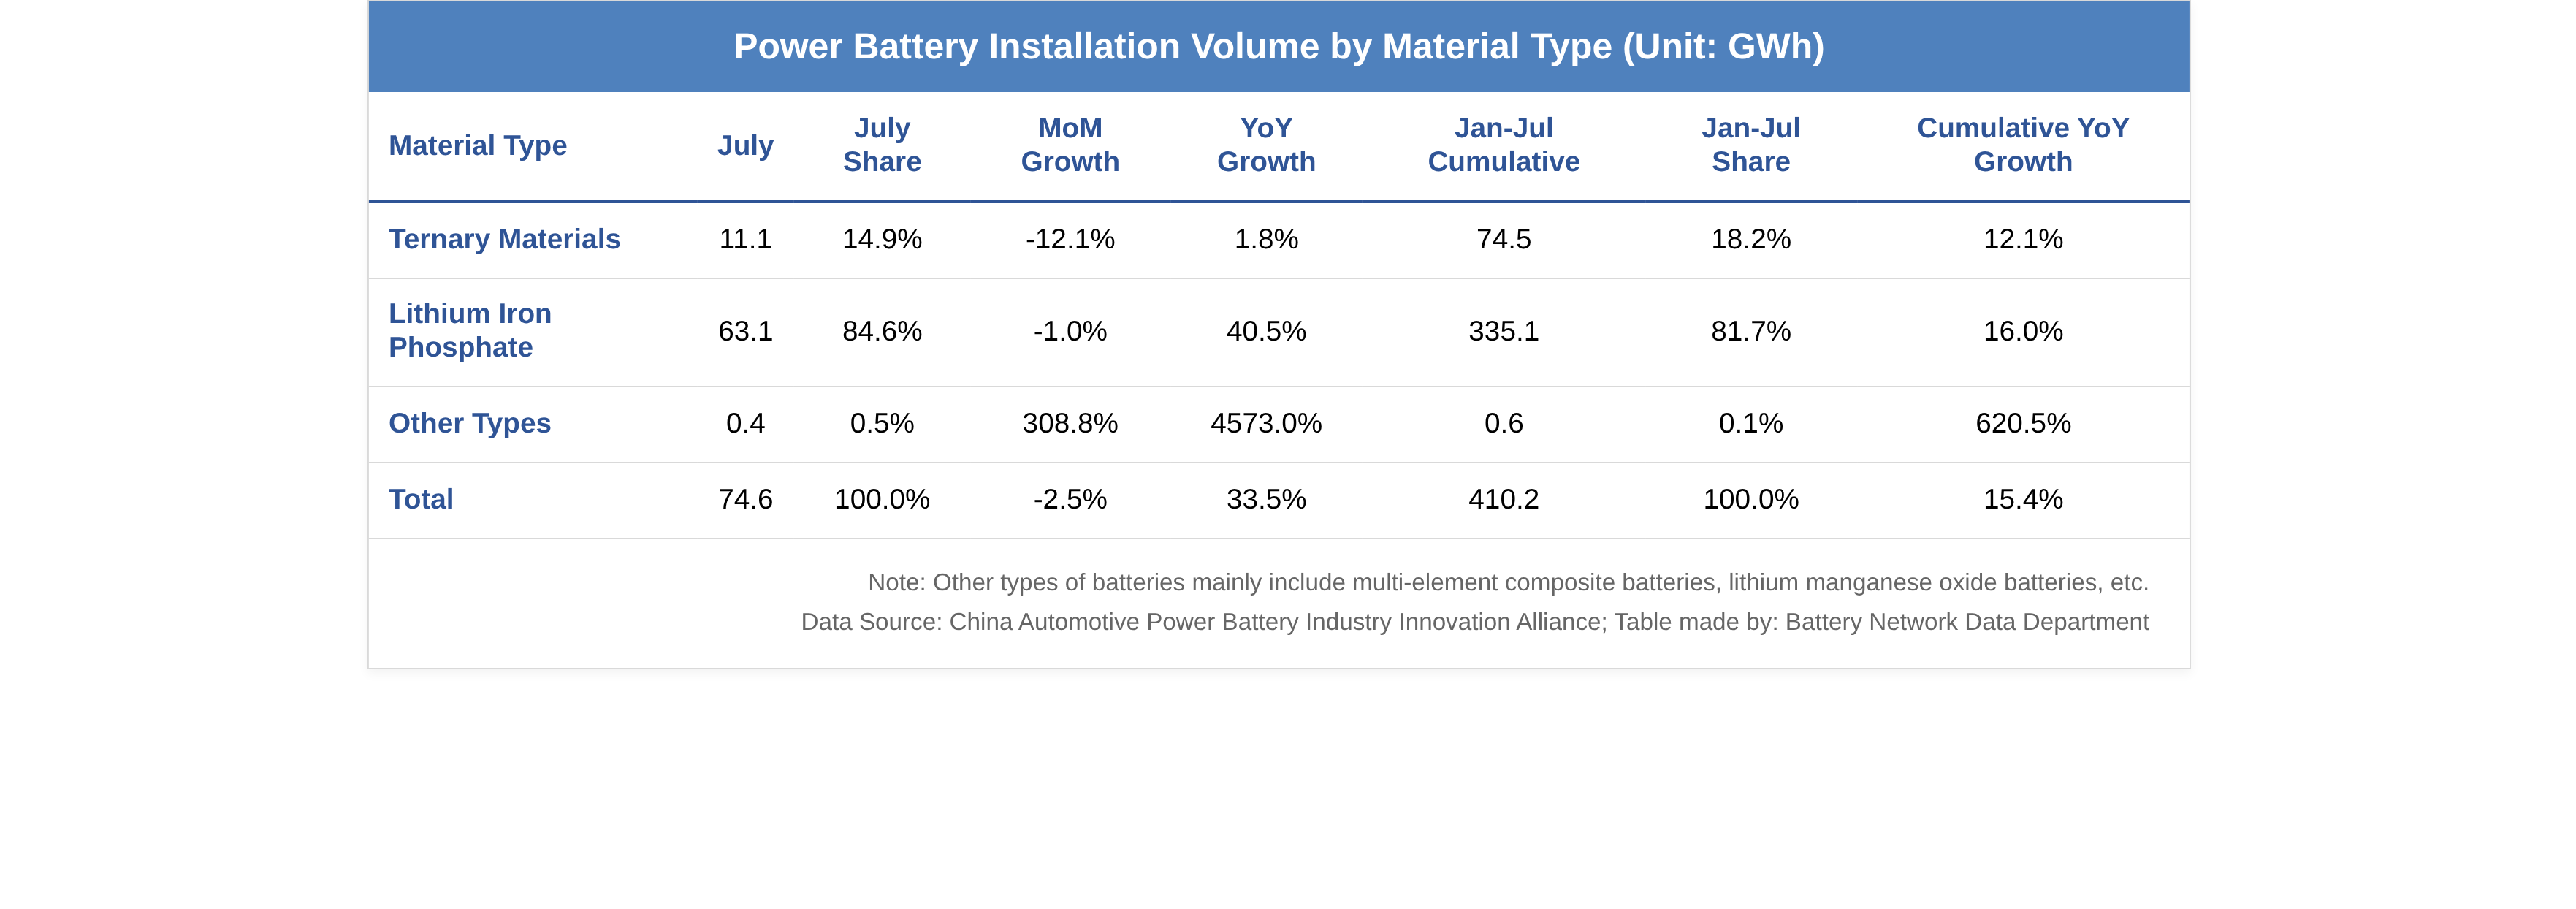
By material,in July, China’s ternary battery installations were 11.1 GWh, accounting for 14.9% of total installations, down 12.1% MoM and up 1.8% YoY; LFP battery installations were 63.1 GWh, accounting for 84.6% of total installations, down 1.0% MoM and up 40.5% YoY.
From January to July, China’s cumulative ternary battery installations were 74.5 GWh, accounting for 18.2% of total installations, up 12.1% YoY on a cumulative basis; cumulative LFP battery installations were 335.1 GWh, accounting for 81.7% of total installations, up 16.0% YoY on a cumulative basis.
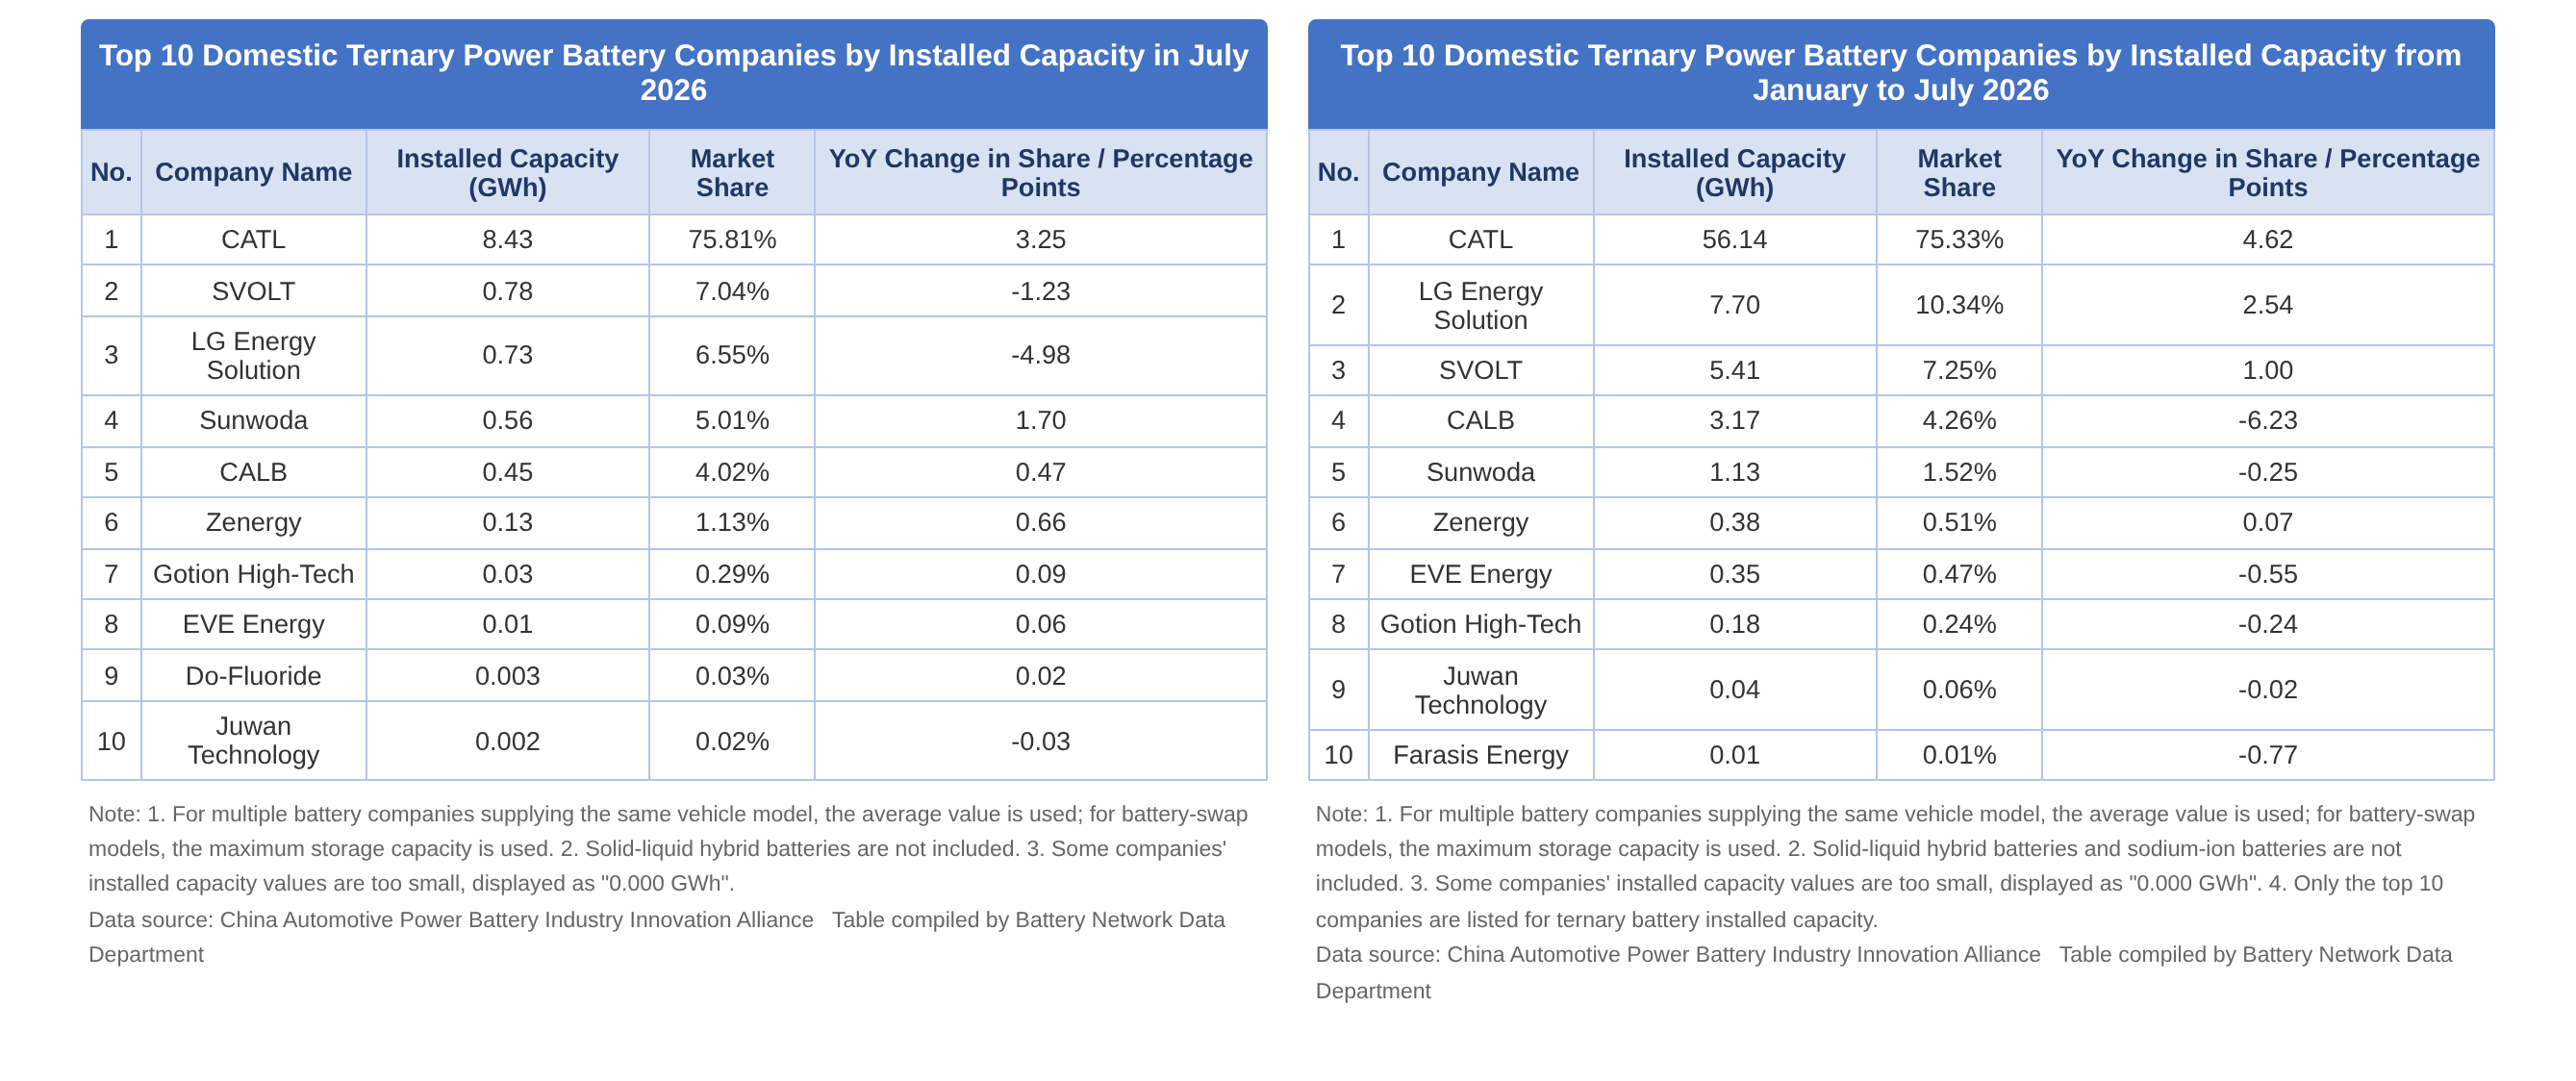
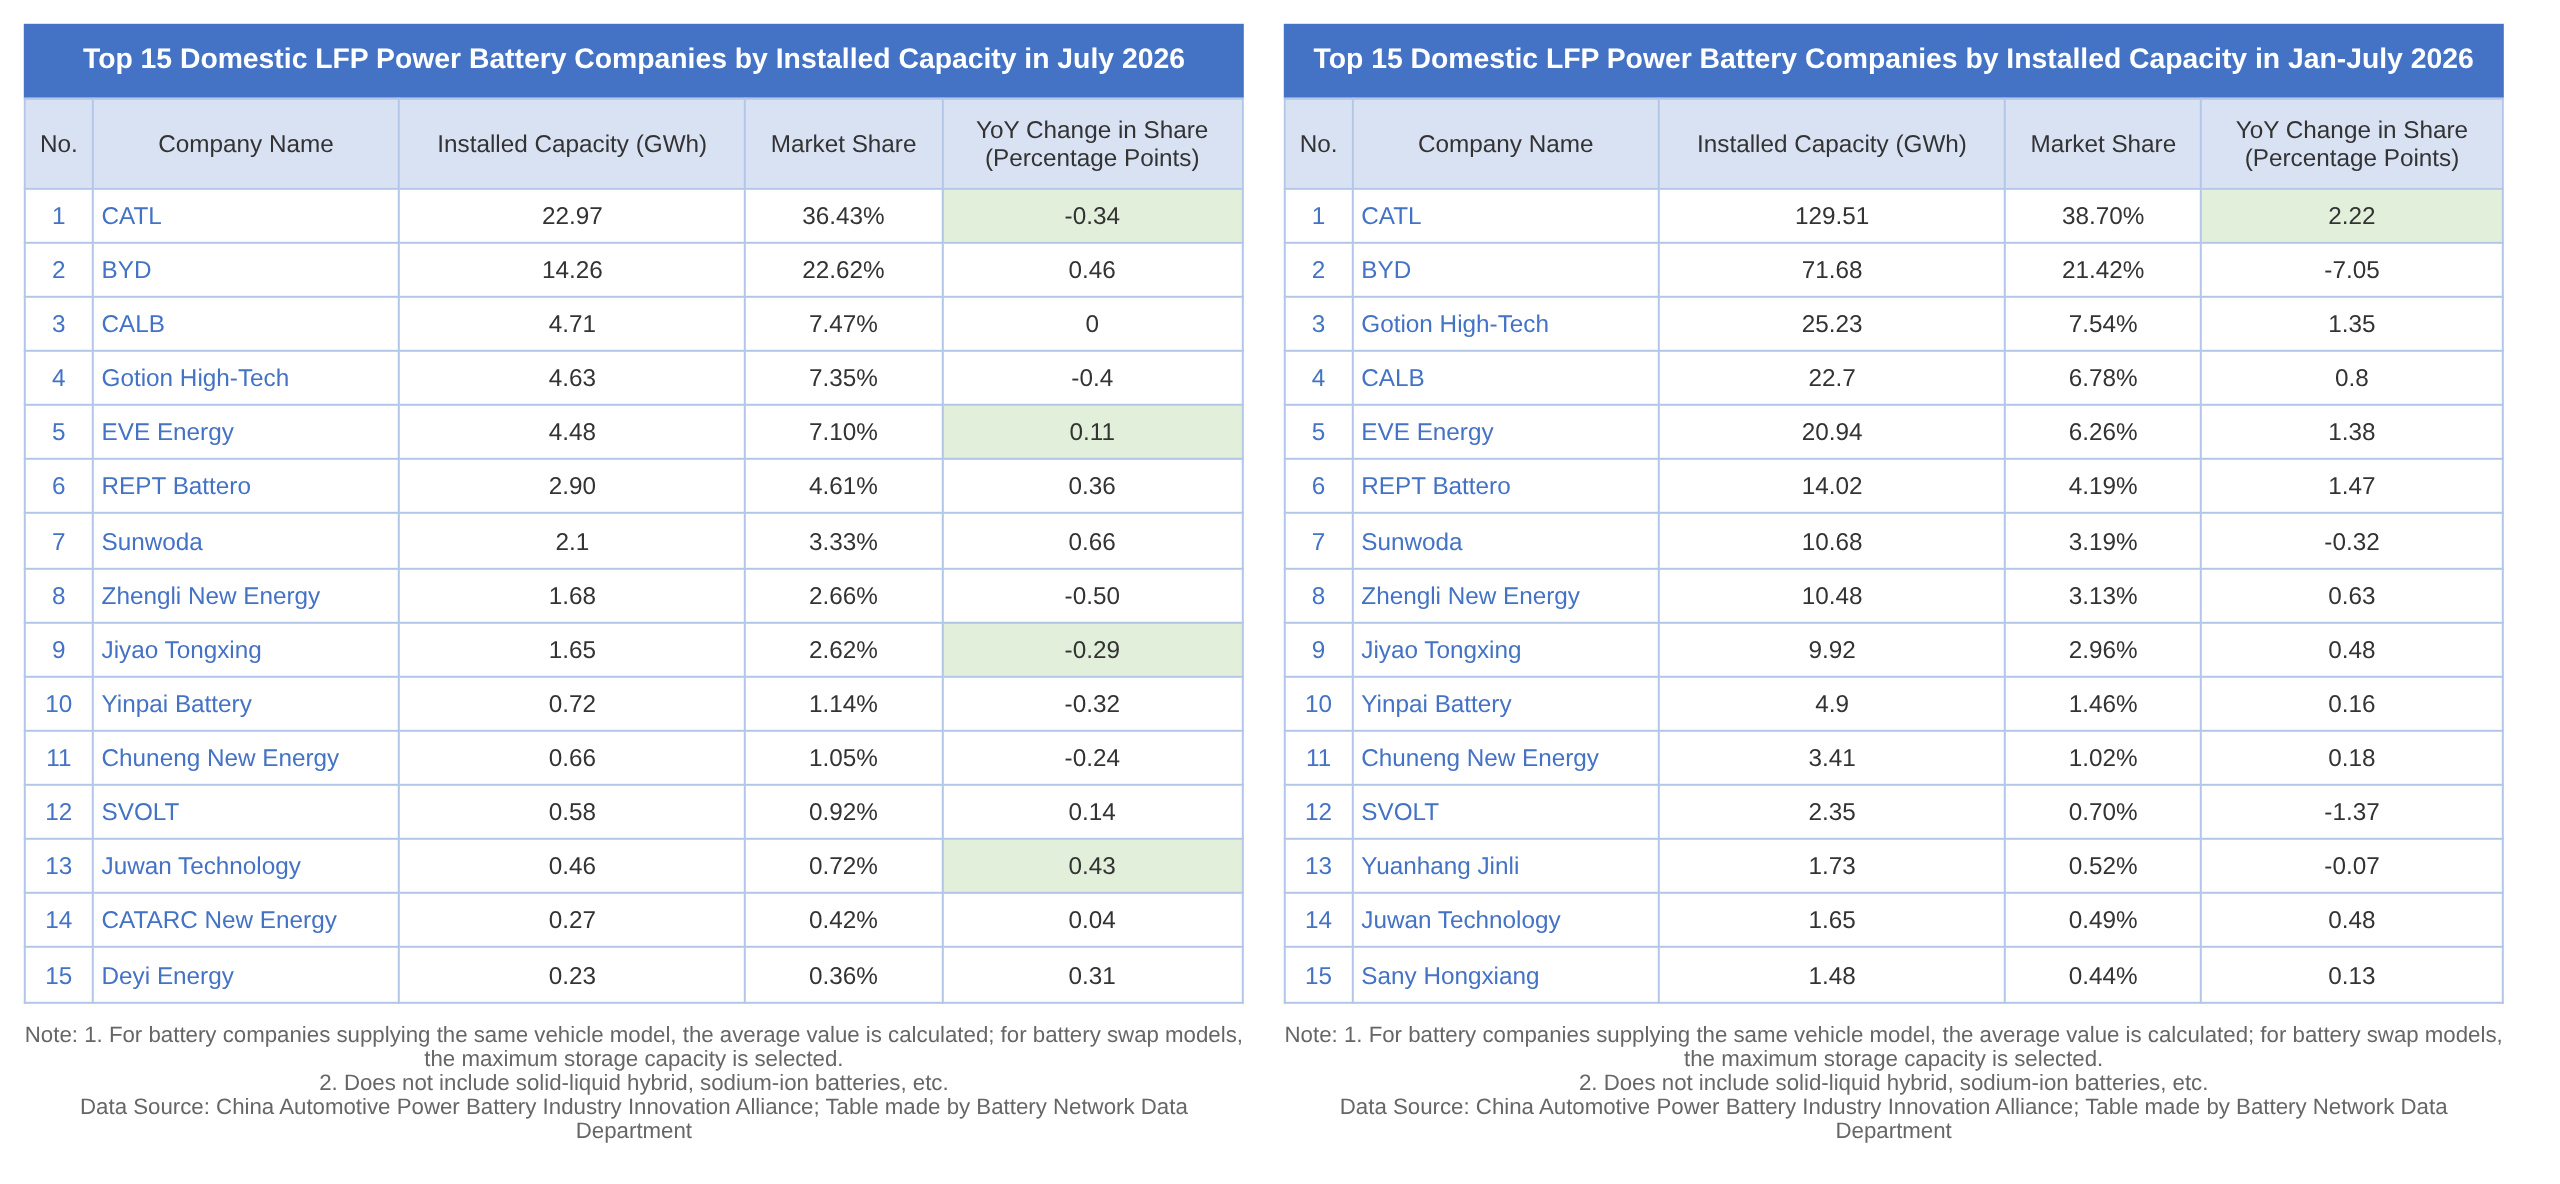
By company, CATL, Sunwoda, CALB, Zenergy, Gotion High-tech, and EVE appeared on both the “July/January–July Domestic TOP10 Ternary Power Battery Enterprise Installations” list and the “July/January–July Domestic TOP15 LFP Power Battery Enterprise Installations” list. Among them, SVOLT moved up by one place to rank second in the “July Domestic TOP10 Ternary Power Battery Enterprise Installations” ranking.
In addition,in terms of sales,in July, China’s EV and ESS battery sales were 185.2 GWh, down 5.5% MoM and up 45.5% YoY. From January to July, China’s cumulative EV and ESS battery sales were 1,164.6 GWh, up 48.1% YoY on a cumulative basis.
Of this total, in July, China’s power battery sales were 129.1 GWh, accounting for 69.7% of total sales, down 3.3% MoM and up 41.6% YoY; ESS battery sales were 56.1 GWh, accounting for 30.3% of total sales, down 10.3% MoM and up 55.4% YoY.
From January to July, China’s cumulative power battery sales were 790.4 GWh, accounting for 67.9% of total sales, up 37.1% YoY on a cumulative basis; cumulative ESS battery sales were 374.2 GWh, accounting for 32.1% of total sales, up 78.6% YoY on a cumulative basis.
In terms of exports,in July, China’s combined exports of EV and ESS batteries totaled 35.2 GWh, down 2.7% MoM and up 51.7% YoY, accounting for 19.0% of monthly sales. From January to July, China’s cumulative exports of EV and ESS batteries were 216.6 GWh, up 43.9% YoY on a cumulative basis, accounting for 18.6% of cumulative sales.
Of this total, in July, China’s power battery exports were 24.0 GWh, accounting for 68.0% of total exports, down 6.0% MoM and up 62.1% YoY; ESS battery exports were 11.3 GWh, accounting for 32.0% of total exports, up 4.9% MoM and up 33.4% YoY. From January to July, cumulative power battery exports were 146.7 GWh, accounting for 67.7% of total exports, up 52.1% YoY on a cumulative basis; cumulative ESS battery exports were 69.9 GWh, accounting for 32.3% of total exports, up 29.3% YoY on a cumulative basis.
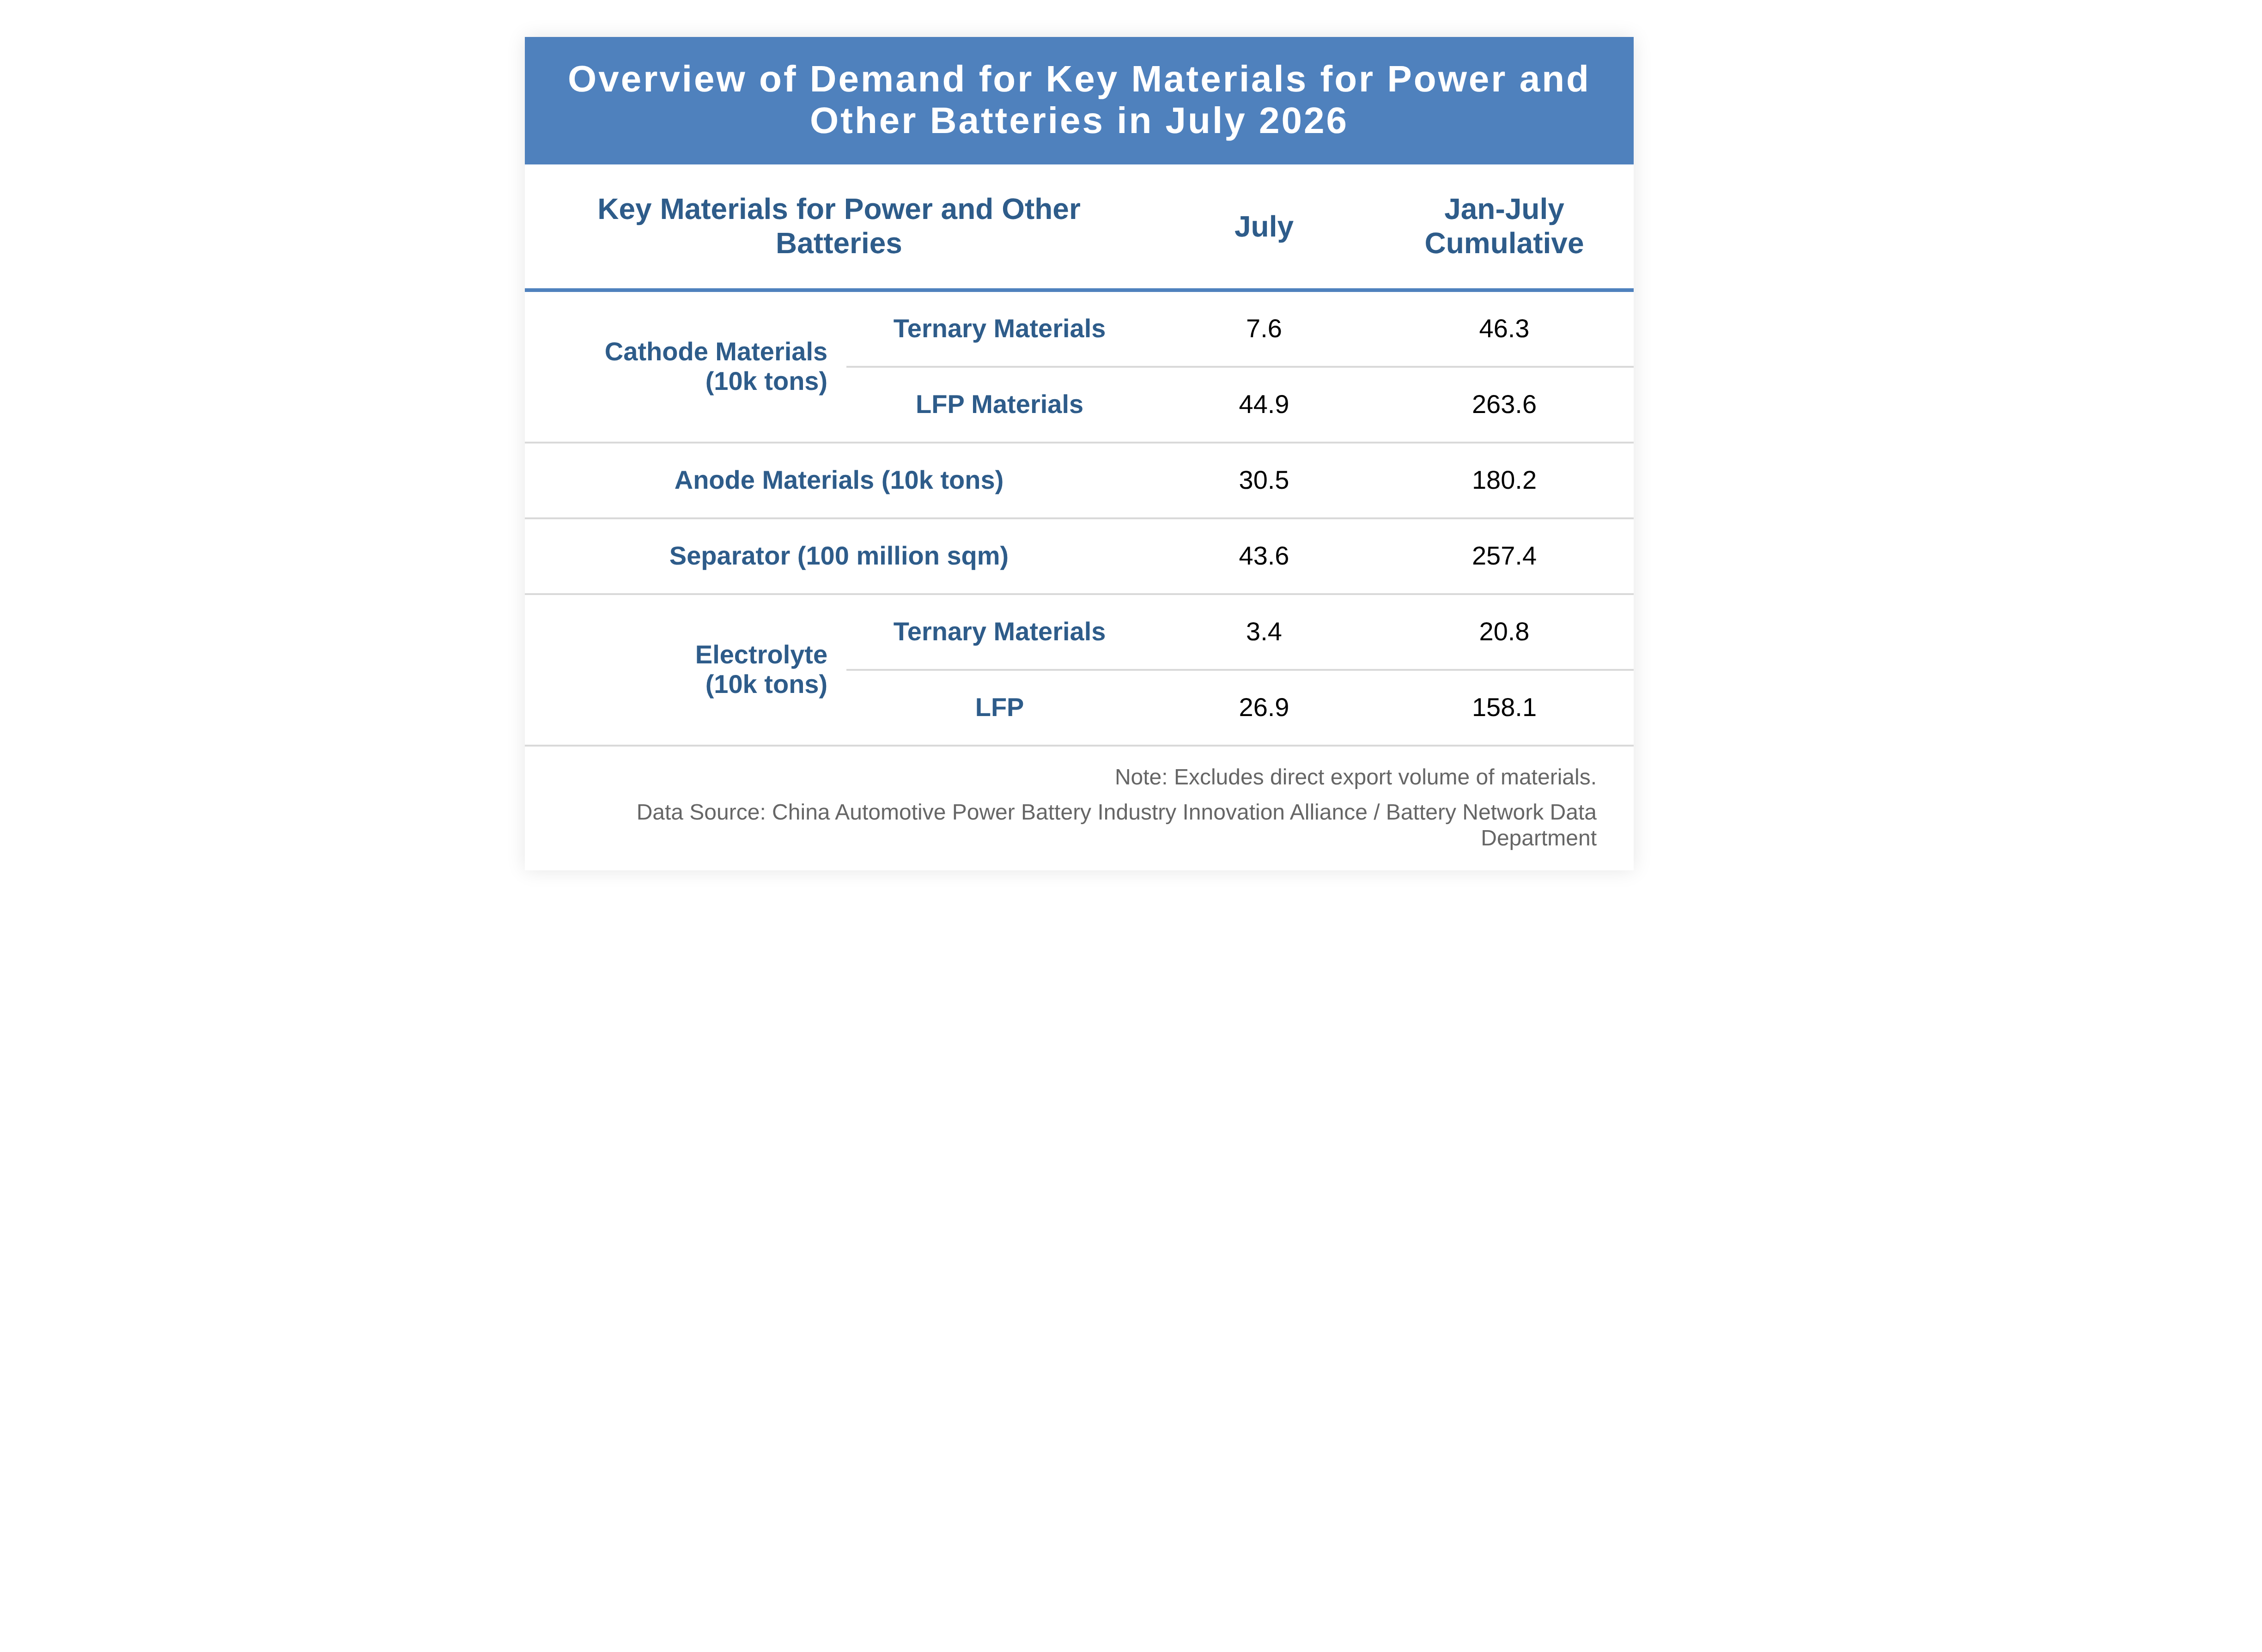
In addition,based on estimated demand data for key materials for EV and other batteries,in July, China used 76,000 mt of ternary cathode material and 449,000 mt of LFP material for EV and ESS batteries; 305,000 mt of anode material; 4.36 billion m² of separator; 34,000 mt of electrolyte for ternary batteries, and 269,000 mt of electrolyte for LFP batteries.
From January to July, China used 463,000 mt of ternary cathode material and 2.636 million mt of LFP material for EV and ESS batteries; 1.802 million mt of anode material; 25.74 billion m² of separator; 208,000 mt of electrolyte for ternary batteries, and 1.581 million mt of electrolyte for LFP batteries.
![[SMM Analysis] Lithium Is Carrying Zimbabwe's US$5.73B Mining Boom](https://imgqn.smm.cn/usercenter/KnMyT20251217171727.jpg)
![[SMM Analysis] Lithium's High-Price Window May Be Closing on African Producers as Market Tilts Toward 2027 Surplus](https://imgqn.smm.cn/usercenter/PPLUj20251217171727.jpg)
![[SMM Analysis] Kamativi Miner Flags Resource Constraints as Beneficiation Timeline Tightens](https://imgqn.smm.cn/usercenter/WgbTp20251217171727.jpg)