Data Notes
- Sulphur: HS codes 25030000 (sulphur of all kinds, excluding sublimed, precipitated and colloidal sulphur) + 28020000 (sublimed or precipitated sulphur)
- Sulphuric acid: HS code 28070010 (sulphuric acid with H₂SO₄ content >80% by weight)
- Total volumes: Sulphur imports in H1 2026 reached 1.8481 million tonnes (1,848,104,145 kg), down 29.4% from H1 2025 (2.6191 million tonnes). Sulphuric acid imports totaled 560,600 tonnes (560,640,243.7 kg).
- Values: Total sulphur import value was approximately USD 1.270 billion, with an average price of USD 687/tonne. Sulphuric acid imports totaled about USD 111 million, averaging USD 199/tonne.
1. Sulphur: Volumes Shrink by Nearly 30%; Prices Stable Early Then Surge
1.1 Monthly Import Volume and Price Trends

Trend commentary:
- Jan–Apr: Prices traded in a narrow range of USD 540–556/t, remaining broadly stable. January volume reached 0.3781 million tonnes (second-highest in H1), February fell 43.5% MoM to 0.2137 million tonnes due to the Lunar New Year holiday, March rebounded to 0.3744 million tonnes, and April eased to 0.2673 million tonnes. Global sulphur supply was ample during this period, and Indonesian buying remained steady.
- May–Jun: Prices turned sharply upward. May averaged USD 798/t, up 46.4% MoM; June surged further to USD 1,108/t, a gain of USD 563/t (+103%) from April's trough. This rally was driven by concentrated HPAL project restocking, recovering international phosphate fertiliser demand, and sharply reduced Middle Eastern supplies to Indonesia. June showed a "volume-price simultaneous rise" pattern (vol. +21.2%, price +38.8%), indicating buying appetite persisted despite high prices.
1.2 Major Source Countries: Saudi Arabia Leads, Canada Emerges Strong

Key observations:
- The six Middle Eastern countries (Saudi, UAE, Qatar, Kuwait, Bahrain, Oman) together supplied about 0.9824 million tonnes, accounting for 53.2% — still the largest regional block, but down sharply from 2.0999 million tonnes in H1 2025, a 53.2% decline.
- Canada saw its share jump from ~8.5% in H1 2025 (0.2219 million tonnes) to 17.7%, with volumes rising 47.6% year-on-year (from 0.2219 to 0.3275 million tonnes), becoming the second-largest source. Canadian high-purity solid sulphur performs well in nickel smelting applications.
- UAE, Qatar and Kuwait averaged only USD 541–557/t, significantly lower than Saudi (USD 754/t) and Canada (USD 773/t).
1.3 Major Destination Ports: Three Nickel Parks Absorb Over 80%

The three major nickel-industrial parks – WEDA, MOROWALI and OBI ISLAND – together imported 1.5333 million tonnes, accounting for 83.0% of Indonesia's total sulphur imports. These parks are the core hubs for downstream nickel processing (HPAL and RKEF with integrated sulphuric acid/fertiliser units), making sulphur import demand heavily concentrated in the nickel sector. WEDA alone accounts for 38.2% of national imports, the largest single destination. GRESIK (0.1518 million tonnes, 8.2%) mainly receives Qatari, Kuwaiti and Indian sulphur, serving industrial zones in eastern Java. Tanjung Priok, as Jakarta's main port, handles only 0.0624 million tonnes (3.4%), serving traditional chemical and fertiliser industries on Java.
1.4 Year-on-Year Decline Breakdown: Middle East Six Net Decrease of 1.1175 Million Tonnes
In H1 2025, the six Middle Eastern countries exported a total of 2.0999 million tonnes of sulphur to Indonesia, falling to 0.9824 million tonnes in H1 2026, a net decrease of 1.1175 million tonnes (-53.2%). Changes by country:

Note: Bahrain was the only Middle Eastern country to increase exports to Indonesia, though from a small base (0.02→0.0442 million tonnes), with limited impact on the overall picture.
Main reasons for the decline: ① International sulphur prices had been strengthening from late 2025 through June 2026, prompting Middle Eastern suppliers to divert cargoes to higher-paying markets like India, China and North Africa; ② Some newly built sulphur-burning acid plants in Indonesia came on stream, partially replacing imported sulphur. Increases from Canada (+0.1056 million tonnes) and the Philippines (+0.02 million tonnes) covered only about 11% of the shortfall.
2. Sulphuric Acid: Imports Rise Against the Trend; South Korea Becomes Largest Source
2.1 Monthly Import Volume and Price Trends

Trend commentary:
- January: Volume was 0.0270 million tonnes at USD 141/t, the low point for H1.
- Feb–Apr: Volumes climbed steadily to a half-year peak of 0.1735 million tonnes in April, while prices rose from USD 143 to 182/t. The commissioning of new HPAL projects unleashed rigid demand.
- May: Volumes plummeted 68% (to 0.0553 million tonnes), yet prices surged to USD 241/t as multiple Japanese and South Korean smelters entered annual maintenance, tightening acid export availability.
- June: Volumes rebounded to 0.1112 million tonnes and prices soared to USD 309/t, up 119% from January. This record high was driven by a confluence of cost-push from sulphur (averaging USD 1,108/t), persistent Japanese/Korean maintenance, and panic-buying by Indonesian smelters.
2.2 Major Source Countries: South Korea Ranks First, China and Japan Follow

The three East Asian suppliers (South Korea, China and Japan) together delivered 0.5239 million tonnes, or 93.4% of total sulphuric acid imports – concentration even higher than previously reported. South Korea ranked first with 0.2065 million tonnes (36.8%), up 0.025 million tonnes from previous data; China rose to second with 0.1821 million tonnes (32.5%), up 0.0274 million tonnes; Japan imported 0.1353 million tonnes (24.1%), down 0.0281 million tonnes. Acid's corrosive nature limits shipping distances (typically <3,000 nautical miles), so regional proximity gives Asian neighbours a dominant role. India's high average of USD 380/t reflects specialised high-purity or fuming acid grades in small volumes. Taiwan's low average of USD 134.0/t is a price trough, benefiting from its developed refinery by-product acid and short-haul freight advantages.
2.3 Major Destination Ports: OBI ISLAND Takes Half the Market

OBI ISLAND alone accounts for 50.0% (0.2802 million tonnes) of all acid imports, as it hosts multiple Chinese- and Korean-backed nickel-cobalt HPAL projects with enormous demand for finished acid. The top three ports (OBI+BAHUDOPI+WEDA) together represent 76.2%, up significantly from the previous 57.5%, indicating further concentration of acid imports to major ports – narrowing the gap with sulphur's 83.0% port concentration.
3. Joint Analysis of Sulphur and Sulphuric Acid: Volume-Price Co-movement and Structural Divergence
3.1 Overall Volume and Price Elasticity Comparison
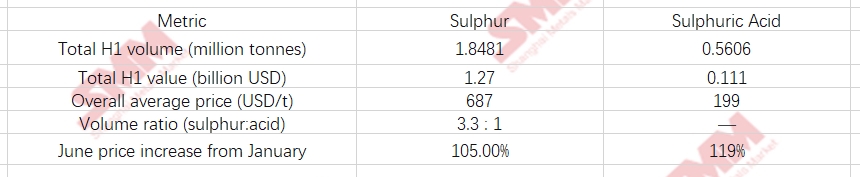
Price transmission and elasticity divergence:
- Sulphur jumped by USD 568/t from January (540) to June (1,108), a 105% gain, while acid rose 119% over the same period. Acid shows slightly higher price elasticity because its own supply-demand fundamentals are tighter (Korean/Japanese maintenance, rigid Indonesian demand) and its spot market is smaller, making it more vulnerable to marginal changes.
- The sulphur-to-acid volume ratio fell from 14:1 in January to a range of 2.0–3.6:1 from February to June, reflecting Indonesia's dynamic balancing act between importing sulphur for captive acid production and directly importing finished acid. When sulphur is expensive (e.g., USD 1,108/t in June), some smelters prefer to buy finished acid to avoid operating acid plants, supporting June's acid volume rebound.
3.2 Supply Pattern Comparison

Sulphur sources are more diversified (Middle East, North America, Southeast Asia), while acid supply is heavily concentrated in nearby East Asia – a consequence of their trade characteristics: sulphur can be shipped long-haul (Capesize/Panamax), whereas acid is constrained by corrosion and shipping costs, limiting its trade radius. Acid port concentration (76.2%) and sulphur port concentration (83.0%) have converged significantly – the gap narrowing from 25.5 percentage points to just 6.8 percentage points – indicating that the geographic concentration of demand for the two products is increasingly aligned.
3.3 Structural Changes from 2025 to 2026

Core conclusion: Indonesia's sulphur imports fell in volume but rose in value, with Middle Eastern suppliers retreating sharply and Canada filling the gap. Sulphuric acid imports increased in both volume and price, with direct acid imports becoming an important channel to compensate for domestic acid-making capacity, and its price gains substantially outpacing sulphur's.
3.4 Outlook for H2 2026
- Sulphur: The June price of USD 1,108/t is at a historical high, and expectations for H2 currently point to continued high-level volatility. Full-year imports are estimated at 3.6–3.8 million tonnes, down about 20% year-on-year.
- Sulphuric acid: After the maintenance season in Korea and Japan, supply may recover, but multiple HPAL projects on OBI Island and in WEDA are still ramping up. Monthly import volumes are expected to remain at 100,000–120,000 tonnes in H2, with prices oscillating at elevated levels of USD 260–330/t.
- Shifting supply patterns: Canada is on track to overtake Saudi Arabia as Indonesia's largest sulphur supplier by 2027. Chinese sulphuric acid exports to Indonesia also have room to grow, especially from integrated refining-petrochemical complexes on China's east and south coasts.
![[SMM Analysis] Quantity, Price, Source, Port of Destination: Analysis of Indonesian Sulfur and Sulphuric Acid Imports and Exports in H1 2026](https://imgqn.smm.cn/usercenter/qbMSp20251217171722.jpeg)
![[SMM Flash] Zimbabwean Spodumene Concentrate Prices Fall Across All Grades, Led by 5% Li₂O Down 1.99%](https://imgqn.smm.cn/usercenter/AmiJU20251217171730.jpg)