[SMM Analysis] Quantity, Price, Source, Port of Destination: Analysis of Indonesian Sulfur and Sulphuric Acid Imports and Exports in H1 2026

Published: Aug 12, 2026 09:44
H1 2026 sulfur imports fell by 771,000 mt YoY, a decline of nearly 30%. Combined imports from the four Middle Eastern countries (UAE, Qatar, Saudi Arabia, Kuwait) dropped by 1.52 million mt, a decrease of 62%. Canada emerged as a new major source, with imports rising from 172,000 mt to 328,000 mt (+90%), making it the second-largest origin. The average price in June surged to $885/mt, forming a pattern of “volume decline and price increase”.


Data Notes

  • Sulphur : HS codes 25030000 (various sulphur, excluding sublimed/precipitated/colloidal sulphur) + 28020000 (sublimed/precipitated/colloidal sulphur)

  • Sulphuric Acid : HS code 28070010 (sulphuric acid, H₂SO₄ content >80%)

  • Total Volume : H1 2026 sulphur 1.8481 million mt (1,848,104,145 kg), down 29.4% compared with H1 2025 (2.6191 million mt) ; sulphuric acid 560,600 mt (560,640,243.7 kg)

  • Value : total sulphur imports approx. $1.421 billion , overall average price $769/mt ; total sulphuric acid imports approx. $111.47 million , overall average price $199/mt

  • Price Treatment : monthly average prices exclude sample/non-commercial trade outliers of single batches <100 kg, retaining large-scale commercial batches

1. Sulphur: Volume contracted nearly 30%, prices followed an “N-shaped” trajectory before surging in June

1.1 Monthly import volume and price trends

Trend Interpretation :

  • January-February : market stable, average price held at $685-693/mt, imports pulled back 30% MoM in February due to Chinese New Year factors.

  • March-April : imports shot up then pulled back (reaching a H1 peak of 412,800 mt in March), yet prices fell for three consecutive months to $599/mt, a H1 low. The main reason was a temporary global sulphur supply surplus, with intense competition among Middle Eastern cargoes.

  • May-June : prices reversed sharply higher, with the June average spiking to $885/mt , an increase of $286/mt (+47.8%) from the April low. Concentrated stockpiling for HPAL projects at Indonesian nickel smelters, a recovery in international phosphate fertiliser demand, and suppliers holding prices firm jointly drove this rally. Notably, June imports did not rise alongside prices but rather fell 11.2% MoM, presenting a “volume down, price up” pattern, reflecting that high prices dampened purchase willingness.

1.2 Key source countries: Saudi Arabia led, Canada emerged
Key Observations :

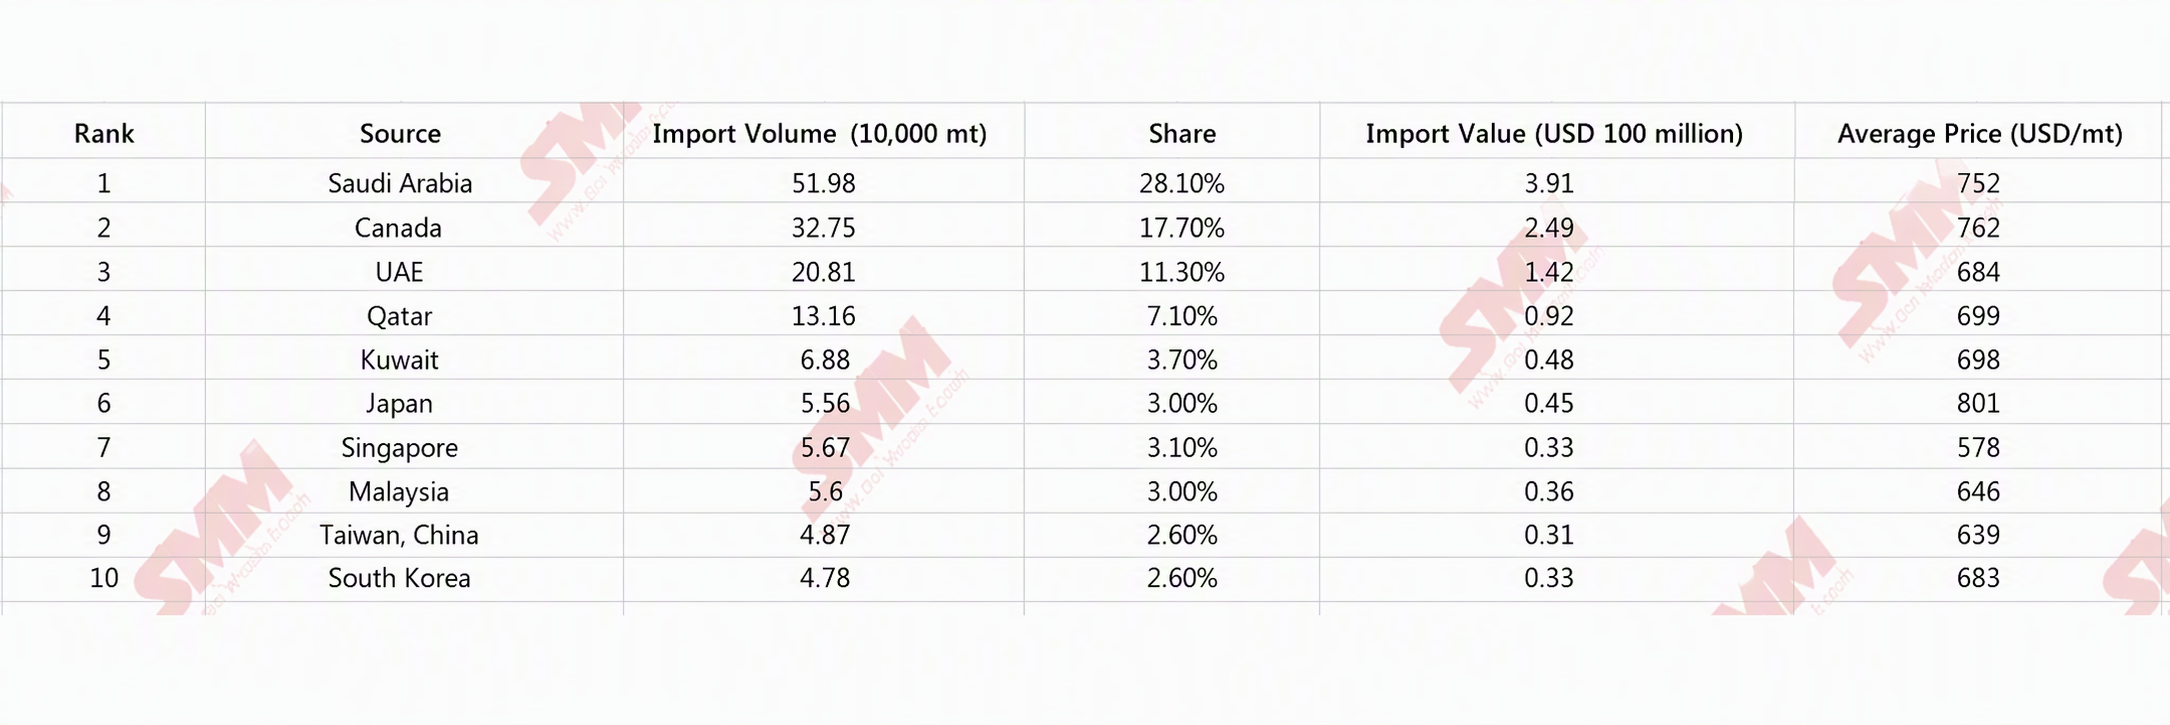
  • Five Middle Eastern countries (Saudi Arabia + UAE + Qatar + Kuwait + Bahrain + Oman) together supplied approx. 1.033 million mt, accounting for 55.9% , remaining the largest supply bloc, though down notably from around 62% in H1 2025.

  • Canada’s share jumped from about 6.6% in H1 2025 to 17.7%, with imports up 90.4% YoY (from 172,000 mt to 328,000 mt), making it the second-largest source. Canadian high-purity solid sulphur adapts well to nickel smelting applications, and its shipping routes from West Coast ports to Indonesia are more competitive than those from the Middle East (despite the greater distance, Panamax freight advantages emerged amid rate fluctuations).

  • Japan recorded the highest average price ($801/mt) , mainly because its exports are mostly high-grade liquid sulphur with significant loading and purity premiums; Singapore had the lowest average price ($578/mt) , as some volumes are re-export trade blended with low-grade or by-product sulphur.

1.3 Key destination ports: three major nickel parks absorbed over half

The three major nickel smelting parks—WEDA, MOROWALI, and OBI ISLAND—together imported 1.0289 million mt, accounting for 55.7% of Indonesia’s total sulphur imports. These three parks are the core hubs for downstream nickel ore processing (including HPAL and RKEF-linked sulphuric acid/fertiliser plants), and their sulphur import demand is entirely driven by the nickel industry. Tanjung Priok, the outer port of Jakarta, mainly serves traditional chemical and fertiliser industries on Java.

1.4 YoY volume decline breakdown: Middle East four countries cut 1.52 million mt

Main Reasons for the Decline : ① International sulphur prices strengthened continuously from end-2025 to June 2026, leading Middle Eastern suppliers to divert more cargoes to higher-price markets such as India, China and North Africa; ② Some newly built sulphur-based acid plants in Indonesia came onstream, partly displacing imported sulphur. Incremental volumes from Canada (+155,500 mt) and the Philippines (+20,000 mt) only offset about 12% of the reduction, far from enough to compensate.

2. Sulphuric Acid: Imports grew against the tide, price elasticity far exceeding that of sulphur

2.1 Monthly import volume and price trends

Trend Interpretation :

  • January : import volume very low (8,300 mt), due to mismatched contract execution around Chinese New Year and smelter maintenance.

  • February-April : imports climbed month by month, hitting a H1 peak of 179,500 mt in April, with the average price rising from $145/mt to $182/mt over the same period. Concentrated commissioning of downstream HPAL projects released rigid demand.

  • May : imports plunged 68% MoM (to 57,200 mt), but the average price jumped to $241/mt. The main reasons were annual maintenance at several smelters in Japan and South Korea, which tightened sulphuric acid export availability, shrinking supply and causing prices to leap.

  • June : imports rebounded to 115,100 mt, with the average price surging to $309/mt , up 119% from January. A triple combination of cost pass-through from the $885/mt sulphur price in June, ongoing maintenance in Japan and South Korea, and panic restocking by Indonesian local smelters drove this surge, recording the highest monthly average price for Indonesia’s sulphuric acid imports in recent years.

2.2 Key source countries: East Asia’s top three accounted for nearly 90%
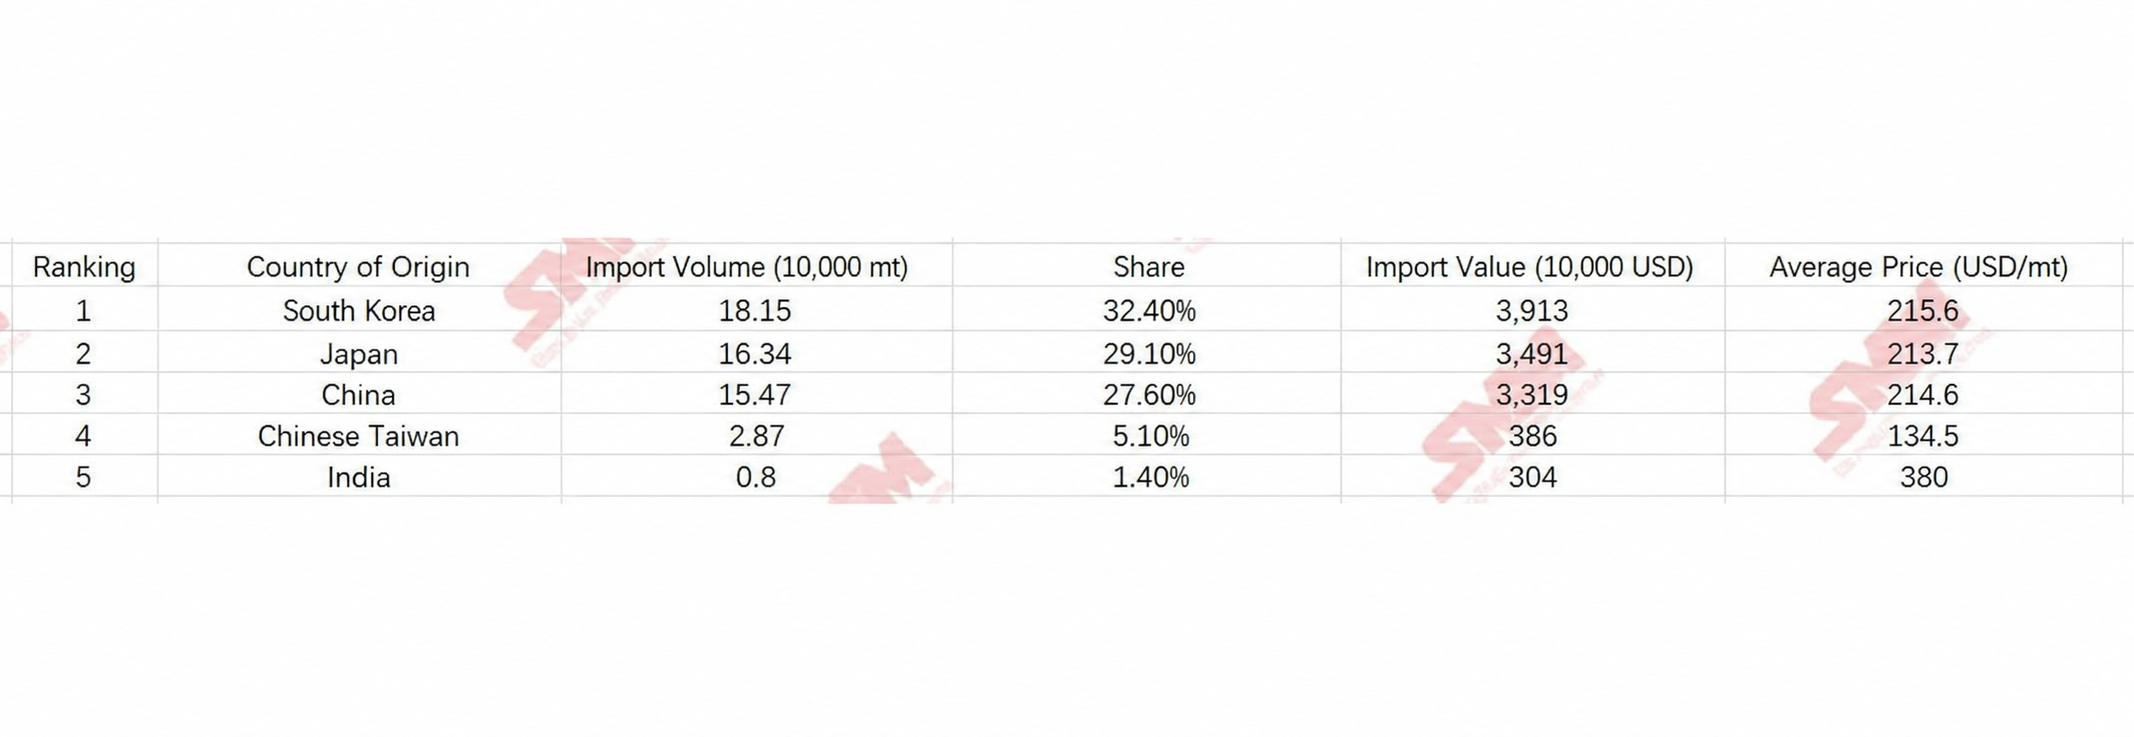
South Korea, Japan, and China together supplied 500,000 mt, making up 89.1% of national sulphuric acid imports. Sulphuric acid is highly corrosive with a limited shipping radius (usually no more than 3,000 nautical miles), so regional proximity gives East Asian countries their dominant position. India’s average price reached as high as $380/mt, attributable to special high-purity/oleum specifications—small volume with a high price. Taiwan’s average price was only $134.5/mt, a price lowland, benefiting mainly from its developed refinery by-product acid and short-sea freight cost advantages.

2.3 Key destination ports: OBI ISLAND took one-third
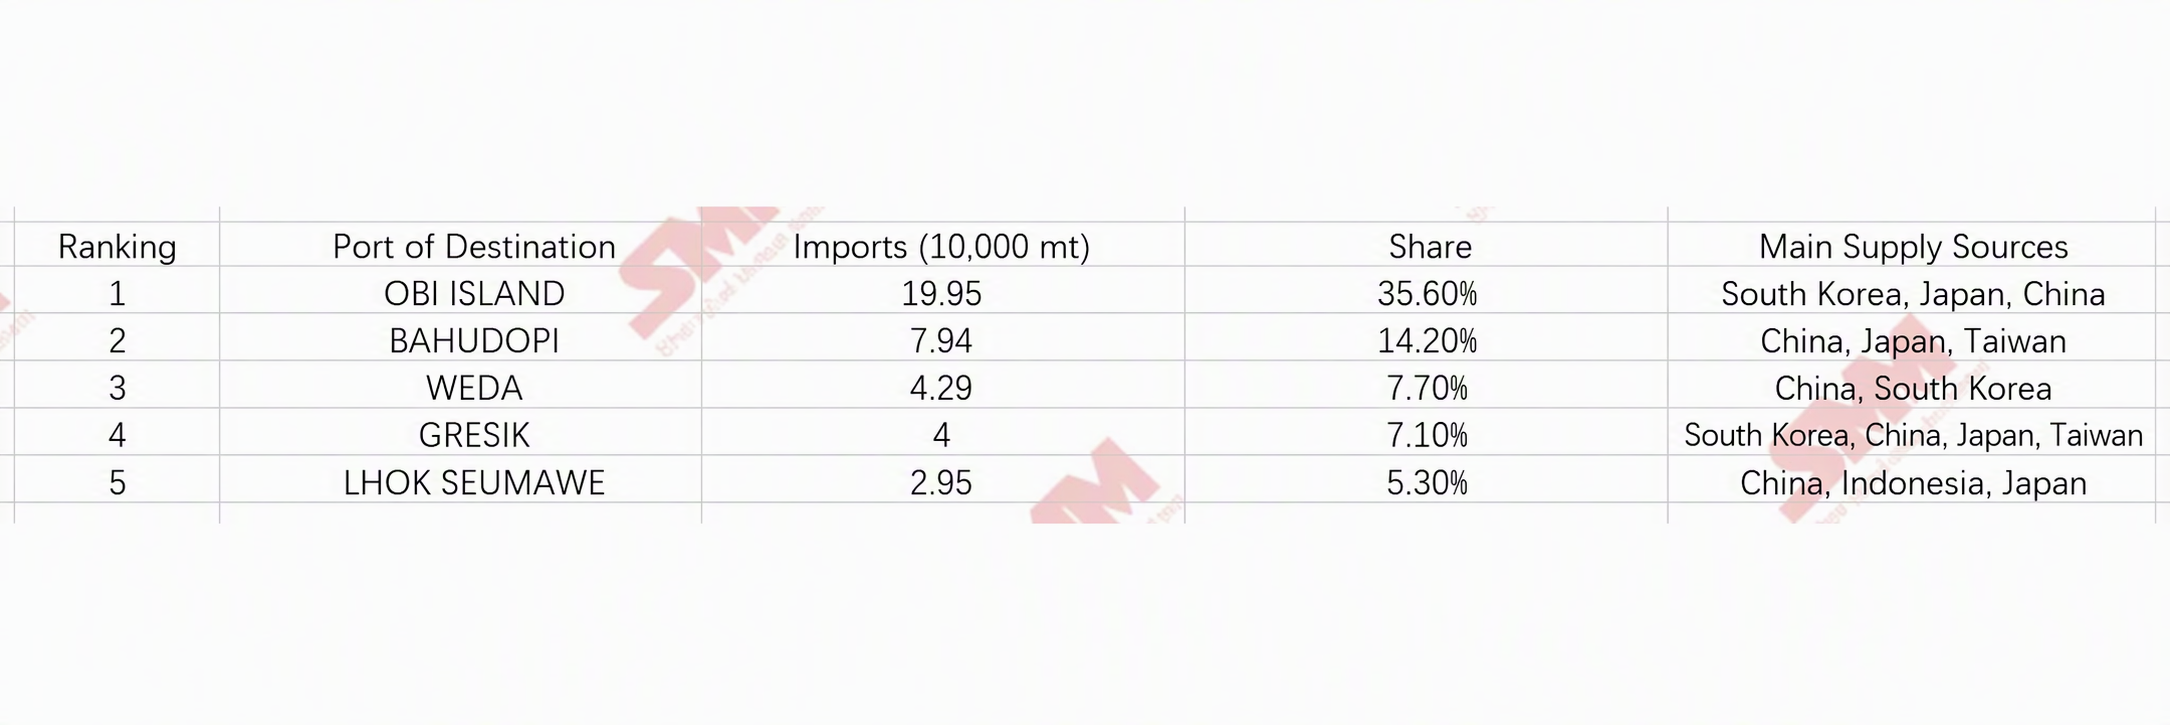
OBI ISLAND alone accounted for 35.6% ; this island hosts multiple nickel-cobalt hydrometallurgy (HPAL) projects led by Chinese and South Korean capital and has enormous demand for finished sulphuric acid. The top three ports (OBI + BAHUDOPI + WEDA) together represented 57.5% , closely matching the concentration of the top three sulphur ports (55.7%), once again confirming the heavy overlap in demand between the two commodities.

3. Combined Sulphur and Sulphuric Acid Analysis: Volume-price linkages and landscape differentiation

3.1 Volume and price elasticity comparison

Price Transmission and Elasticity Differential :

  • The June average sulphuric acid price ($309/mt) rose $168/mt from January ($141/mt), a gain of 119% ; over the same period, sulphur prices rose only 29.2%. Sulphuric acid’s price elasticity far exceeded that of sulphur because its own supply-demand fundamentals are tighter (maintenance in Japan and South Korea, rigid demand in Indonesia) and the spot market is small, making it highly susceptible to marginal supply-demand changes.

  • The sulphur-to-sulphuric acid import volume ratio shifted from 35:1 in January (as acid imports were extremely low) to 2.0–4.2:1 from February to June, reflecting Indonesia’s dynamic balance between “importing sulphur for self-production of acid” and “directly importing finished acid”. When sulphur prices are elevated (e.g., $885/mt in June), some smelters prefer to directly purchase finished acid to avoid operating costs of acid plants, supporting the June rebound in acid imports.

3.2 Supply landscape comparison

Sulphur sources have become more diversified (large shares from the Middle East, North America, and Southeast Asia), while sulphuric acid supply is highly concentrated among near-neighbour East Asian countries. This is determined by the global trade characteristics of the two commodities: sulphur can be shipped over long distances by sea (Capesize/Panamax vessels), whereas sulphuric acid is constrained by corrosiveness and transportation costs, resulting in a shorter trading radius.

3.3 2025→2026 structural change summary

Core Conclusion : Indonesia’s sulphur imports experienced “volume down, price up”, with Middle Eastern supply sharply retreating and Canada rapidly filling the gap; sulphuric acid imports saw “volume and price both up”, with direct imports of finished acid becoming an important way to compensate for acid production shortfalls, and their price increase significantly outpacing that of sulphur.

3.4 H2 outlook

  1. Sulphur : The June price of $885/mt is already curbing procurement; prices are expected to remain consolidating at highs in H2, with geopolitical conflict developments to monitor. Indonesia’s full-year imports are projected at 3.6–3.8 million mt, down about 20% YoY.

  2. Sulphuric Acid : Supply may recover after the maintenance season at Japanese and South Korean smelters, but multiple HPAL projects in the OBI Island and WEDA areas are still in the capacity ramp-up phase; H2 monthly average imports are likely to hold at 100,000–120,000 mt, with the average price likely consolidating at highs in the $260–330/mt range.

  3. Landscape Evolution : Canada’s sulphur exports to Indonesia are expected to surpass Saudi Arabia as the top supplier by 2027; there is still room for growth in Chinese sulphuric acid exports to Indonesia, especially by-product acid from integrated refinery-chemical enterprises along the east and south coasts of China.

Data Sources : Indonesia Customs import and export statistics under HS codes 25030000, 28020000, 28070010 for January-June 2025 and January-June 2026, verified item-by-item, month-by-month, and by country/port. Total volume data has been cross-checked with users; monthly data are commercial batch aggregates based on original detailed records (calibrated proportionally after excluding <100 kg samples), and values and average prices correspond to actual commercial imports.

Data Source Statement: Except for publicly available information, all other data are processed by SMM based on publicly available information, market communication, and relying on SMM's internal database model. They are for reference only and do not constitute decision-making recommendations.

Images in this article contain AI-translated captions for reference only.

For any inquiries or for more information, please contact: lemonzhao@smm.cn
For more information on how to access our research reports, please contact:service.en@smm.cn
Related News
[SMM Flash] Zimbabwean Spodumene Concentrate Prices Fall Across All Grades, Led by 5% Li₂O Down 1.99%
13 hours ago
[SMM Flash] Zimbabwean Spodumene Concentrate Prices Fall Across All Grades, Led by 5% Li₂O Down 1.99%
Read More
[SMM Flash] Zimbabwean Spodumene Concentrate Prices Fall Across All Grades, Led by 5% Li₂O Down 1.99%
[SMM Flash] Zimbabwean Spodumene Concentrate Prices Fall Across All Grades, Led by 5% Li₂O Down 1.99%
Zimbabwean spodumene concentrate prices, CIF Chinese main ports, declined across all three tracked grades on August 7, with the lower-grade material posting the steepest percentage drop. The 6% Li₂O grade (SMM-Li-SC-005) settled at $2,010/tonne, down $25 (-1.23%), trading in a $1,970-$2,050 range. The 5.5% Li₂O grade (SMM-Li-SC-006) closed at $1,885/tonne, down $30 (-1.57%), within a $1,860-$1,910 band. The 5% Li₂O grade (SMM-Li-SC-007) fell hardest, settling at $1,725/tonne, down $35 (-1.99%), with the widest daily range of the three at $1,660-$1,790. The pullback widened the grade differential at the lower end of the curve: the 6%-5.5% spread stood at $125/tonne, while the 5.5%-5% spread widened to $160/tonne, up from typical spread levels, pointing to comparatively softer demand for lower-grade Zimbabwean material relative to higher-Li₂O concentrate on the day. SMM View: The broad-based decline across all three Zimbabwean spodumene grades tracks the wider softness in China's lithium chemical complex, with lower-grade material bearing the brunt of the pullback as buyers favour higher-grade feedstock amid cautious purchasing. SMM will continue to monitor whether the widening 5.5%-5% spread persists into the next pricing session or reflects a single-day liquidity effect.
13 hours ago
[SMM Analysis] Corica Mali Wins $348M Open-Pit Mining Contract at Ganfeng's Goulamina Lithium Project
14 hours ago
[SMM Analysis] Corica Mali Wins $348M Open-Pit Mining Contract at Ganfeng's Goulamina Lithium Project
Read More
[SMM Analysis] Corica Mali Wins $348M Open-Pit Mining Contract at Ganfeng's Goulamina Lithium Project
[SMM Analysis] Corica Mali Wins $348M Open-Pit Mining Contract at Ganfeng's Goulamina Lithium Project
Corica Mali, a subsidiary of Corica Mining Services, has been awarded the open-pit mining services contract at the Goulamina spodumene project in Mali, valued at approximately $348 million. The contract follows a competitive tender process and covers six months of pre-production activity followed by a fixed five-year term. Corica has already mobilised to site under an early works arrangement and is currently carrying out pre-strip and direct shipped ore (DSO) mining and crushing. Scope covers grade control, drill and blast, load and haul, and plant ore-feed services, with a planned material movement target of 18-20 Mt/y over the contract term. This figure refers to total mined material (ore plus waste), distinct from finished spodumene concentrate output Goulamina's Stage 1 definitive feasibility study outlines nameplate production of roughly 506,000 tonnes per annum of 6% Li₂O spodumene concentrate (SC6), with test work validating high-quality, low mica concentrate. On logistics, Goulamina is landlocked, located roughly 50 km west of Bougouni in southern Mali, and spodumene concentrate produced at site is trucked overland to coastal ports for onward shipment to end markets, predominantly Chinese converters. Industry practice for landlocked West African spodumene projects is to sell concentrate on an FOB basis at the export port, with the buyer arranging and bearing ocean freight from that point; Mali-origin concentrate has historically moved primarily via Abidjan, with San Pedro and Dakar available as secondary corridors. Specific Incoterms and export routing for Goulamina's commercial shipments were not disclosed in the contract announcement and should be confirmed against offtake documentation rather than assumed. Goulamina holds all key approvals and permits required for production. Ownership has changed since the original mining contract announcement: Ganfeng Lithium, previously a 50% joint-venture partner, acquired the remaining 40% interest from Leo Lithium in a transaction completed through 2024-2025, and now holds the project alongside the Government of Mali's equity interest under the country's revised mining code terms of the state's current stake should be verified against the latest Malian government disclosure rather than the original 10% free-carry figure cited at contract signing. First commercial shipment from Goulamina occurred in August 2025, superseding the original H1 2024 production target referenced when this contract was first announced. Corica has operated in the West African mining services sector for over 20 years and reports more than 2,000 employees, according to company-supplied figures; these have not been independently verified by SMM. SMM View: The Corica contract underlines the scale of open-pit mining services demand accompanying Mali's ramp-up as a spodumene supply source, with an 18-20 Mt/y material movement target supporting Goulamina's roughly 506,000 tpa SC6 nameplate capacity. With Ganfeng now holding full private ownership following its 2024-2025 buyout of Leo Lithium's stake, offtake and logistics decisions at Goulamina sit entirely with Ganfeng and the Malian state, reinforcing China's direct control over a growing share of West African spodumene supply reaching Chinese conversion capacity. SMM will monitor further disclosure on Goulamina's export routing and contractual Incoterms as shipment volumes scale.
14 hours ago
[SMM Analysis] Zimbabwe Lithium Producers Commit $1.45B to Local Processing, Seek Export Ban Flexibility"
14 hours ago
[SMM Analysis] Zimbabwe Lithium Producers Commit $1.45B to Local Processing, Seek Export Ban Flexibility"
Read More
[SMM Analysis] Zimbabwe Lithium Producers Commit $1.45B to Local Processing, Seek Export Ban Flexibility"
[SMM Analysis] Zimbabwe Lithium Producers Commit $1.45B to Local Processing, Seek Export Ban Flexibility"
Zimbabwe's lithium producers have collectively committed approximately US$1.45 billion to local beneficiation infrastructure, according to Lithium Producers Association Chairman Innocent Rukweza, who also heads Mutapa Energy Resources. Speaking at the Mine Entra Beneficiation and Value Addition Symposium in Bulawayo, Rukweza said the industry has sought government flexibility on the pending export restriction on unbeneficiated spodumene concentrate, citing limited sulphate-plant readiness across the sector. SMM notes the ban's effective date and any adjustment to it should be confirmed against the latest government notice rather than symposium commentary, and that the US$1.45 billion figure is association-reported and has not been independently verified. Of seven major producers, only the Huayou-linked plant at Prospect Lithium Zimbabwe's Arcadia site has completed and commissioned sulphate conversion capacity to date. The US$400 million facility exported Africa's first locally produced lithium sulphate in April 2026 and is now operating. Sinomine's US$500 million sulphate plant at Bikita remains under construction, Kamativi Mining Company's US$200 million-plus sulphate project is at investment stage with commissioning status unconfirmed, and a fourth, unnamed facility is targeted for end-2027. The gap between committed capital and commissioned output is the operative supply constraint behind the industry's request for timeline flexibility: the remaining producers are still moving concentrate rather than sulphate and would be directly exposed if the unbeneficiated export restriction takes effect before their plants come online. Logistics add a further layer of risk to that timeline. Spodumene concentrate is currently exported CIF China, routed predominantly via Beira in Mozambique and Durban in South Africa, and sulphate output from commissioned and future plants will likely need to move through the same corridors absent dedicated arrangements. ZETDC grid instability continues to affect processing-plant uptime, bearing directly on how quickly the remaining sulphate facilities can ramp to nameplate capacity once commissioned, while congestion at the Machipanda border post and along the Beitbridge Durban and Maputo rail corridors affects turnaround times independent of on-site production readiness. Even where sulphate capacity comes online on schedule, these constraints will shape whether the sector can convert commissioned capacity into consistent export volumes ahead of any tightened concentrate-export policy. On the fiscal side, the industry's effective tax burden is estimated at around 40% of sales revenue, comprising a 10% export tax on unbeneficiated lithium, 7% royalties, a 3% community development levy, a 1% MMCZ marketing fee and 15.5% VAT, before corporate income tax, payroll and foreign currency retention requirements are added. The association has called for a review, noting Zimbabwe's rate sits above global peers. Beyond lithium, the association has pointed to unrecovered value in tantalum, niobium and caesium from lithium operations, and government has since introduced mandatory mineral declaration and on-site assay laboratory requirements at producing mines. Specific loss and investment figures cited for this by-product stream were not independently attributed at the symposium and are not carried here pending primary sourcing. SMM View: Zimbabwe's beneficiation drive is currently a one-plant story, with Arcadia commissioned and exporting sulphate while Bikita, Kamativi and the fourth facility remain at construction or investment stage. The binding constraints on closing that gap are not purely financial grid reliability and corridor congestion at Machipanda and along the Beitbridge–Durban and Maputo routes will shape how quickly commissioned capacity converts into consistent export volumes. The roughly 40% effective tax burden remains a separate and likely more durable point of friction with Harare. SMM will confirm the committed investment figure and current export-policy status once further primary disclosures are available.
14 hours ago
Register to Continue Reading
Gain access to the latest insights in metals and new energy
Already have an account?Sign in here
[SMM Analysis] Quantity, Price, Source, Port of Destination: Analysis of Indonesian Sulfur and Sulphuric Acid Imports and Exports in H1 2026 - Shanghai Metals Market (SMM)