According to data from the National Bureau of Statistics (NBS),
China's PMI for July 2026
I. China's Manufacturing PMI
In July, the Manufacturing PMI was 49.2%, down 1.1 percentage points MoM, with the level of prosperity pulling back.
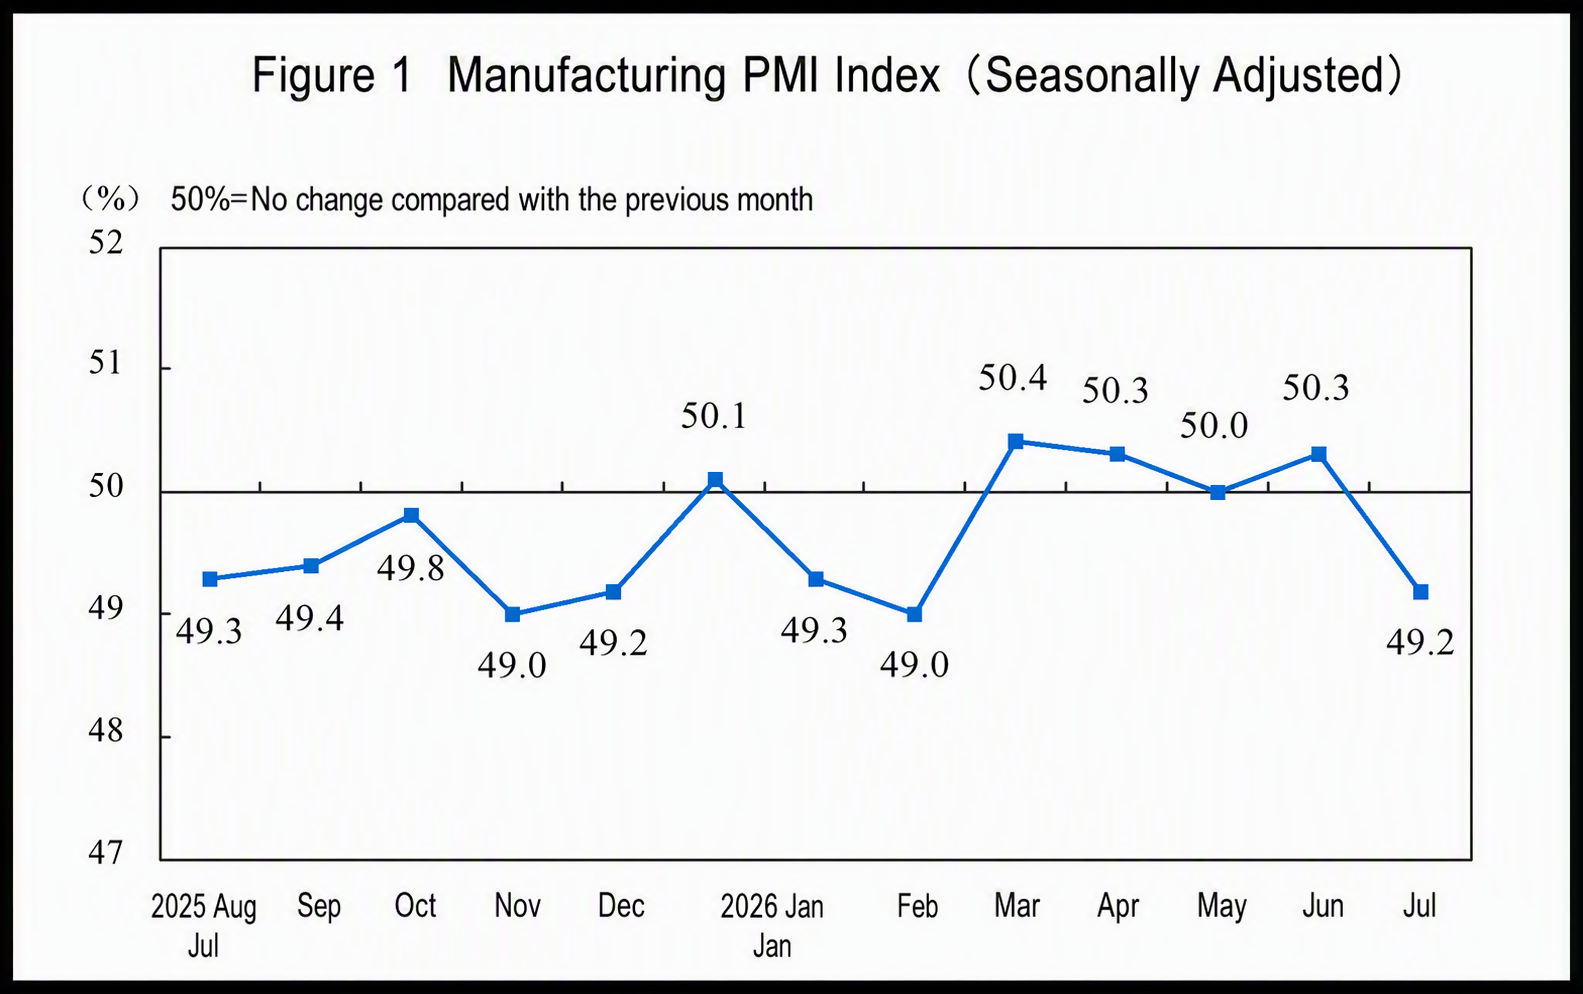
By enterprise size, the PMIs for large, medium, and small enterprises were 49.5%, 49.7%, and 47.4%, respectively, down 1.2, 0.8, and 0.8 percentage points MoM, all below the threshold.
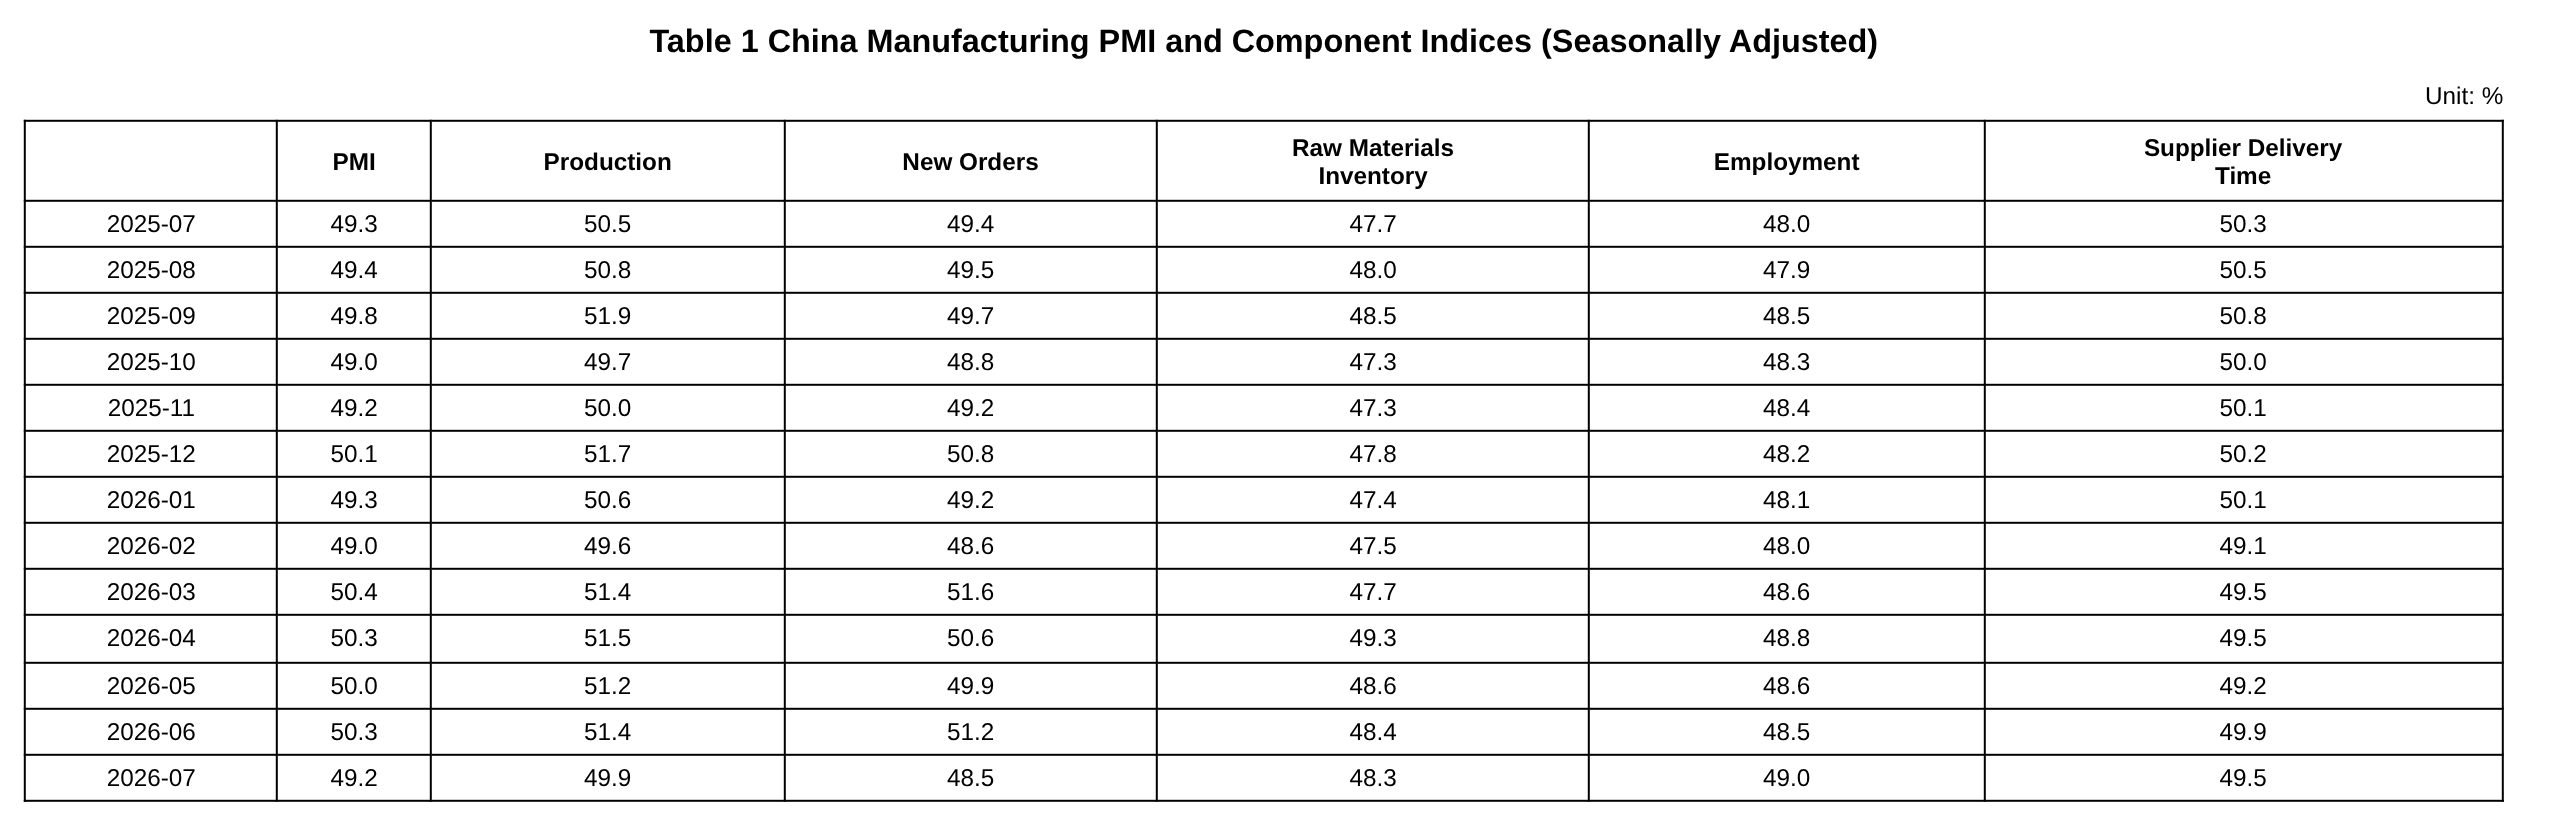
Examining the sub-indices that constitute the Manufacturing PMI, all five—the Production Index, New Orders Index, Raw Material Inventory Index, Employment Index, and Supplier Delivery Time Index—were below the threshold.
The Production Index was 49.9%, down 1.5 percentage points MoM, indicating a slowdown in manufacturing production activity.
The New Orders Index was 48.5%, down 2.7 percentage points MoM, indicating a pullback in manufacturing market demand.
The Raw Material Inventory Index was 48.3%, down 0.1 percentage points MoM, indicating that the inventory of major raw materials in manufacturing continued to decrease.
The Employment Index was 49.0%, up 0.5 percentage points MoM, indicating a slight rebound in the employment climate of manufacturing enterprises.
The Supplier Delivery Time Index was 49.5%, down 0.4 percentage points MoM, indicating that the delivery times for raw material suppliers to manufacturers lengthened compared to the previous month.
II. China's Non-Manufacturing PMI
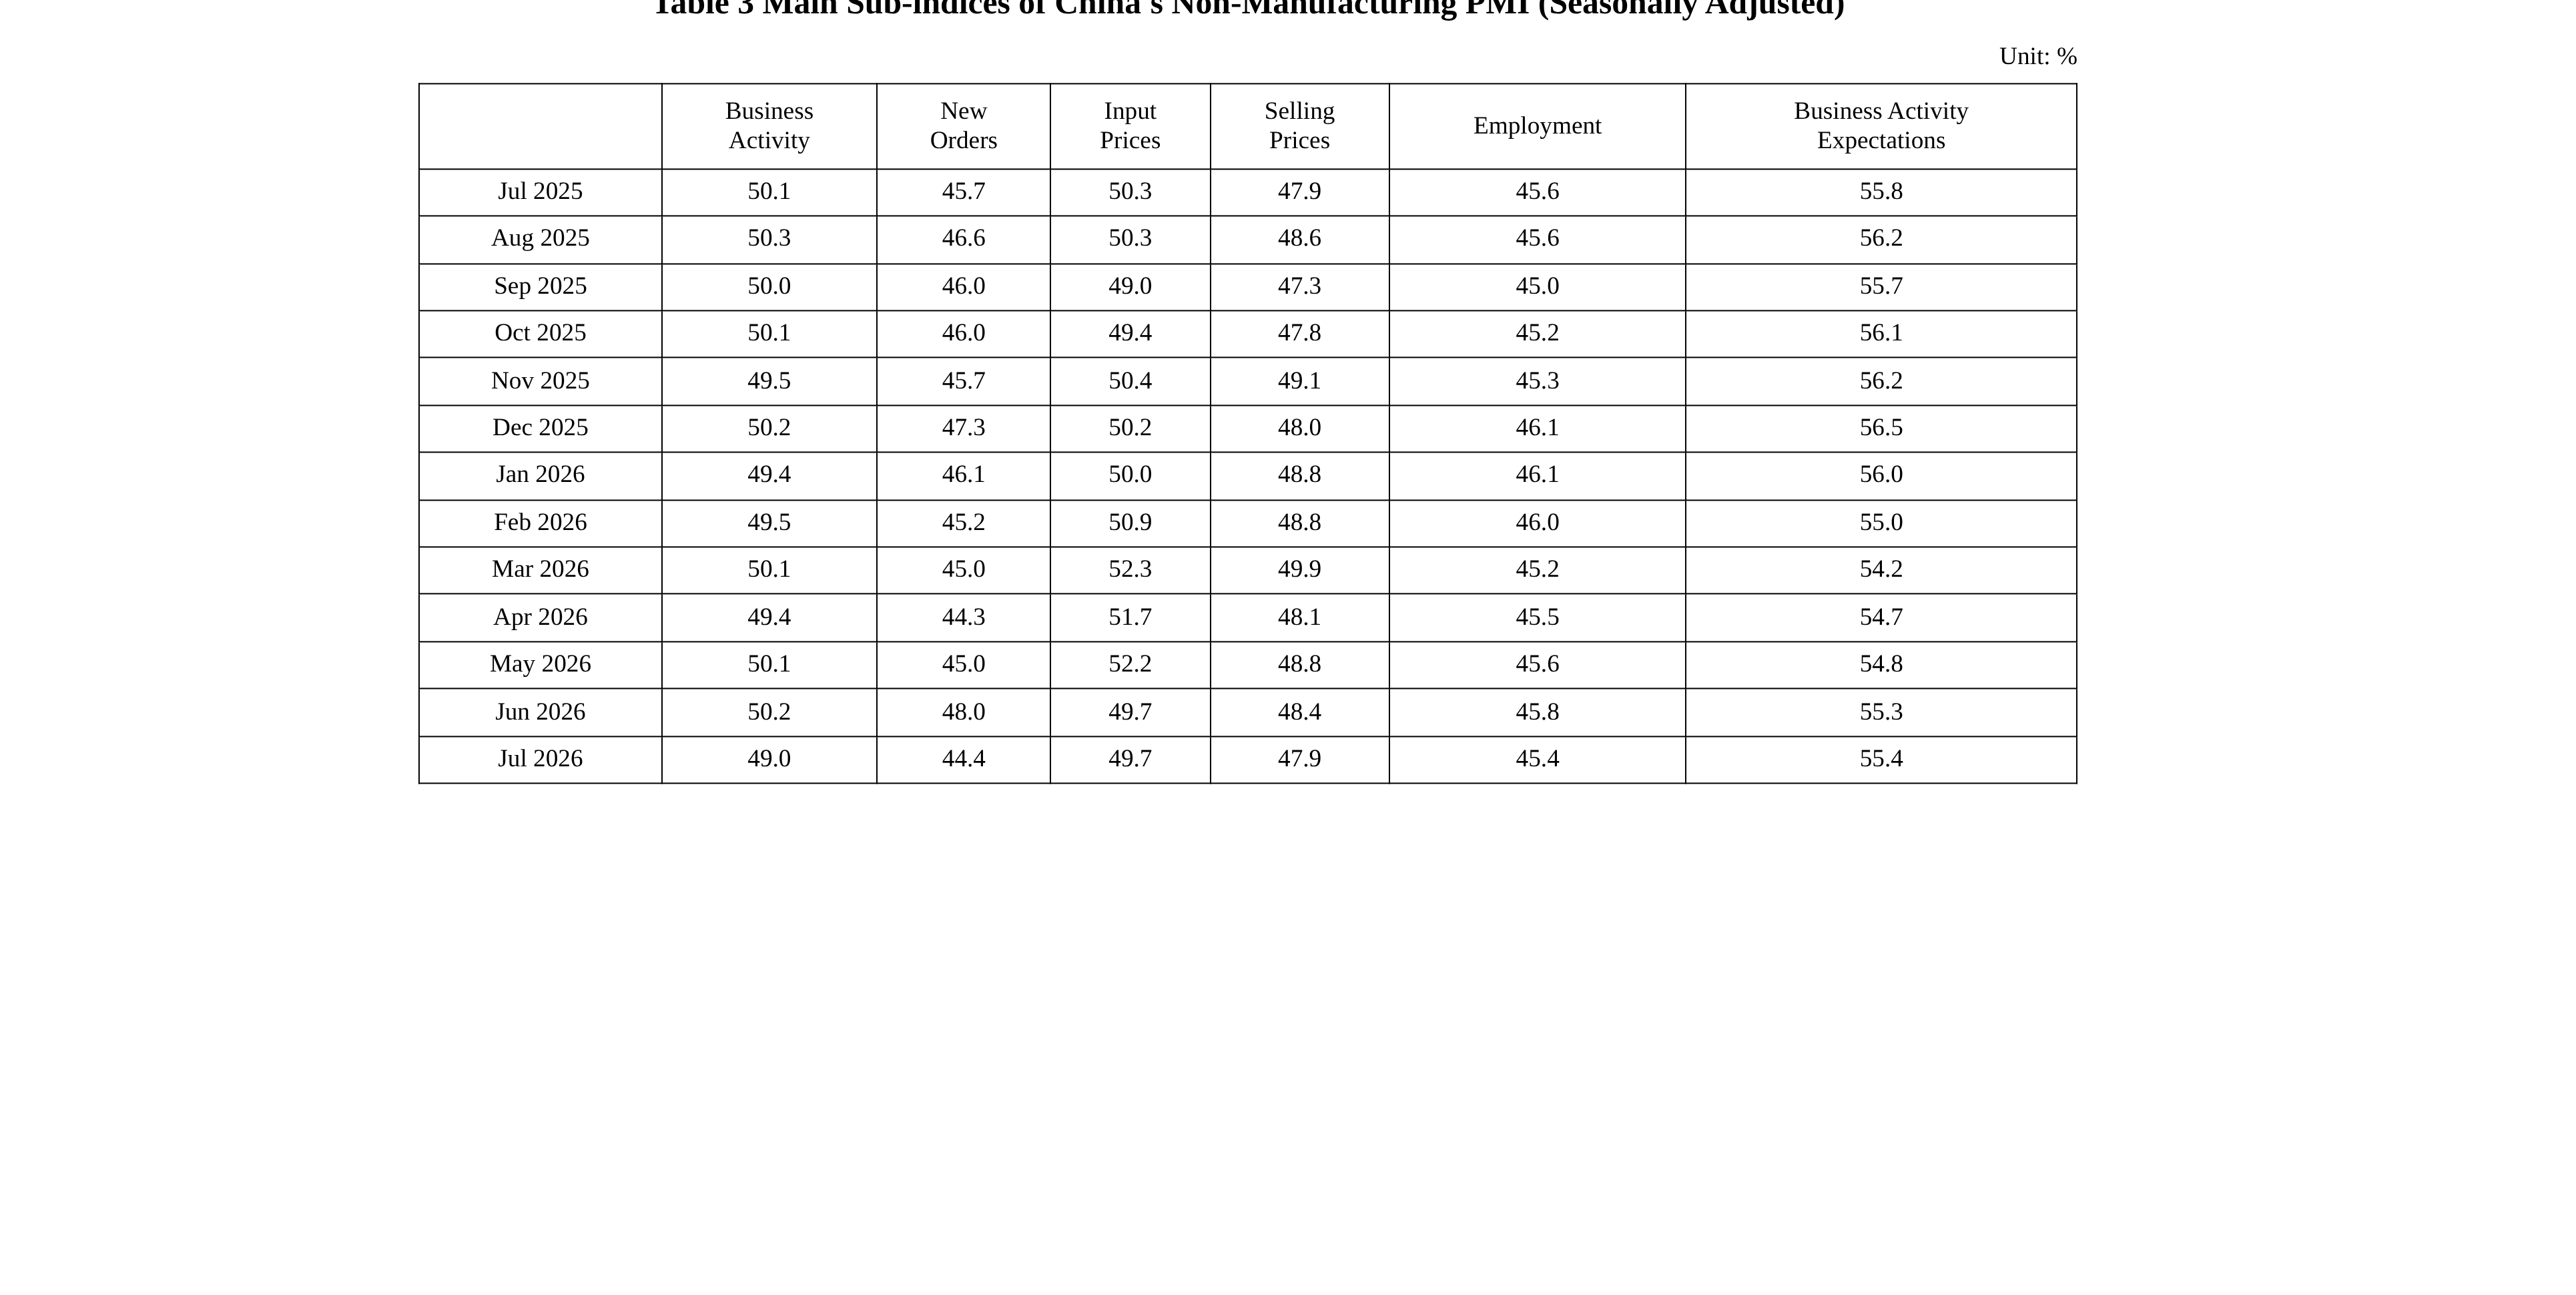
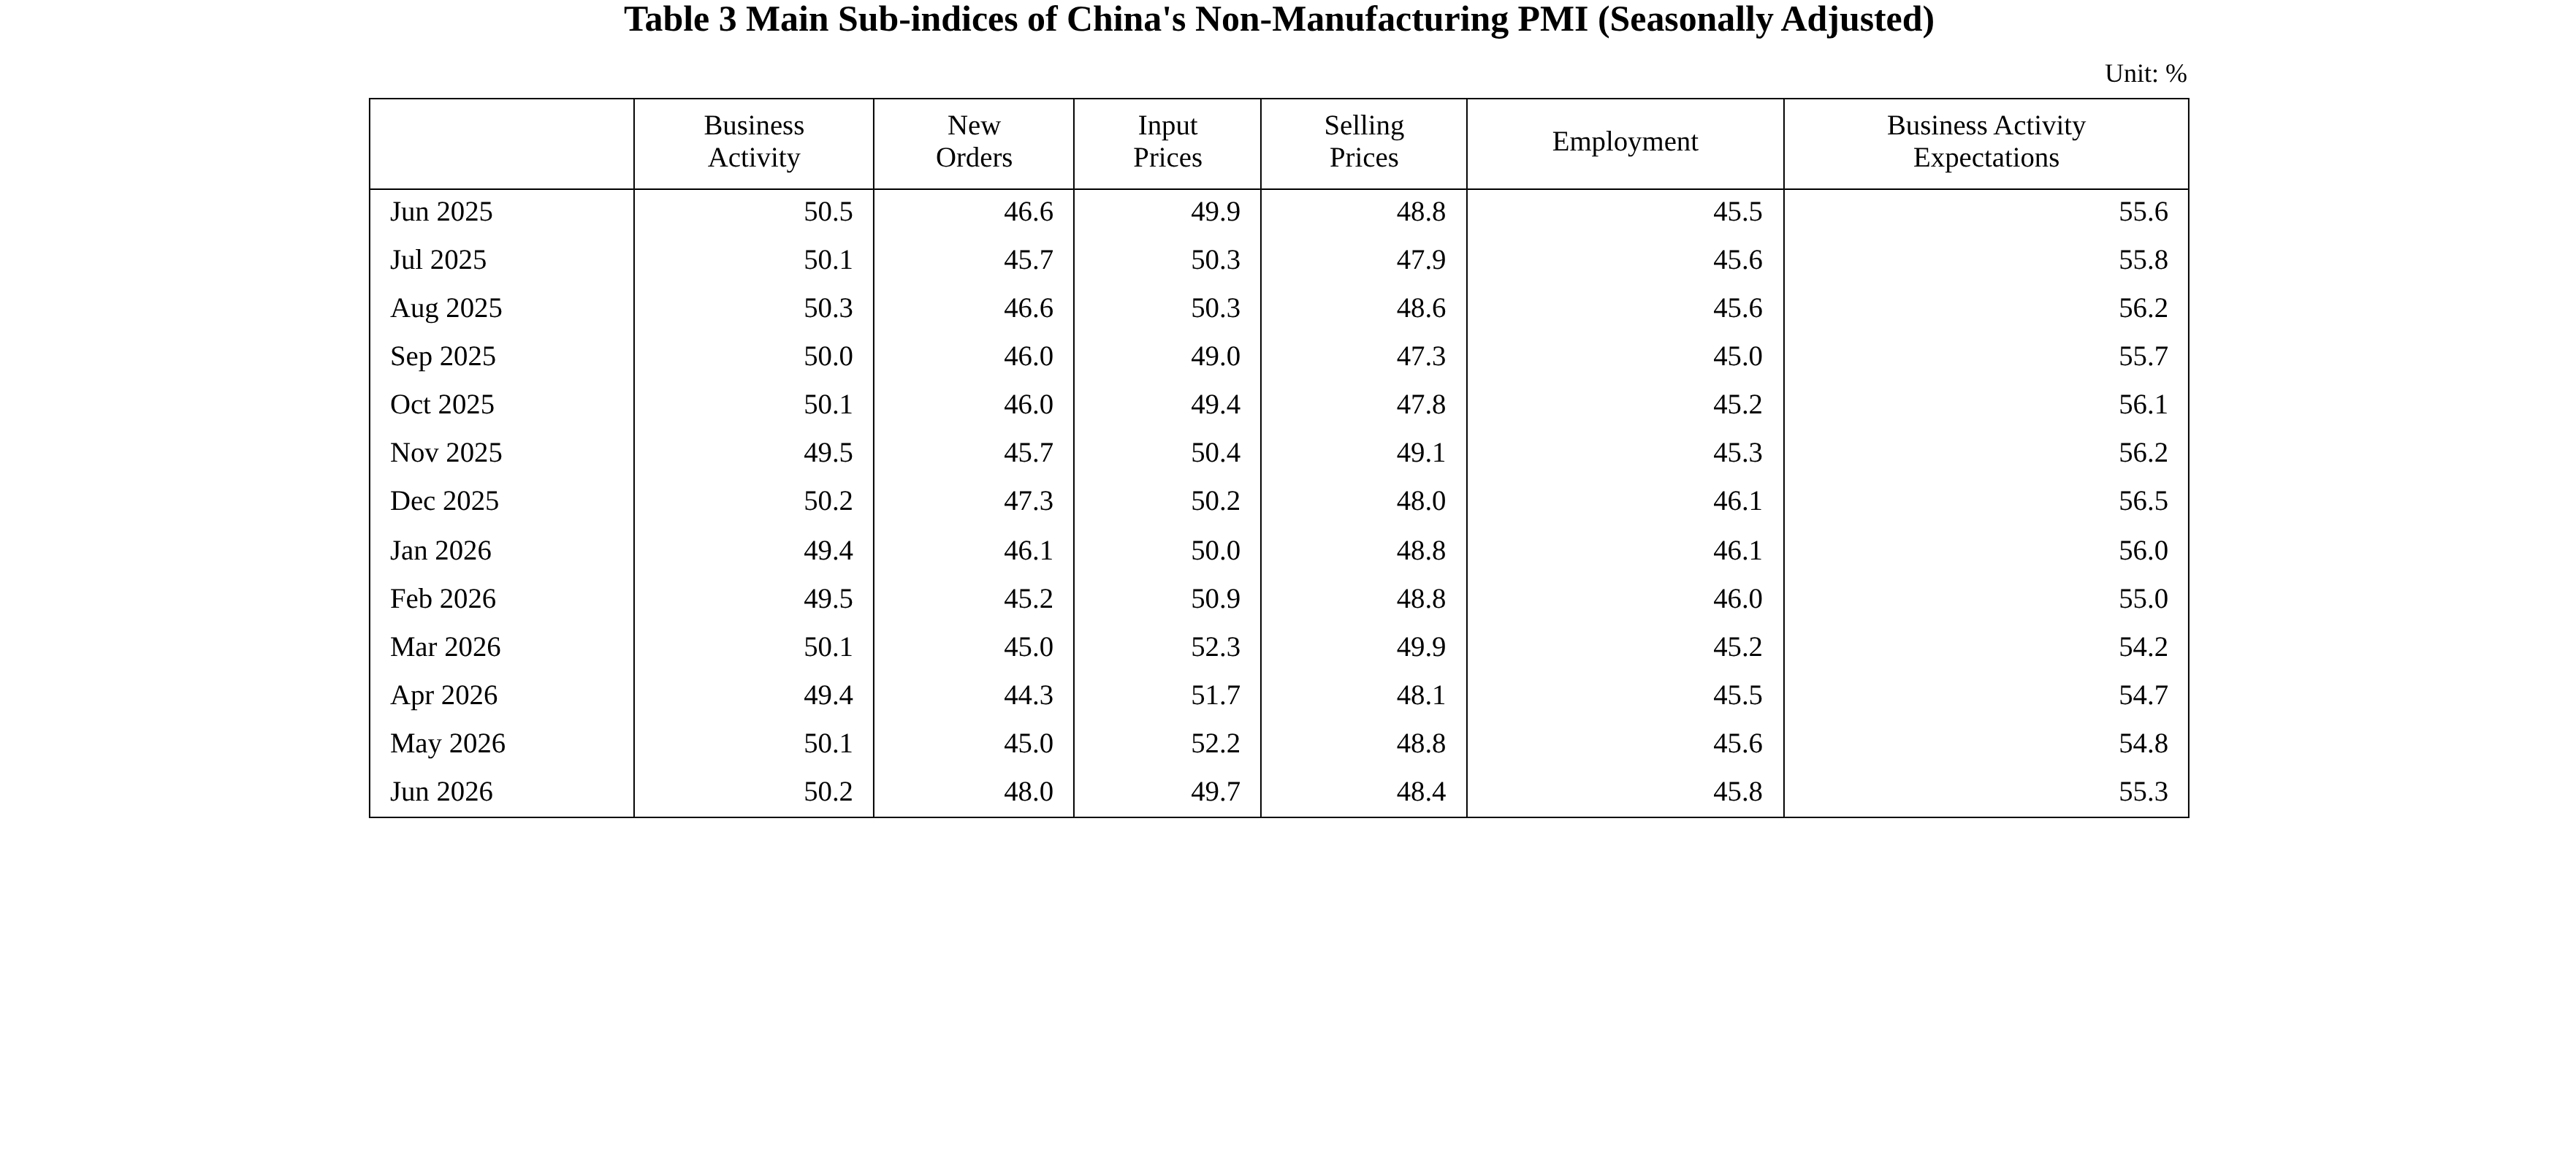
In July, the Non-Manufacturing Business Activity Index was 49.0%, down 1.2 percentage points MoM, with the non-manufacturing sector's level of prosperity falling from the previous month.
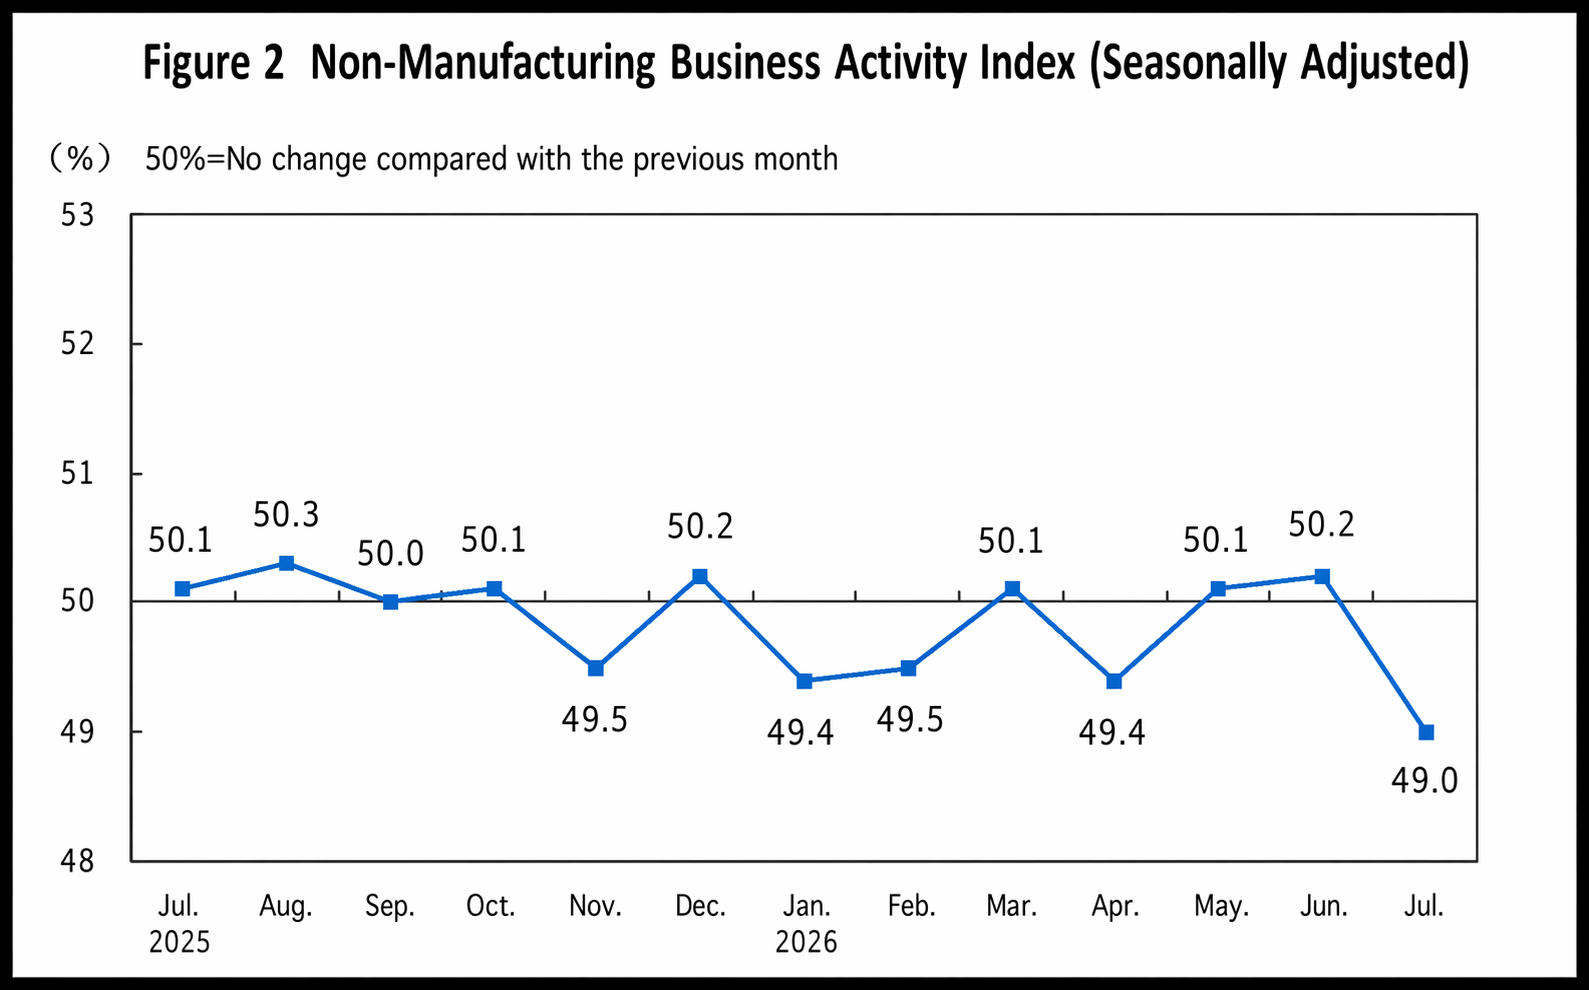
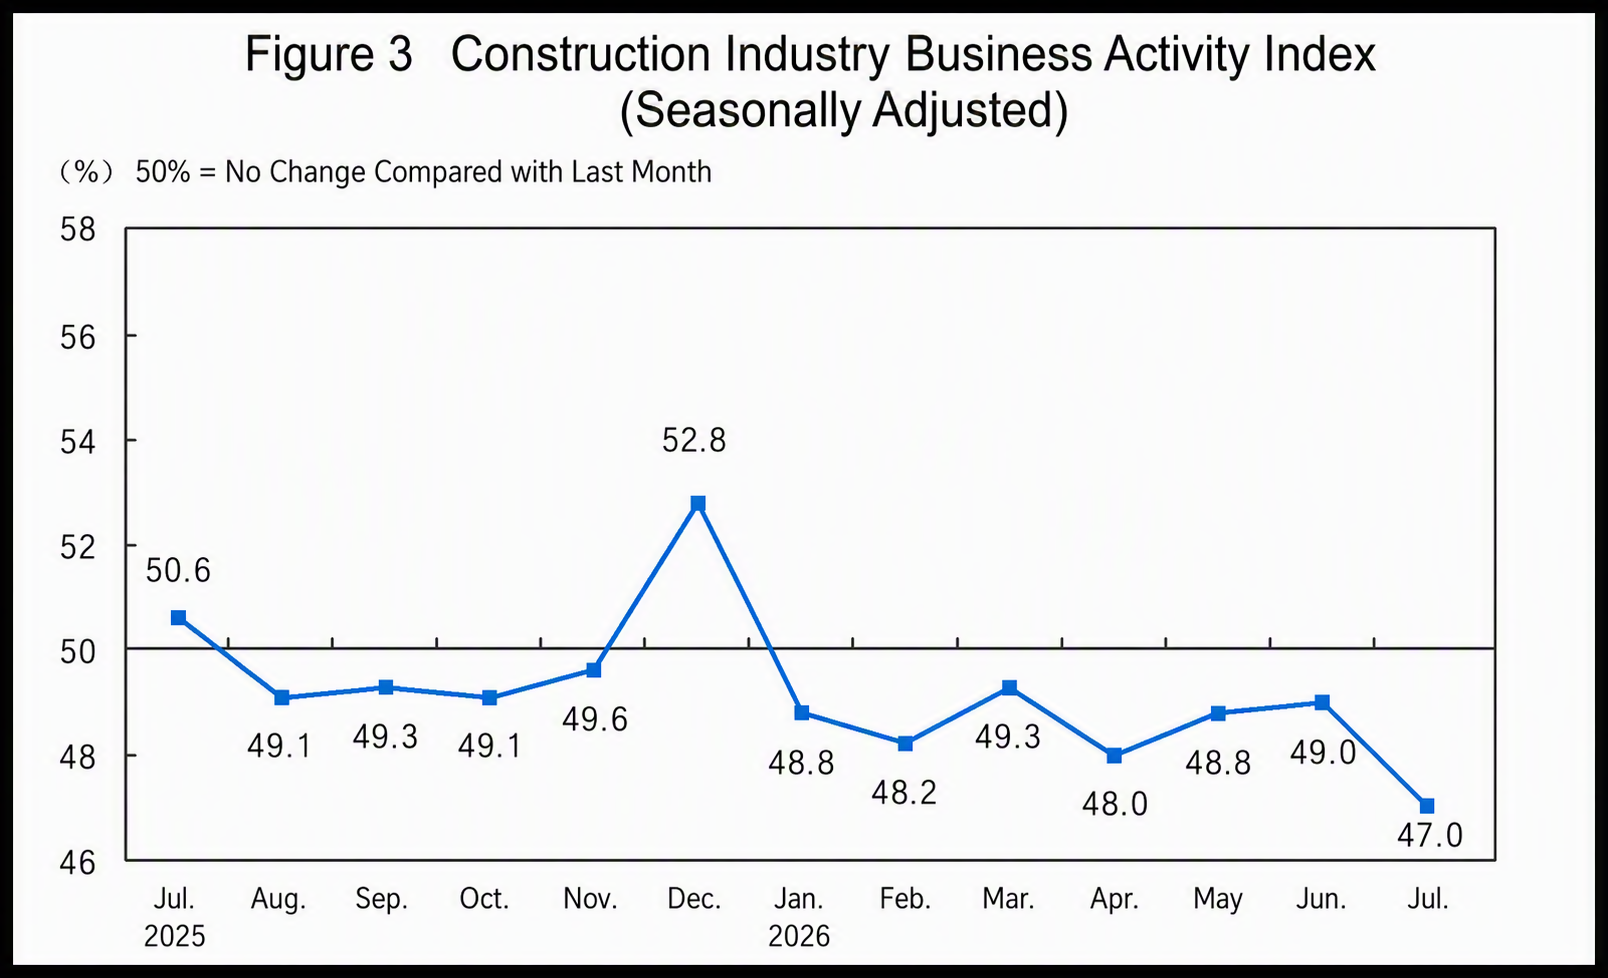
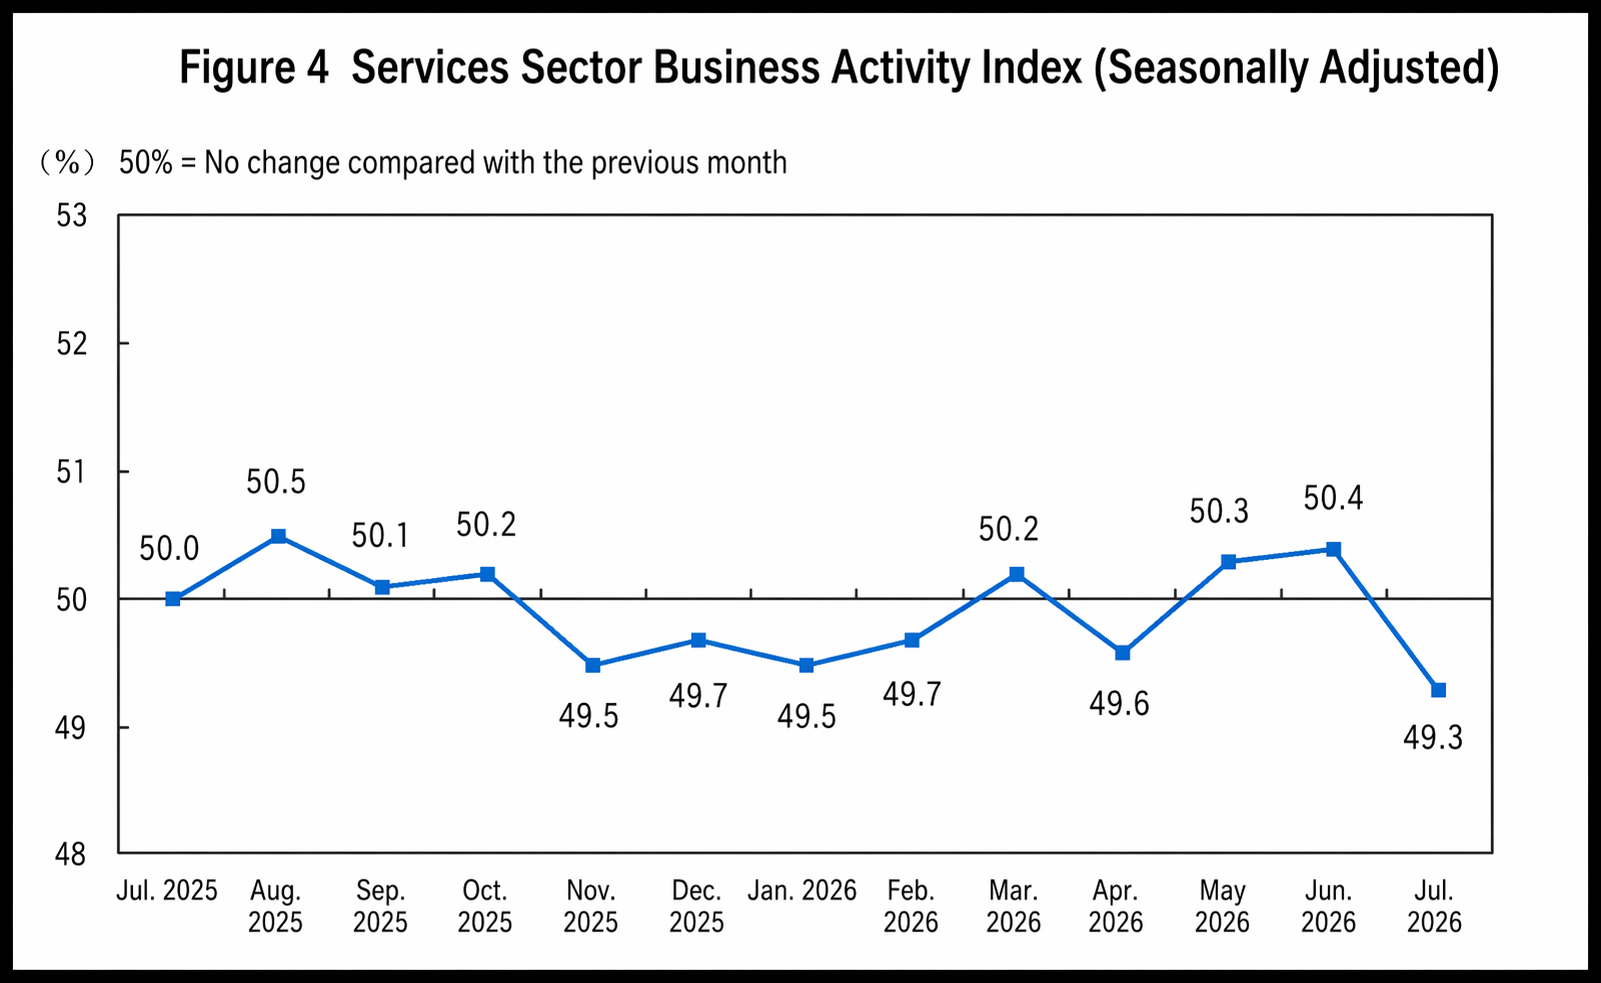
By industry, the Business Activity Index for the construction sector was 47.0%, down 2.0 percentage points MoM; that for the service sector was 49.3%, down 1.1 percentage points MoM. Within the service sector, the Business Activity Indices for postal services, telecommunications, broadcasting, television and satellite transmission services, as well as culture, sports, and entertainment, were all in a relatively high prosperity range above 55.0%; while those for capital market services and real estate were below the threshold.
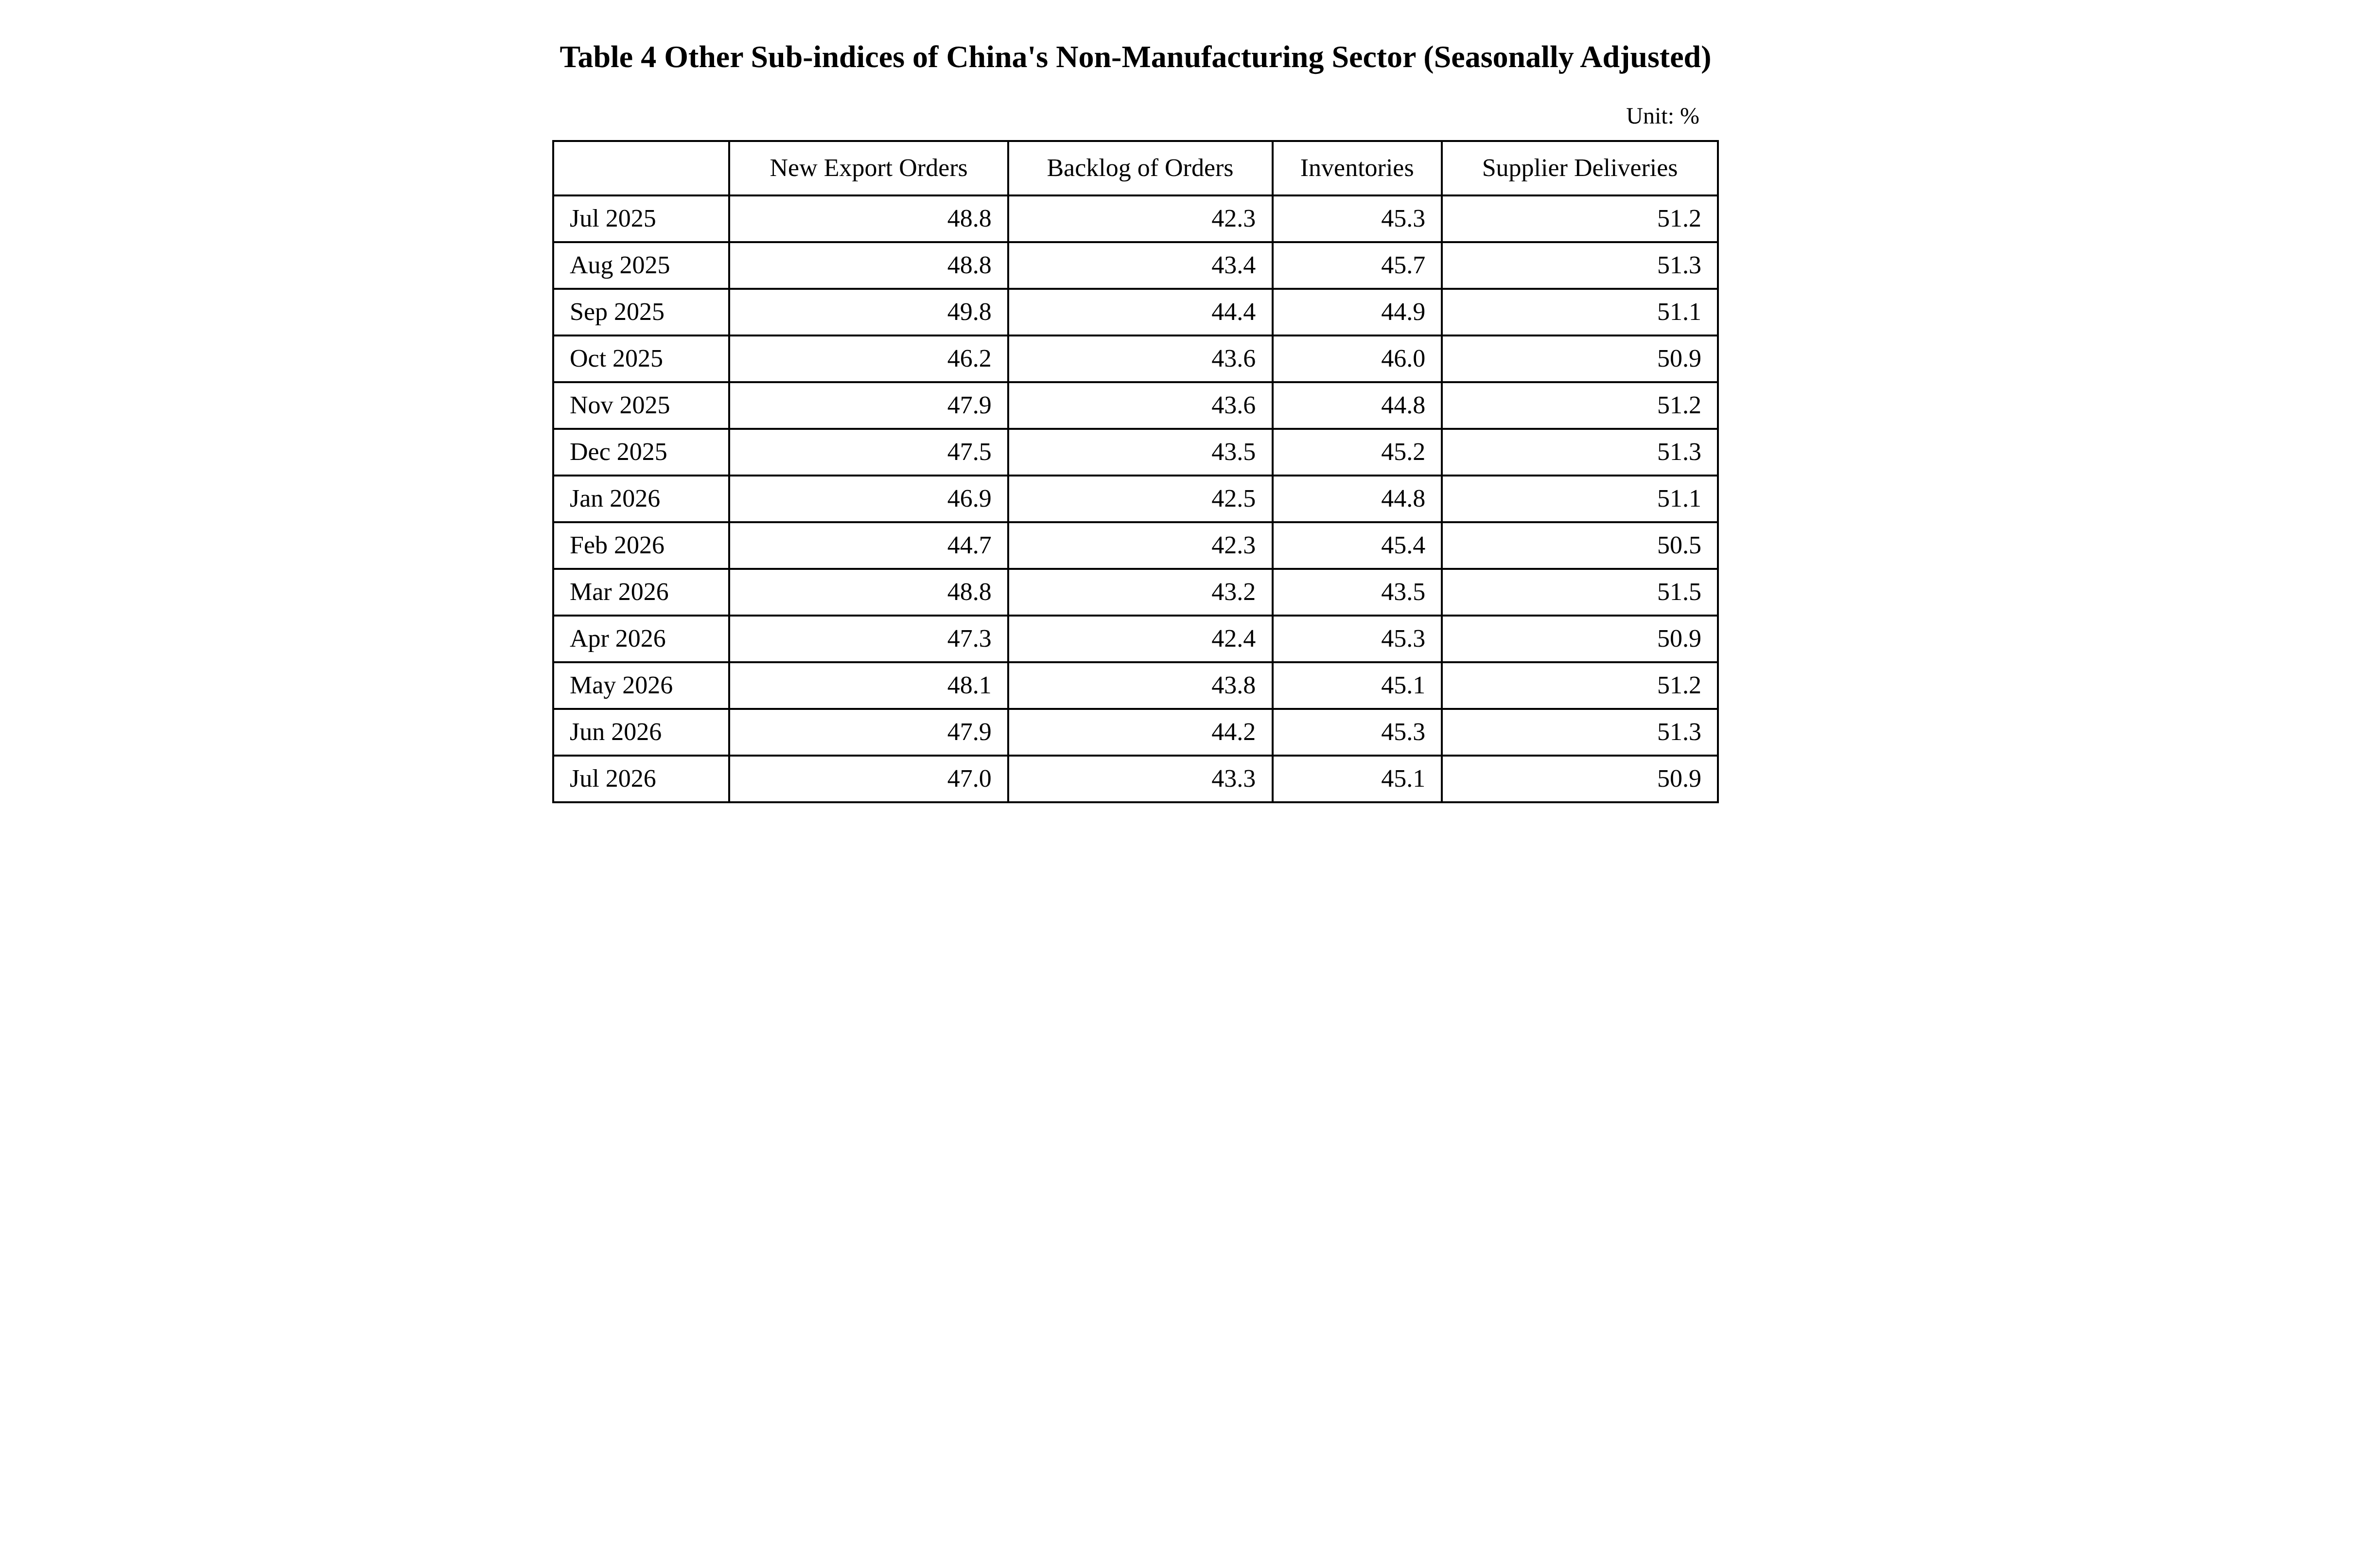
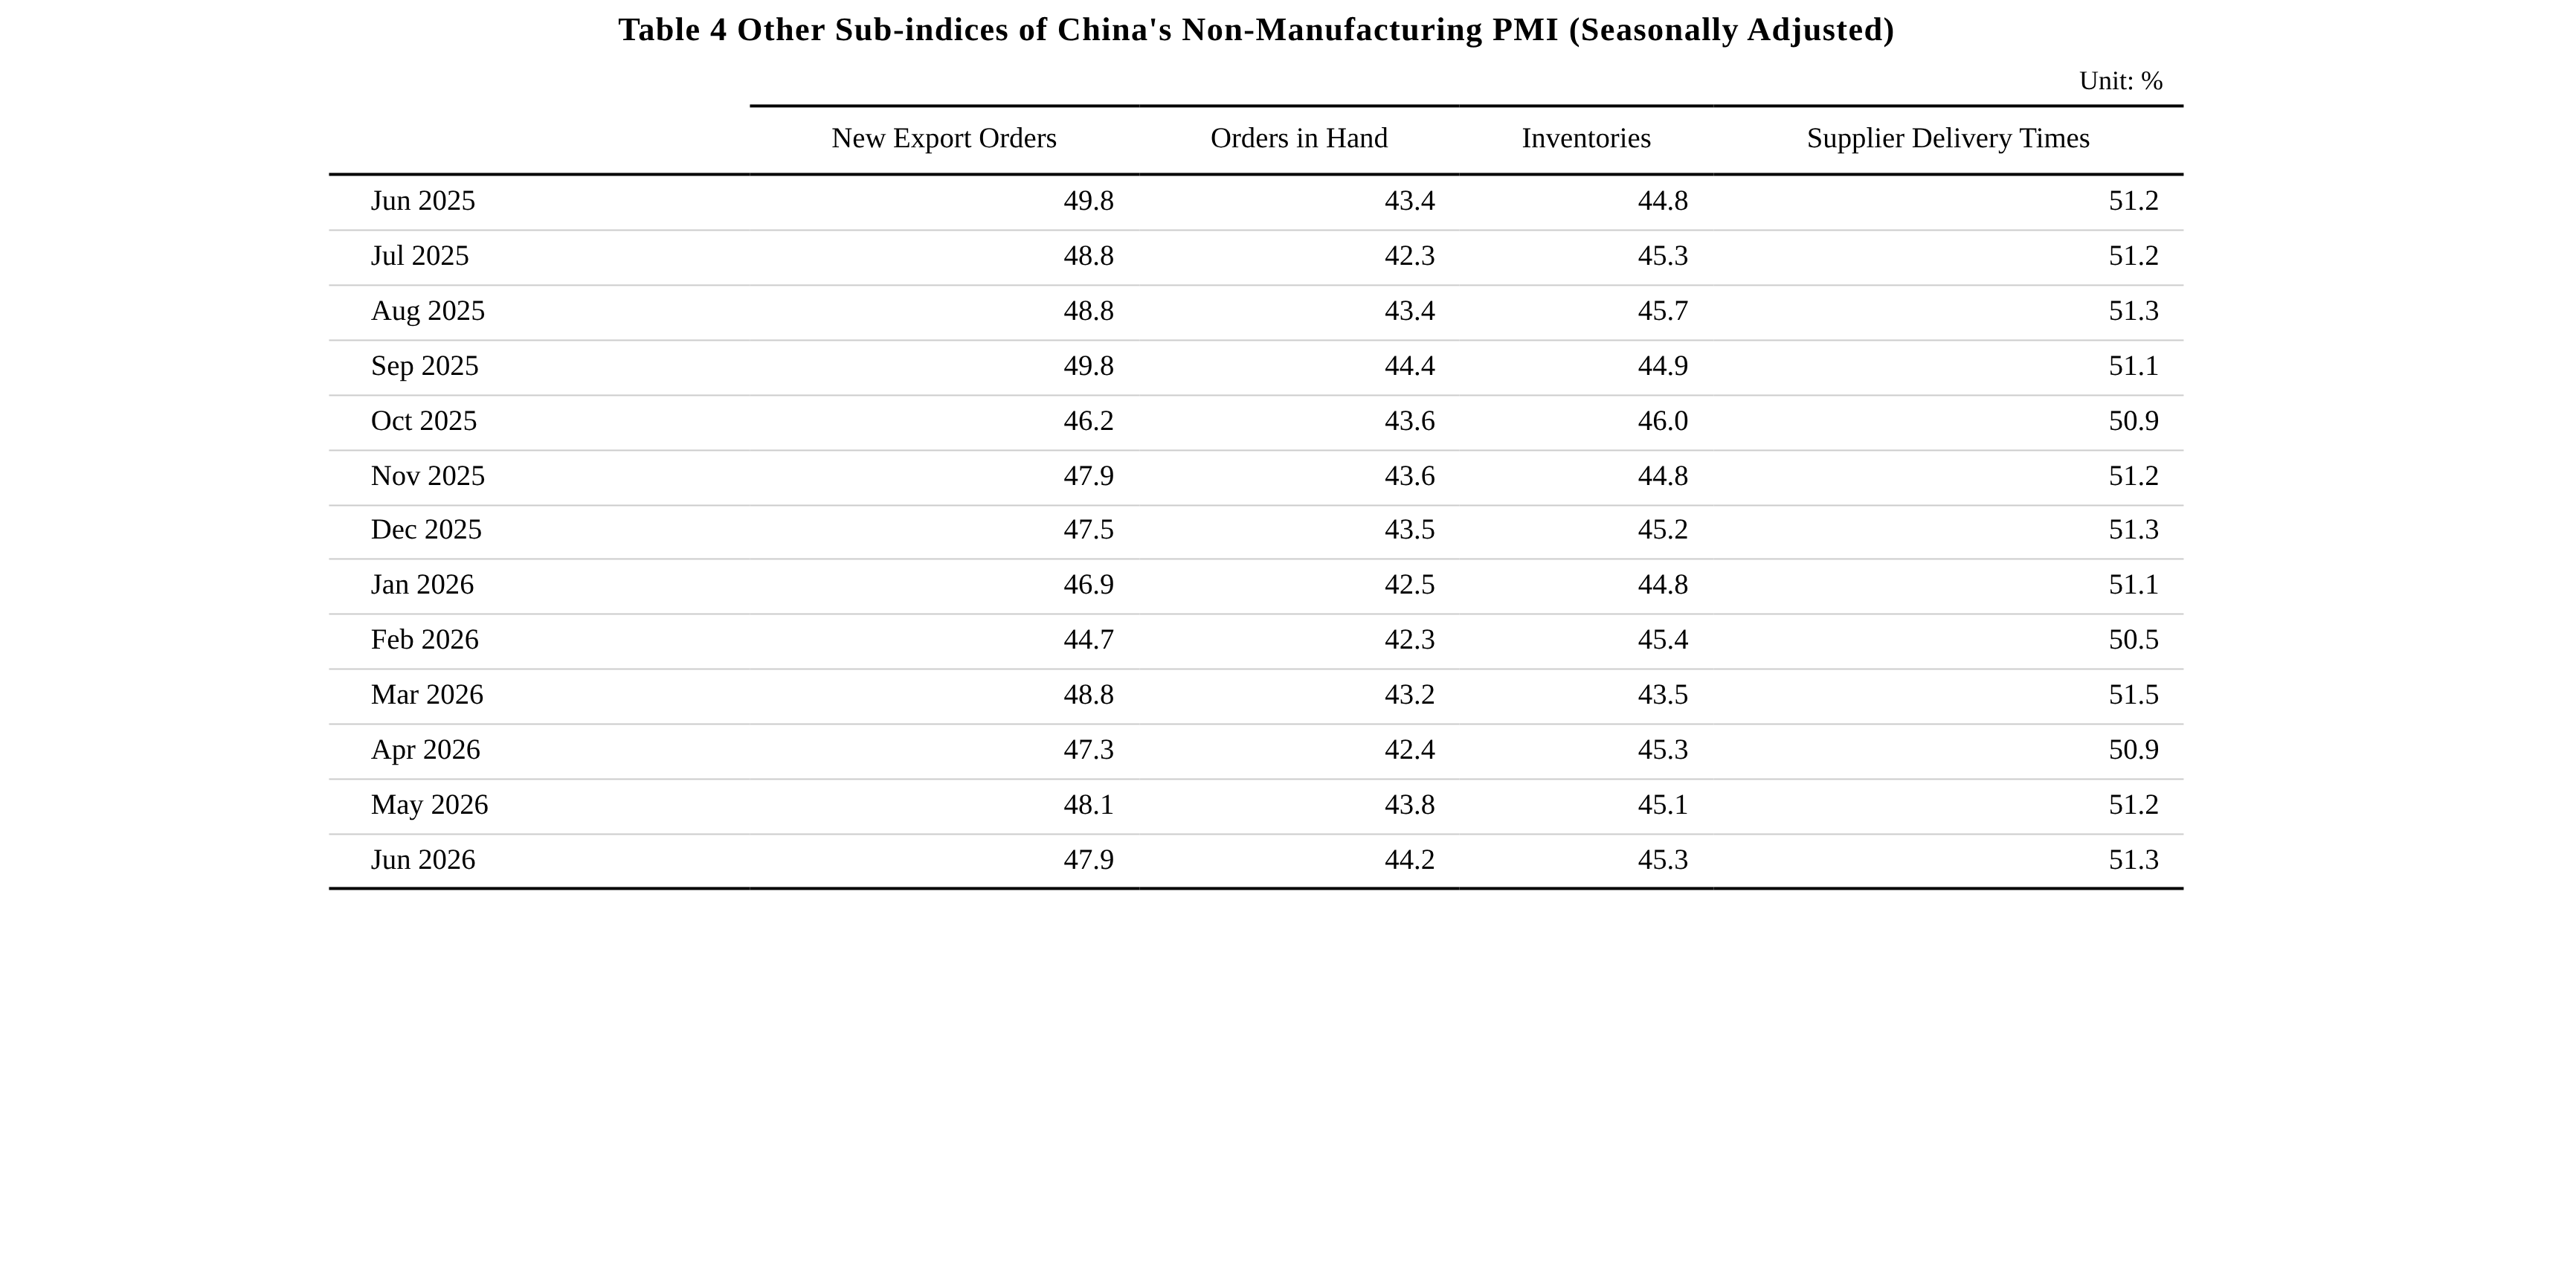
The New Orders Index was 44.4%, down 3.6 percentage points MoM, indicating a pullback in the prosperity level of non-manufacturing market demand. By industry, the New Orders Index for the construction sector was 40.1%, down 6.2 percentage points MoM; that for the service sector was 45.2%, down 3.2 percentage points MoM.
The Input Price Index was 49.7%, unchanged MoM and still below the threshold, indicating that the overall level of input prices used by non-manufacturing enterprises in their operating activities continued to fall. By industry, the Input Price Index for the construction sector was 48.7%, down 1.7 percentage points MoM; that for the service sector was 49.9%, up 0.3 percentage points MoM.
The Selling Price Index was 47.9%, down 0.5 percentage points MoM, indicating that the overall decline in selling prices for non-manufacturing enterprises expanded somewhat. By industry, the Selling Price Index for the construction sector was 47.7%, down 2.1 percentage points MoM; that for the service sector was 47.9%, down 0.3 percentage points MoM.
The Employment Index was 45.4%, down 0.4 percentage points MoM, indicating a pullback in the employment climate of non-manufacturing enterprises. By industry, the Employment Index for the construction sector was 40.9%, down 1.4 percentage points MoM; that for the service sector was 46.2%, down 0.2 percentage points MoM.
The Business Activity Expectations Index was 55.4%, up 0.1 percentage points MoM, indicating that non-manufacturing enterprises' confidence in market development strengthened. By industry, the Business Activity Expectations Index for the construction sector was 51.8%, up 0.7 percentage points MoM; that for the service sector was 56.0%, unchanged from the previous month.
III. China's Composite PMI Output Index
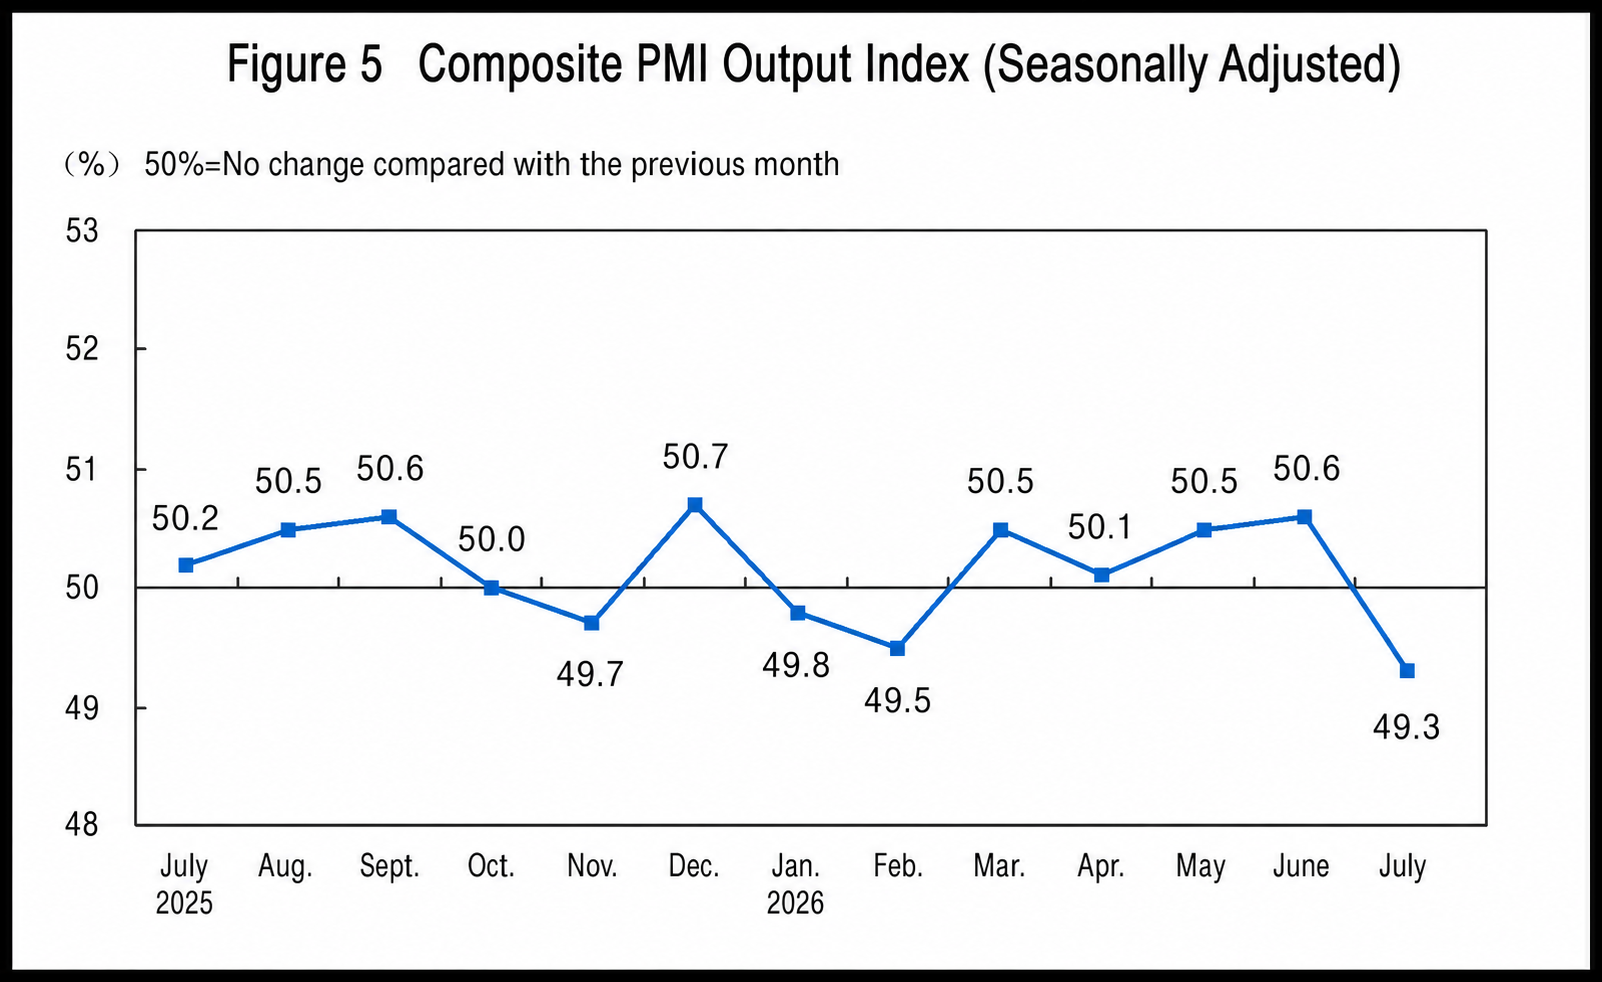
In July, the Composite PMI Output Index was 49.3%, down 1.3 percentage points MoM, indicating that the production and business activities of Chinese enterprises slowed down from the previous month.
III. China's Composite PMI Output Index
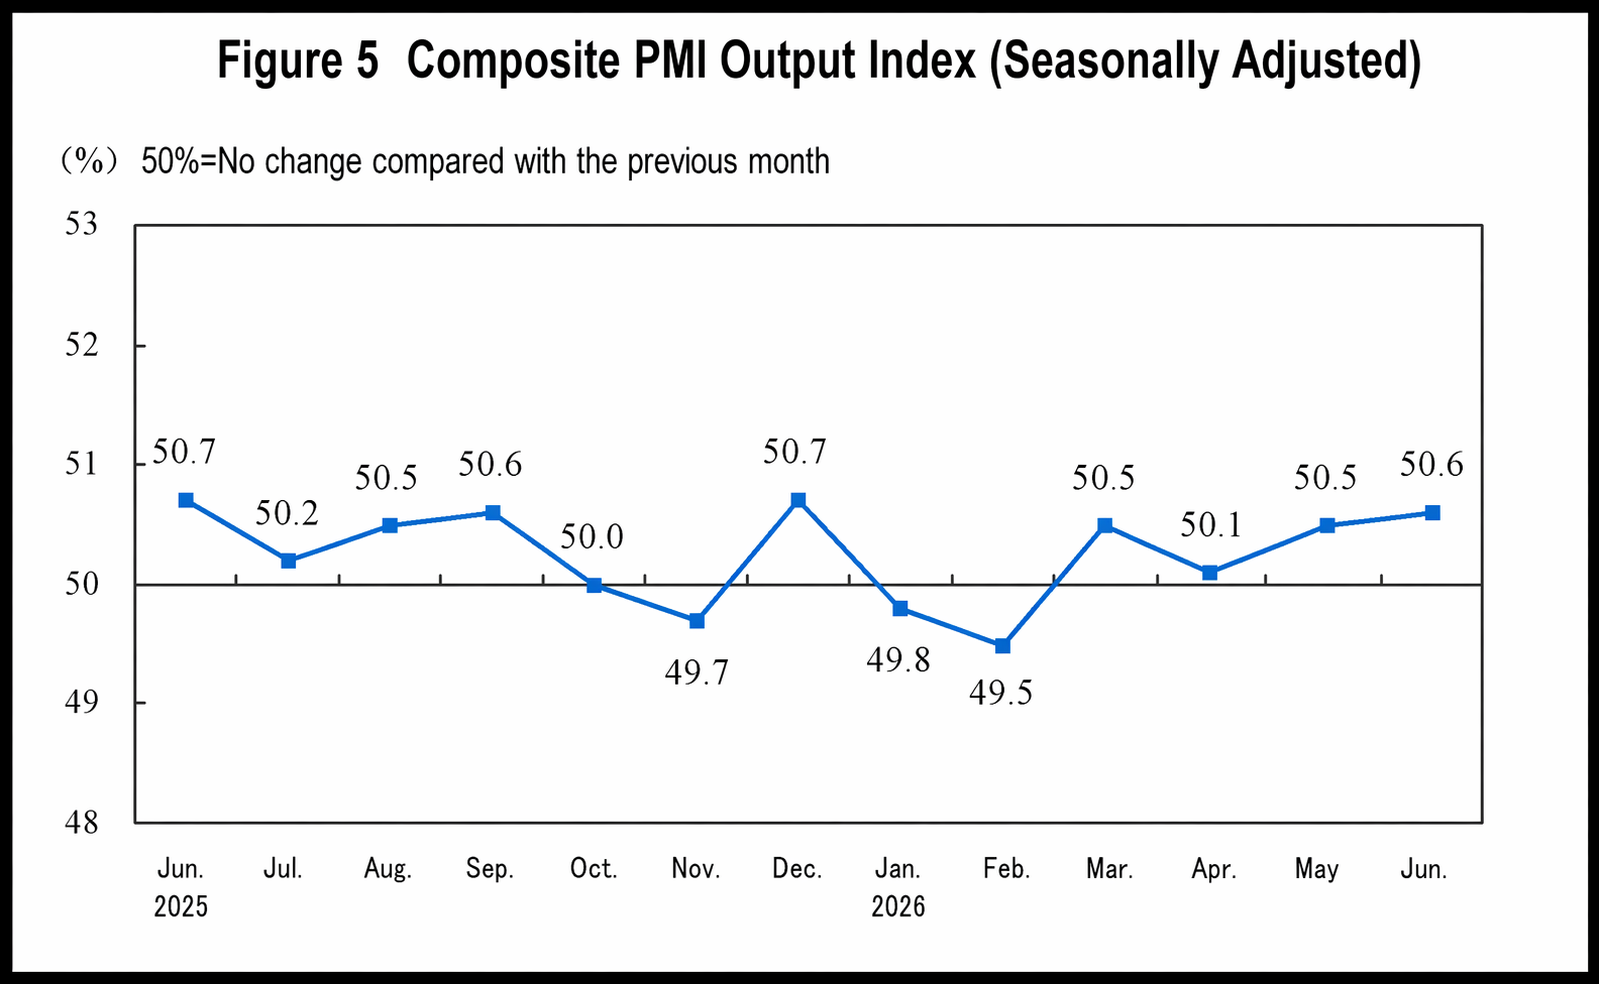
In June, the Composite PMI Output Index was 50.6%, up 0.1 percentage points MoM, indicating that the overall expansion of Chinese enterprises' production and business activities slightly accelerated.
China's PMI Pulls Back in July
—NBS Service Sector Survey Center Chief Statistician Huo Lihui Interprets China's PMI for July 2026
On July 31, 2026, the NBS Service Sector Survey Center and the China Federation of Logistics and Purchasing released China's PMI. Chief Statistician Huo Lihui from the NBS Service Sector Survey Center provided an interpretation.
In July, the Manufacturing PMI, Non-Manufacturing Business Activity Index, and Composite PMI Output Index were 49.2%, 49.0%, and 49.3%, respectively, down 1.1, 1.2, and 1.3 percentage points MoM, with the overall level of prosperity pulling back from the previous month.
I. Manufacturing PMI Pulls Back, While High-Tech Manufacturing Continues to Expand
In July, influenced by factors such as a high base from the earlier rapid growth in manufacturing and some manufacturing sectors entering their traditional off-season, the Manufacturing PMI fell to 49.2%.
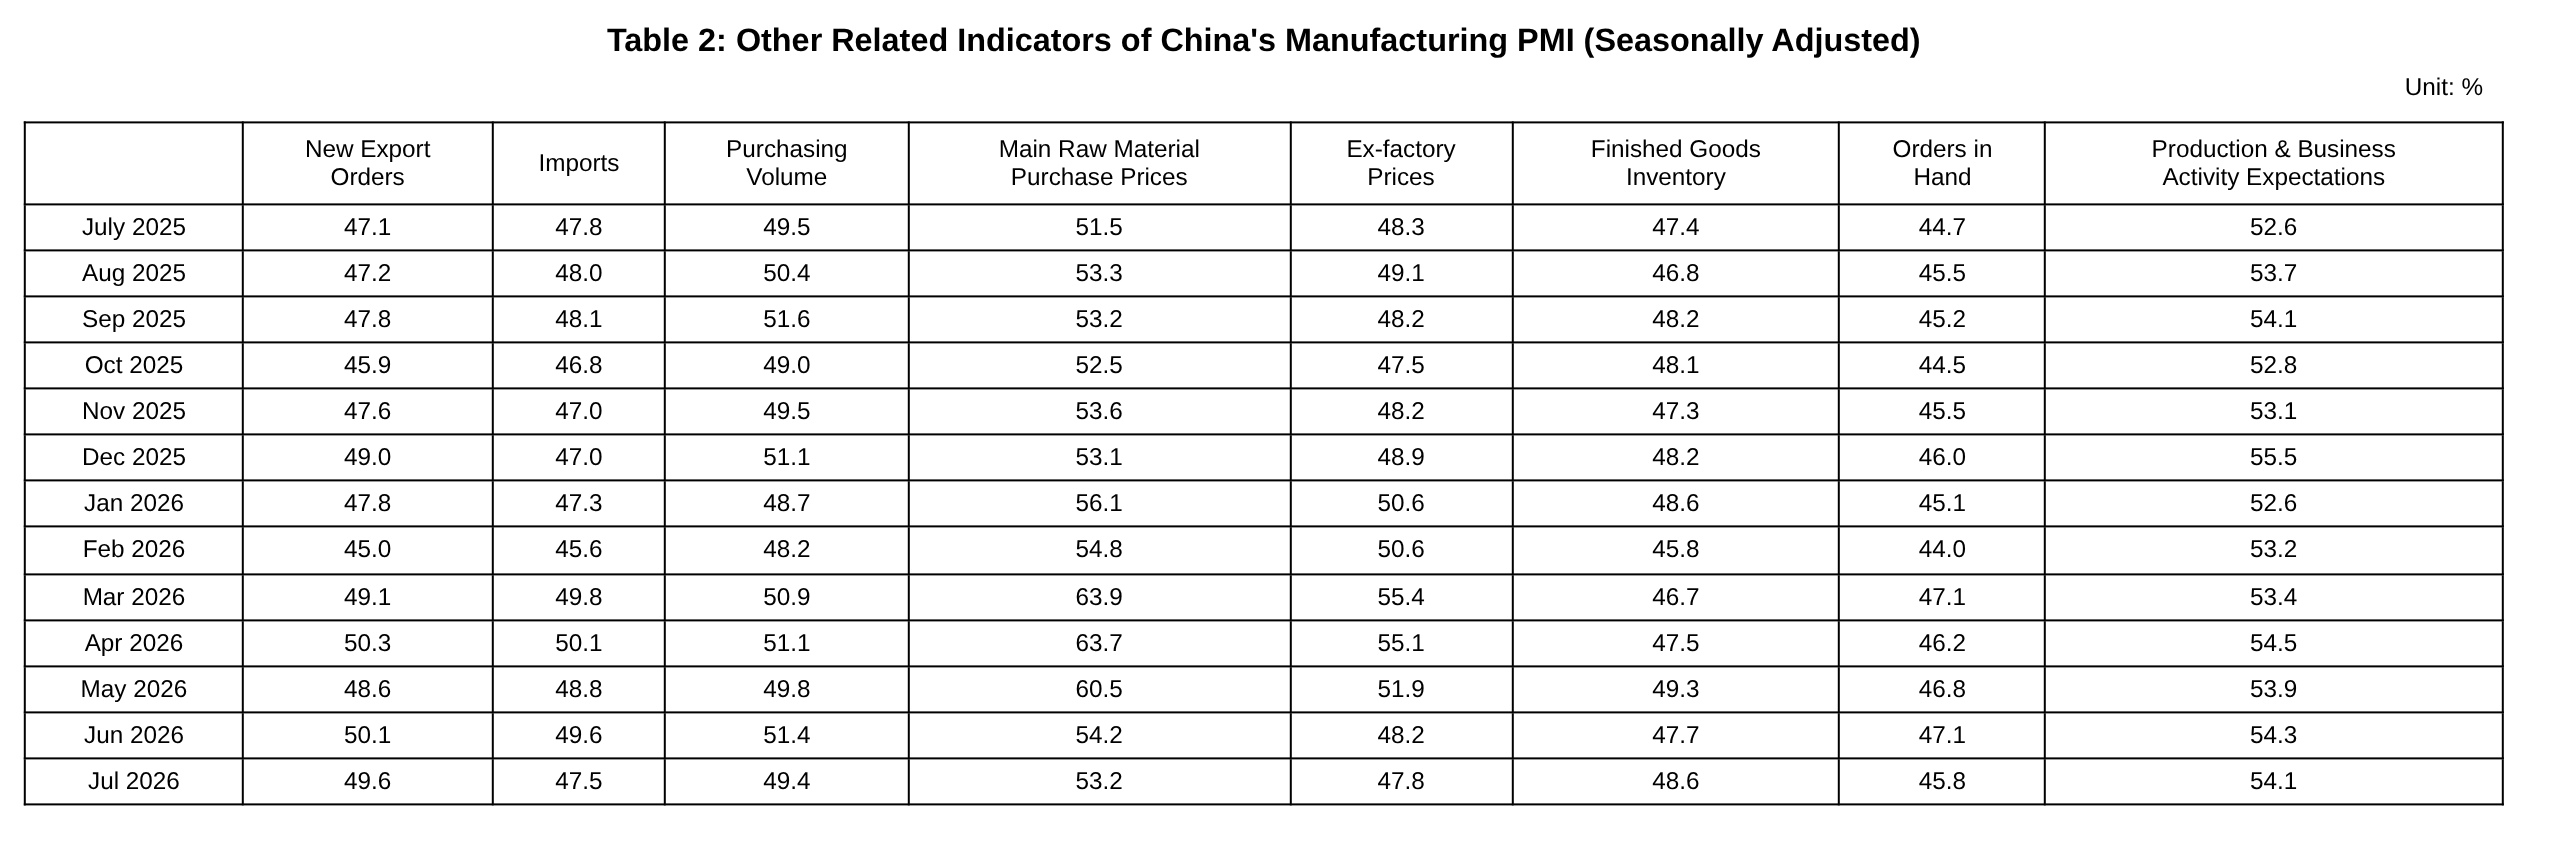
(1) The equipment manufacturing and high-tech manufacturing sectors continued to play a supportive and leading role. The PMIs for equipment manufacturing and high-tech manufacturing were 51.4% and 53.3%, respectively, significantly higher than the overall manufacturing average, maintaining relatively rapid expansion and driving the sector toward new and high-quality development. The PMIs for the consumer goods and high energy-consuming industries were 47.8% and 47.0%, respectively, down 2.4 and 0.1 percentage points MoM, with their levels of prosperity pulling back.
(2) Production and demand grew rapidly in some equipment manufacturing industries. The Manufacturing Production Index and New Orders Index were 49.9% and 48.5%, respectively, down 1.5 and 2.7 percentage points MoM, indicating that both production and market demand among manufacturing enterprises pulled back. By industry, the Production and New Orders Indices for general-purpose equipment and computer, communication, and electronic equipment were both above 53.0%, indicating high market activity and rapid growth in both production and demand. Indices for industries such as non-metallic mineral products, ferrous metal smelting and rolling processing, and automobiles were below the threshold, indicating weak supply-demand momentum.
(3) Price indices continued to fall. The Major Raw Material Purchase Price Index and EXW Price Index were 53.2% and 47.8%, respectively. Affected by recent fluctuations in some commodity prices and other factors, these indices have fallen for four consecutive months. Among these, both price indices for the non-ferrous metal smelting and rolling processing industry were below 45.0%. Due to significant price level fluctuations, enterprise purchase willingness weakened, and the Procurement Volume Index fell to 49.4% this month.
(4) Market expectations remained stable. The Manufacturing Production and Business Activity Expectations Index was 54.1%, with enterprises generally remaining optimistic about market development. By industry, the Expectations Indices for the food, beverage, and refined tea, and railway, shipbuilding, aerospace, and other equipment sectors rose above 60.0%, as related enterprises showed increased confidence in near-term industry development.
II. Non-Manufacturing Business Activity Index Declines, While the Cultural and Tourism Sector Is Relatively Active
In July, the Non-Manufacturing Business Activity Index was 49.0%, down 1.2 percentage points MoM, with the level of prosperity in the non-manufacturing sector pulling back from the previous month.
(1) The cultural and tourism sector's prosperity rebounded. The Service Sector Business Activity Index was 49.3%, down 1.1 percentage points MoM, with market activity in the service sector pulling back. By industry, driven by summer consumption, residents' leisure, entertainment, and travel activities increased, leading to a clear MoM rebound in the Business Activity Indices for air transportation, accommodation, culture, sports, and entertainment. The total business volume of related enterprises grew rapidly. The indices for wholesale trade and monetary and financial services declined significantly, representing the main unfavourable factors behind the pullback in service sector prosperity this month. Indices for capital market services and real estate were below the threshold. The Service Sector Business Activity Expectations Index was 56.0%, unchanged from the previous month, with enterprises' confidence in near-term market development remaining relatively stable.
(2) The construction sector's level of prosperity declined. Affected by unfavourable factors such as recent high temperatures, heavy rains, flooding, and other natural disasters in some regions, the construction progress slowed down, and the Business Activity Index was 47.0%, down 2.0 percentage points MoM. The Construction Business Activity Expectations Index was 51.8%, up 0.7 percentage points MoM, indicating that enterprises' confidence in near-term industry development strengthened somewhat.
III. Composite PMI Output Index Below the Threshold
In July, the Composite PMI Output Index was 49.3%, down 1.3 percentage points MoM, with the production and business activities of Chinese enterprises slowing down from the previous month. The Manufacturing Production Index and Non-Manufacturing Business Activity Index, which constitute the Composite PMI Output Index, were 49.9% and 49.0%, respectively.
![[SMM Analysis] Southeast Asia Aluminum Scrap Market Remains Range-Bound; ADC12 Stays Under Pressure, CBAM in Focus](https://imgqn.smm.cn/production/admin/votes/imageslvDRc20240314085754.png)
![July Aluminum Processing PMI Records 42.2%, Fully Falling into Contraction Territory as End-Use Demand Weakens, Exports Diverge, and Sector Recovery Remains Unlikely in Short Term [SMM Downstream In-Depth Analysis]](https://imgqn.smm.cn/usercenter/mZFrc20251217171654.jpg)
![Market Supply and Demand Both Sluggish but Inventory Buildup Risk Remains, Short-Term Lead Prices to Stay Under Pressure [SMM Lead Morning Brief]](https://imgqn.smm.cn/usercenter/mIbTL20251217171721.jpg)