

CBAM Moves from Paperwork to Price Tag for Asian Stainless Steel Exporters
Rising compliance costs, a verification bottleneck, and tightening EU import quotas combine to reshape the competitive landscape for Asian stainless steel suppliers in Europe from 2026 onward.
The EU Carbon Border Adjustment Mechanism (CBAM) entered its definitive implementation phase on January 1, 2026 — transitioning from a reporting exercise into a mechanism with real trade cost implications. For Asian stainless steel exporters, 2026 is not a grace period. It is a critical window to build emissions data infrastructure and secure verification capacity before costs begin to compound.
I. Default Values Penalize High-Carbon Origins
CBAM covers stainless steel under the iron and steel product category, including HS codes 7218–7223 — stainless ingots, hot-rolled coil (HRC), cold-rolled coil (CRC), bars and rods, and wire. Importers can declare embedded emissions using either EU-prescribed country-level default values or verified actual emissions confirmed by an accredited third-party verifier.
The default values carry a deliberate penalty. In 2026, the EU applies a 10% markup on top of calculated default figures; from 2028, that markup rises to 30%, to incentivize producers to build real emissions monitoring and verification systems.
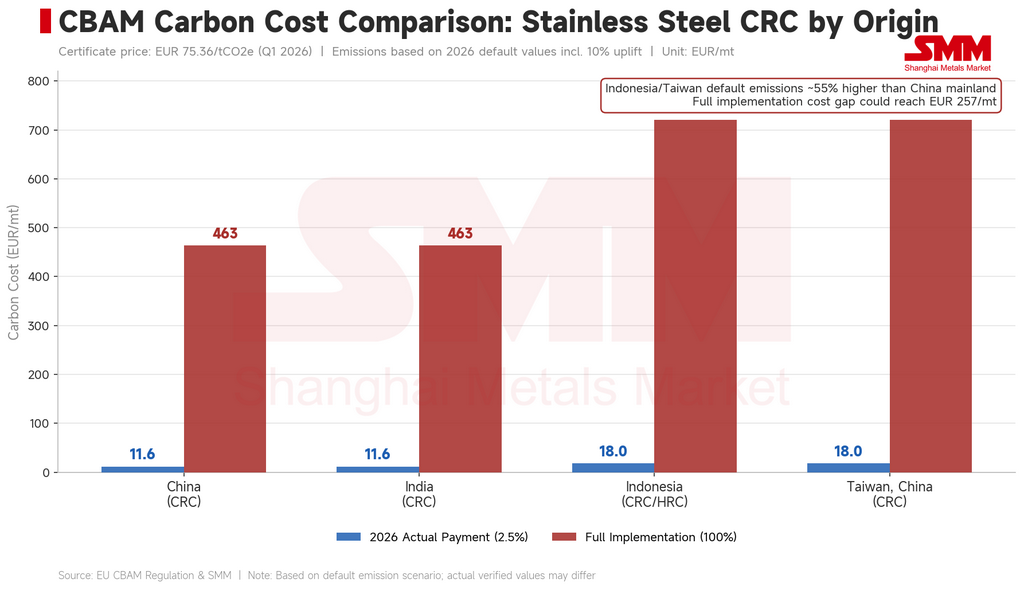
For cold-rolled stainless steel, the default embedded emissions for products originating in mainland China and parts of India (under HS 7219) stand at approximately 5.59 tCO₂e/mt — or around 6.15 tCO₂e/mt after the 2026 markup. Indonesia and Taiwan, China carry higher defaults of around 8.69 tCO₂e/mt, rising to approximately 9.56 tCO₂e/mt after adjustment.
II. Current Costs Look Modest — but the Trajectory Is Not
The EU's published CBAM certificate price for Q1 2026 is €75.36/tCO₂e, and €75.28/tCO₂e for Q2. With the 2026 obligation rate set at just 2.5% of embedded carbon liabilities, near-term costs remain limited: approximately €11.6/mt for mainland Chinese CRC, and around €18.0/mt for Indonesian and Taiwan, China-origin material.
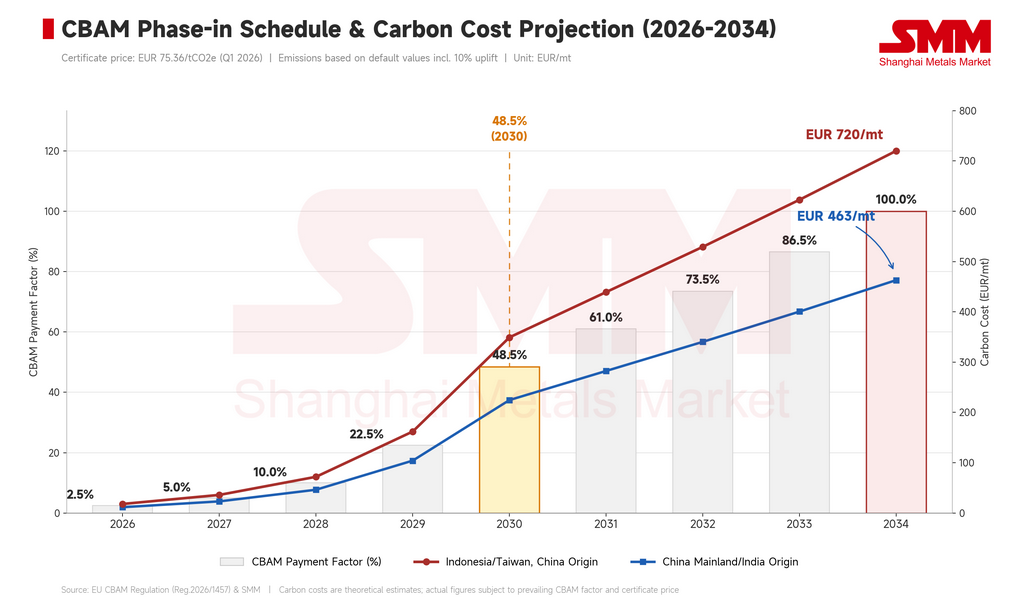
However, the long-term exposure is considerably larger. As EU free allowances under the Emissions Trading System (EU ETS) are phased out, the CBAM obligation rate is projected to rise to 48.5% by 2030, and reach 100% by 2034. At full implementation, the implied carbon liabilities under default values would reach approximately €463/mt for Chinese CRC and around €720/mt for Indonesian and Taiwan, China-origin CRC. Some Indonesian HRC products could face liabilities approaching €580/mt under full CBAM.
The "hundreds of euros per tonne" figures widely cited in the market refer to these full-implementation scenarios — not current payable amounts. But the trajectory is set; costs will shift from theoretical risk to real trade costs as the phase-in accelerates.
III. Indonesia and Slab Re-rollers Face Disproportionate Exposure
The divergence in emissions intensity across production routes is reshaping competitive positions in Europe.
Indonesia's stainless steel industry relies primarily on the rotary kiln electric furnace (RKEF) Nickel Pig Iron (NPI)-to-stainless integrated route — a pathway characterized by high coal-fired power consumption and energy-intensive smelting. Embedded emissions are substantially higher than the electric arc furnace (EAF)-on-scrap route dominant in Europe. Indonesia also lacks a domestic carbon pricing mechanism that the EU would recognize for CBAM offset purposes, leaving Indonesian exporters fully exposed to default-value penalties.
The problem extends to re-rollers. Processors in Taiwan, China; Vietnam; and Turkey that purchase Indonesian slab for downstream rolling face the same high upstream carbon footprint — regardless of where the final rolling takes place. If embedded emissions can be traced to Indonesian high-carbon smelting, the product's carbon intensity remains elevated, and exporters may also face additional compliance requirements around proof of melt-and-pour origin.
The EU's decision to set default emission values for certain Taiwan, China cold-rolled products at levels comparable to Indonesia directly reflects this dependence on Indonesian slab. The notable decline in Taiwan, China's CRC quota utilization for Europe in recent periods may partly reflect importers proactively managing future CBAM exposure — not just demand-side factors.
Mainland Chinese and Indian products carry relatively lower default values but remain significantly above EU domestic benchmarks. China has an operational national carbon market, but whether its carbon price will be recognized by the EU for CBAM offset purposes remains unresolved.
Ultimately, competitive advantage under CBAM will not be determined solely by country-of-origin default values. Exporters who can present credible, traceable, third-party-verified actual emissions data — and demonstrate that their real figures fall well below the defaults — stand to capture a meaningful cost advantage.
IV. The Verification Bottleneck Is the Most Immediate Constraint
More pressing than the carbon cost itself is the shortage of accredited verification capacity.
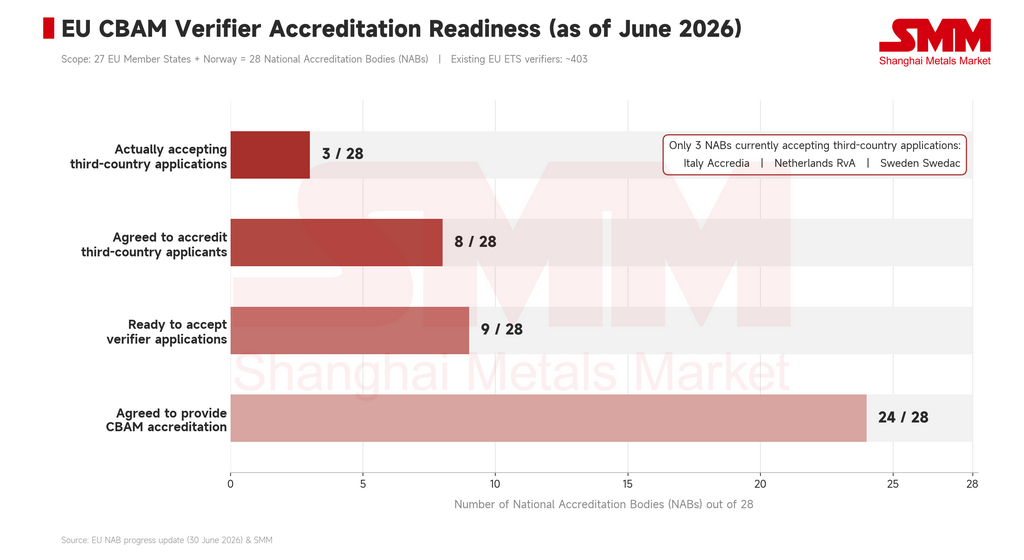
As of June 30, 2026, the EU had published the status of National Accreditation Bodies (NABs) across its 27 member states and Norway. Of 24 NABs willing to offer CBAM accreditation services, only nine were ready to accept applications from verifiers, eight were willing to accredit third-country applicants, and just three had actually begun accepting such applications — Italy's Accredia, the Netherlands' RvA, and Sweden's Swedac.
This severely limits the verification options available to Asian stainless steel producers seeking on-site emissions audits. Approximately 12,000 entities had applied for CBAM authorized declarant status as of early 2026, while the total pool of EU ETS-accredited verifiers numbers only around 403 — and those verifiers must cover steel, aluminium, cement, fertilizers, and other CBAM-covered sectors simultaneously. Demand for audit capacity from third-country production facilities will likely strain available resources considerably.
Verification costs for a single production facility are estimated at €5,000–€50,000. The first reporting period also requires physical on-site visits — remote-only verification is not permitted for the initial cycle.
The first CBAM declaration covering 2026 imports is due by September 30, 2027. Working backward through NAB accreditation, verifier engagement, on-site audit, report issuance, and importer filing — the practical preparation window is already narrowing.
V. CBAM and TRQ: A Dual Constraint on European Market Access
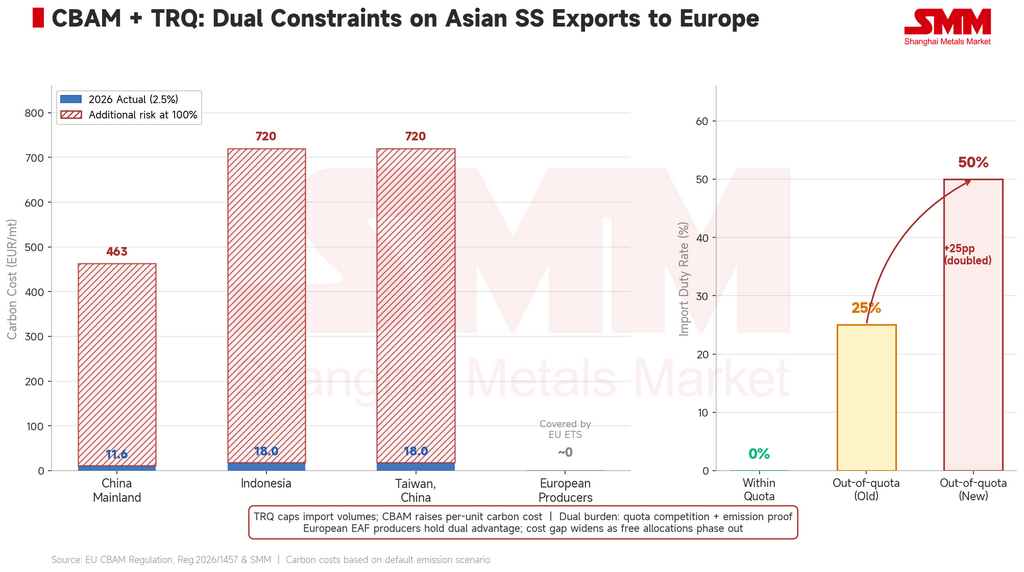
CBAM does not operate in isolation. It layers on top of the EU's steel safeguard tariff-rate quota (TRQ) regime, which was tightened under the new framework that took effect July 1, 2026. Out-of-quota duties on certain stainless steel categories have risen from 25% to 50%, further restricting market access for major Asian suppliers including mainland China, Indonesia, and Taiwan, China.
The two mechanisms operate along different dimensions but reinforce each other. TRQs constrain import volumes; CBAM adds a per-tonne carbon cost on top. Asian suppliers must now compete for limited duty-free quota space while simultaneously demonstrating that their embedded emissions are low enough to remain price-competitive.
By contrast, European producers such as Outokumpu and Aperam primarily use EAF-on-scrap routes with substantially lower carbon intensity. Their production is already integrated into the EU ETS framework. As free allowances continue to be phased out, the cost gap between domestically produced stainless steel and high-carbon imports from Asia is likely to widen further.
Outlook
The 2.5% obligation rate in 2026 is not enough to fundamentally reshape Asian stainless steel trade flows to Europe on its own. But CBAM's influence is already visible in customer due diligence, contract pricing discussions, and supply chain audits.
The priority for Asian exporters is not to wait for costs to escalate before acting. The window that exists now — before verification infrastructure matures and before obligation rates rise sharply — should be used to complete a quantified comparison of default versus actual emissions costs, build traceable facility-level carbon data systems, and establish working relationships with verifiers already accredited for third-country engagements, in preparation for the September 2027 filing deadline.
The CBAM ledger has started running. In the post-CBAM era, the exporters who maintain pricing power in European markets will not necessarily be those with the lowest production costs — but those who can credibly demonstrate lower emissions and stronger compliance capabilities.

![[SMM Analysis] Inventory Accumulation and Weak Demand Push High-Grade NPI Lower in Search of a Bottom](https://imgqn.smm.cn/usercenter/LNpBh20251217171732.jpeg)