SMM July 22 News:
According to customs data, January-June lead concentrate imports totaled 703,900 mt (physical content), up 8.79% YoY. In H1 2026, China's lead concentrate imports maintained positive YoY growth overall, but showed a higher-then-lower trend on a monthly basis, with key drivers from premium purchases of high-silver associated lead ore and insufficient incremental output of domestically produced lead concentrates (in January-June, China's self-produced lead concentrates totaled 776,500 mt Pb, down 1.3% YoY, with delays in new domestic lead mine projects, year-by-year grade declines at existing mines, and environmental protection inspections) providing support; meanwhile, geopolitical conflicts, overseas mine disruptions, and persistently deep negative import TCs limited a substantial increase in imports.
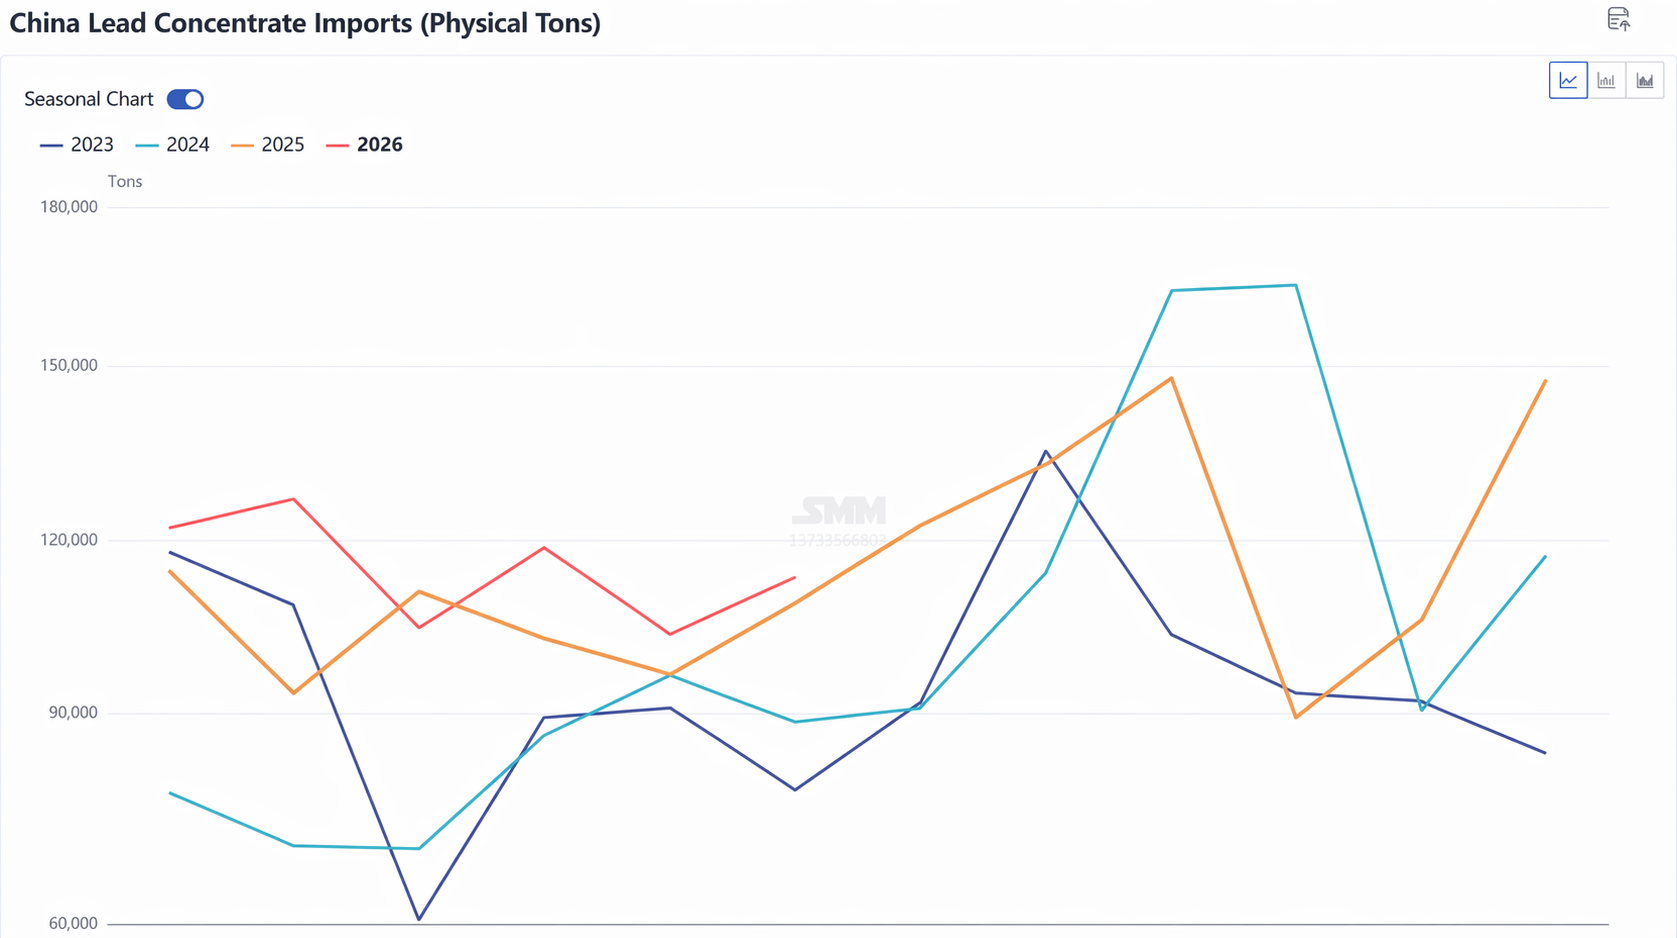
In terms of details, the trade sourcing structure shifted significantly, with supplies from Russia, Bolivia, the US, and Iran contracting, while Myanmar, Oman, Australia, and Peru became key sources of incremental growth, as Russian mine output was unstable and shipping routes fluctuated, causing supply tightening; in Bolivia, sustained protests since May disrupted overseas mine shipments; the US, affected by tariffs, saw its cumulative volume in January-June drop by 35,000 mt to 9,800 mt; and Iran, hit by geopolitical issues, saw its imports fall to zero mt in the same period.
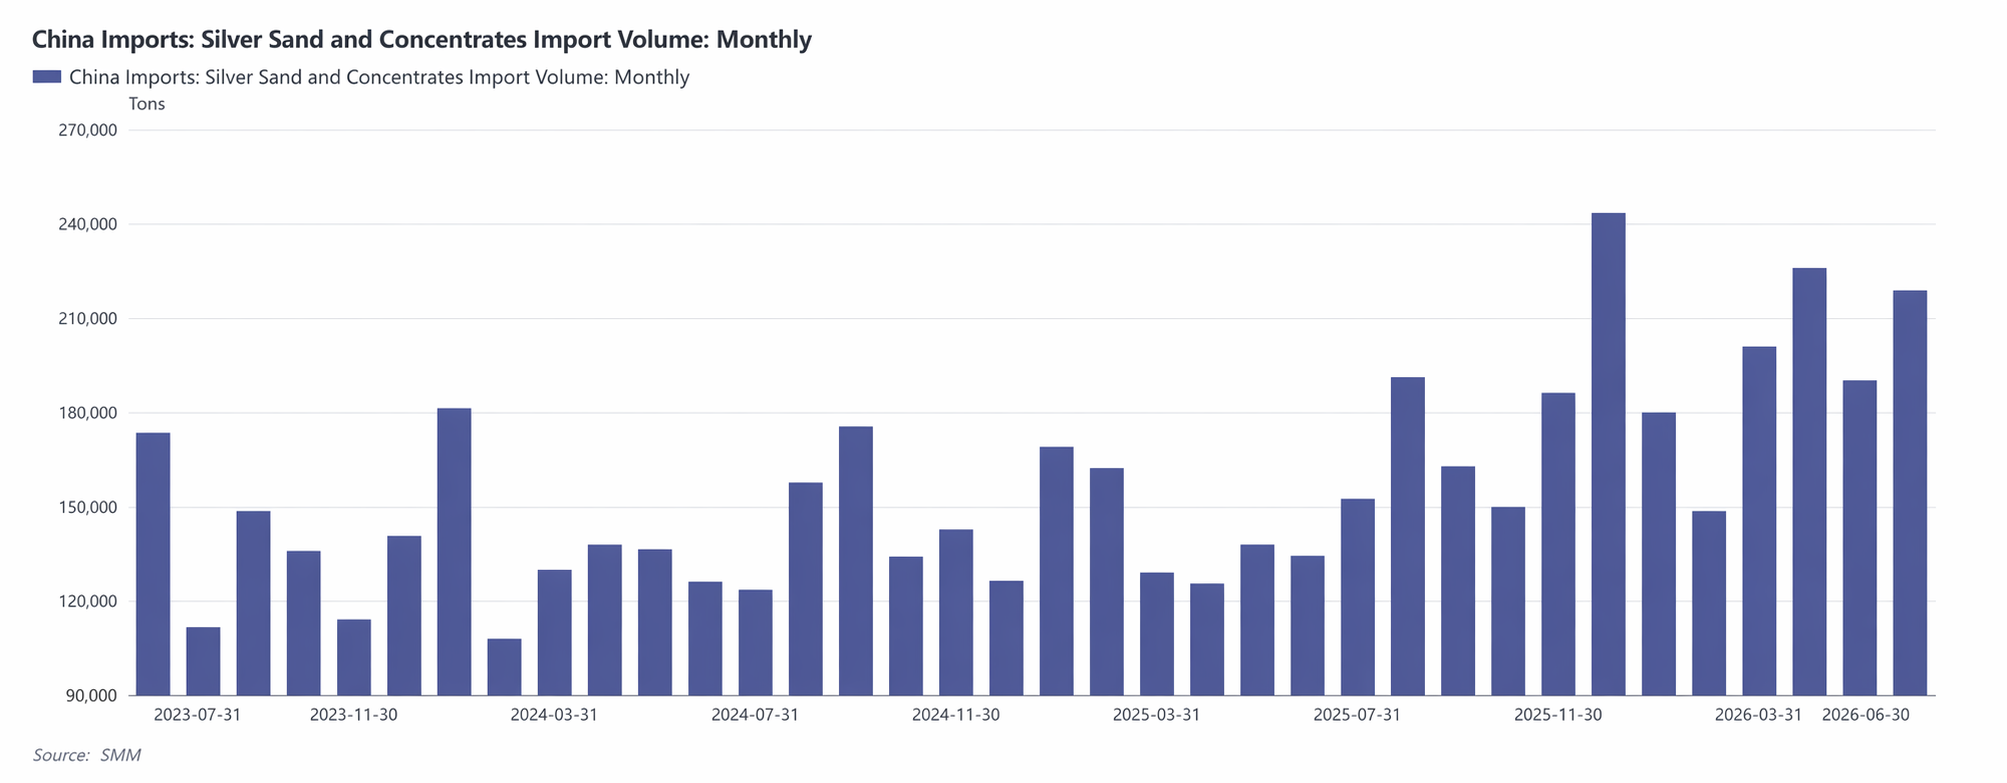
Additionally, strong silver prices in H1 changed the structure of imported ores, making high-silver associated lead concentrates the mainstream in purchases. According to customs data, January-June silver ore and concentrates imports totaled 1.164 million mt, up over 35% YoY, with smelter procurement preferences tilting significantly toward high-silver lead concentrates, as the core rationale is that silver by-products contribute major profits to smelting, indirectly offsetting the ore raw material shortfall.
In H2, the slowdown in global lead mine supply growth, Peru's energy constraints, expectations of winter stockpiling by domestic smelters, and silver price fluctuations will jointly dominate the import pace. Q3 imports are expected to pull back temporarily, while restocking in Q4 will drive a recovery in arrivals, with total annual imports in physical content edging up YoY.
Key risk variables for H2 (factors disrupting the pace of ore imports)
- Peru's energy policy enforcement: large-scale mine power rationing and shutdowns will cause overseas supply contraction in Q4, lowering total import estimates; if mining is exempted, shipments may exceed expectations and boost imports;
- wild swings in silver prices: a fall in silver prices will directly weaken purchase willingness for high-silver ores, leading to import TC recovery and simultaneous import contraction;
- scale of domestic smelter maintenance: concentrated and prolonged maintenance of primary lead smelters in Q3 will cause raw material procurement demand to plummet, with ports continuing to destock;
- global macro and overseas smelting demand: a recovery in battery consumption in Europe and the US will prompt overseas smelters to scramble for ores, diverting supplies from China; if overseas economies weaken, ore sources will concentrate in China;
- shipping and geopolitical logistics disruptions: rising freight rates on Red Sea and Pacific routes and customs clearance delays will squeeze import arbitrage margins, temporarily suppressing port arrivals.
Data Source Statement: All data other than publicly available information are based on public information, market communication, and SMM's internal database model, processed and derived by SMM, for reference only, and do not constitute decision-making advice.

![Review of Lead Concentrate Imports in H1 2026 and Outlook for H2 [SMM Analysis]](https://imgqn.smm.cn/usercenter/xVgcv20251217171721.jpg)