SMM ข่าววันที่ 21 เมษายน:
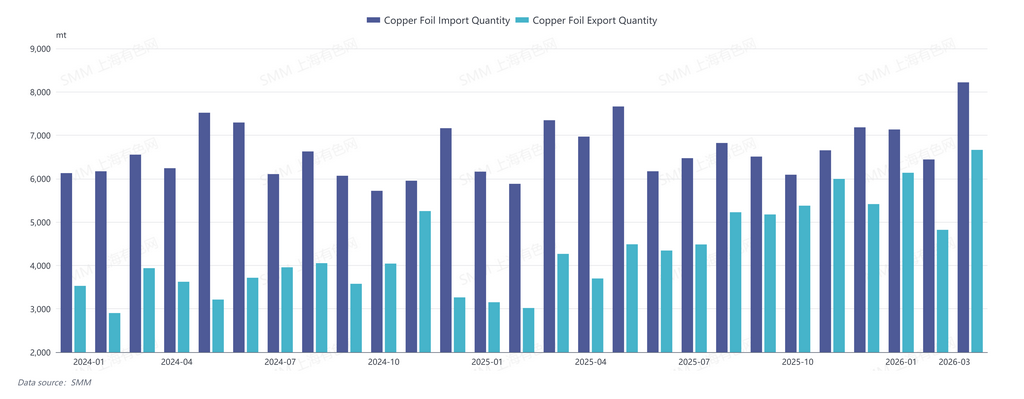
ตามข้อมูลจากกรมศุลกากรจีน การนำเข้าแผ่นทองแดง (รหัส HS: 74101100, 74102190) ของจีนในเดือนมีนาคม 2569 อยู่ที่ 8,220.04 ตัน เพิ่มขึ้น 11.88% เมื่อเทียบรายปี และเพิ่มขึ้น 27.59% เมื่อเทียบรายเดือน ยอดนำเข้าสะสมตั้งแต่เดือนมกราคมถึงมีนาคม 2569 อยู่ที่ 21,796.47 ตัน เพิ่มขึ้น 12.41% เมื่อเทียบรายปี
การส่งออกแผ่นทองแดงของจีนในเดือนมีนาคม 2569 อยู่ที่ 6,663.48 ตัน เพิ่มขึ้น 56.19% เมื่อเทียบรายปี และเพิ่มขึ้น 38.23% เมื่อเทียบรายเดือน ยอดส่งออกสะสมตั้งแต่เดือนมกราคมถึงมีนาคม 2569 อยู่ที่ 17,620.02 ตัน เพิ่มขึ้น 68.83% เมื่อเทียบรายปี
มูลค่านำเข้าแผ่นทองแดงของจีนในเดือนมีนาคม 2569 อยู่ที่ 180.604 ล้านดอลลาร์สหรัฐ เพิ่มขึ้น 48.68% เมื่อเทียบรายปี และเพิ่มขึ้น 35.88% เมื่อเทียบรายเดือน มูลค่านำเข้าสะสมตั้งแต่เดือนมกราคมถึงมีนาคม 2569 อยู่ที่ 448.0532 ล้านดอลลาร์สหรัฐ เพิ่มขึ้น 34.45% เมื่อเทียบรายปี
มูลค่าส่งออกแผ่นทองแดงของจีนในเดือนมีนาคม 2569 อยู่ที่ 116.1164 ล้านดอลลาร์สหรัฐ เพิ่มขึ้น 111.65% เมื่อเทียบรายปี และเพิ่มขึ้น 57.11% เมื่อเทียบรายเดือน มูลค่าส่งออกสะสมตั้งแต่เดือนมกราคมถึงมีนาคม 2569 อยู่ที่ 280.4233 ล้านดอลลาร์สหรัฐ เพิ่มขึ้น 112.34% เมื่อเทียบรายปี
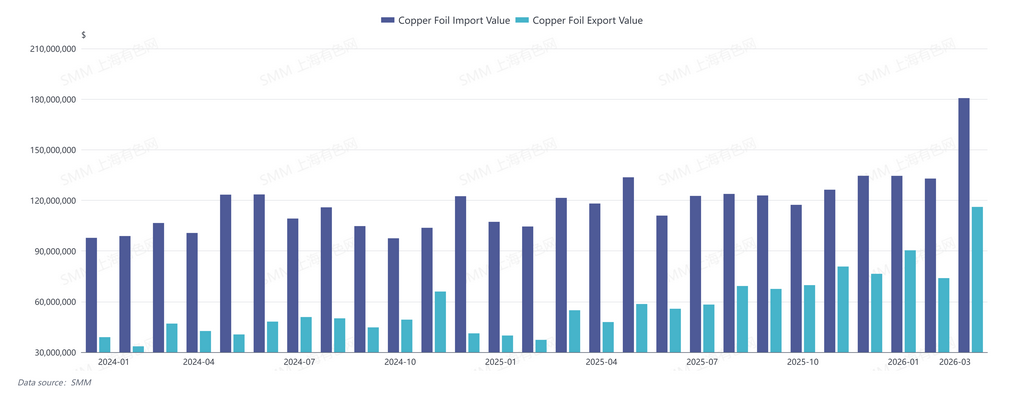
การขาดดุลการค้าแผ่นทองแดงของจีนในเดือนมีนาคม 2569 อยู่ที่ประมาณ 64.49 ล้านดอลลาร์สหรัฐ เพิ่มขึ้นประมาณ 5.48 ล้านดอลลาร์สหรัฐเมื่อเทียบรายเดือนจาก 59.01 ล้านดอลลาร์สหรัฐในเดือนกุมภาพันธ์ 2569
รูปแบบการค้า: การนำเข้าแผ่นทองแดงของจีนในเดือนมีนาคม 2569 ผ่านการค้าทั่วไปอยู่ที่ 5,755.06 ตัน การค้าแปรรูปจากวัสดุที่จัดหาให้ 400.21 ตัน การค้าแปรรูปจากวัสดุนำเข้า 875.7 ตัน และรูปแบบการค้าอื่นๆ 1,189.07 ตัน
การส่งออกแผ่นทองแดงของจีนในเดือนมีนาคม 2569 ผ่านการค้าทั่วไปอยู่ที่ 1,580.67 ตัน การค้าแปรรูปจากวัสดุที่จัดหาให้ 1,694.17 ตัน การค้าแปรรูปจากวัสดุนำเข้า 2,762.66 ตัน และรูปแบบการค้าอื่นๆ 625.98 ตัน
แยกตามประเทศ/ภูมิภาค แหล่งนำเข้าแผ่นทองแดงหลักของจีนในเดือนมีนาคม 2569 ได้แก่ ไต้หวัน (จีน) มาเลเซีย และลักเซมเบิร์ก โดยมีปริมาณนำเข้า 4,979.31 ตัน 1,197.24 ตัน และ 644.67 ตัน ตามลำดับ
ตลาดส่งออกแผ่นทองแดงหลักของจีนในเดือนมีนาคม 2569 ได้แก่ ไทย เกาหลีใต้ และมาเลเซีย โดยมีปริมาณส่งออก 1,839.95 ตัน 950.43 ตัน และ 674.27 ตัน ตามลำดับ
การนำเข้า CCL (รหัส HS: 74102110) ของจีนในเดือนมีนาคม 2569 อยู่ที่ 4,158.10 ตัน เพิ่มขึ้น 10.97% เมื่อเทียบรายปี และเพิ่มขึ้น 47.41% เมื่อเทียบรายเดือน ยอดนำเข้าสะสมตั้งแต่เดือนมกราคมถึงมีนาคม 2569 อยู่ที่ 10,571.28 ตัน เพิ่มขึ้น 7.86% เมื่อเทียบรายปี
การส่งออก CCL ของจีนในเดือนมีนาคม 2569 อยู่ที่ 7,902.45 ตัน ลดลง 5.92% เมื่อเทียบรายปี และเพิ่มขึ้น 17.43% เมื่อเทียบรายเดือน ยอดส่งออกสะสมตั้งแต่เดือนมกราคมถึงมีนาคม 2569 อยู่ที่ 23,371.86 ตัน เพิ่มขึ้น 10.94% เมื่อเทียบรายปี
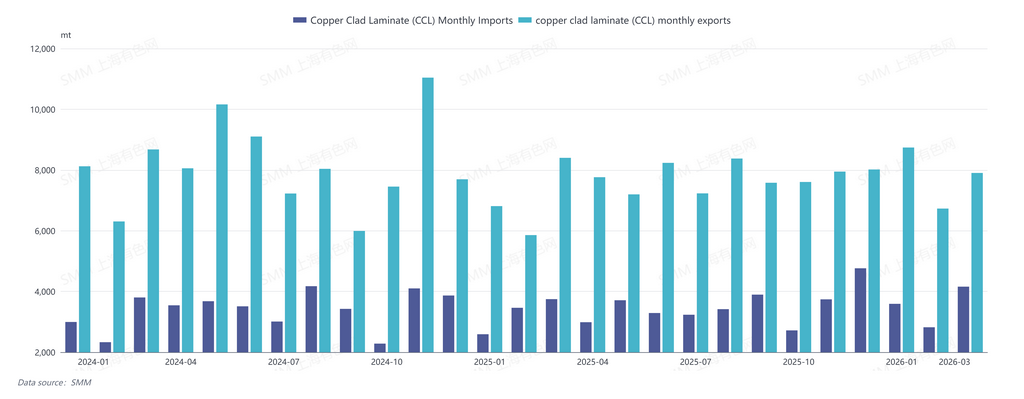
การนำเข้าและส่งออกแผ่นทองแดงของจีนในเดือนมีนาคม 2569 ต่างปรับตัวสูงขึ้นสู่ระดับสูง โดยการส่งออกทำสถิติสูงสุดรายเดือนใหม่ อุตสาหกรรมพลังงานใหม่และ AI ทั่วโลกมีความเฟื่องฟูสูง ประกอบกับอุปสงค์ที่แข็งแกร่งในช่วงฤดูกาลบริโภคสูงสุด ปัจจุบันผู้ผลิตแผ่นทองแดงของจีนกำลังปล่อยกำลังการผลิตและดำเนินงานในระดับการใช้กำลังการผลิตสูง แม้ว่าผลิตภัณฑ์ระดับไฮเอนด์ยังคงมีอุปทานไม่เพียงพอ แต่มูลค่าเพิ่มของผลิตภัณฑ์แผ่นทองแดงมีแนวโน้มเพิ่มขึ้นอย่างต่อเนื่อง และผู้ประกอบการกำลังเร่งส่งออกผลิตภัณฑ์และขยายตลาดนอกประเทศจีนอย่างแข็งขัน

![สต็อกทองแดงทางสังคมของจีนยังคงลดลงอย่างต่อเนื่อง แนวโน้มในแต่ละภูมิภาคแตกต่างกันอย่างมีนัยสำคัญ [SMM Weekly Data]](https://imgqn.smm.cn/usercenter/YIaMU20251217171711.jpg)