In the first half of 2026, the global sulfur industry chain experienced unprecedented volatility. From stable operation at the beginning of the year, to the price explosion triggered by geopolitical conflict in the Middle East in late February, to the sharp reversal following the US-Iran ceasefire in mid-June, the sulfur and sulfuric acid markets completed a full "surge—peak—correction" cycle. Domestic sulfur (SMM EXW Shandong Sulfur) rose approximately 157% in H1, while the SMM China Copper Smelting Acid Index gained roughly 94%. Internationally, SMM CIF Indonesia Sulfur surged over 126%, and SMM CFR Indonesia Sulphuric Acid climbed about 185%, with global sulfur markets simultaneously experiencing a "Fast & Furious" rally.
I. Event Background: The Strait of Hormuz Blockade Triggered a Global Sulfur Crisis
The extreme price action in the global sulfur industry chain in H1 2026 originated from a geopolitical shock that lasted over 100 days.
On February 28, the US-Iran conflict broke out, and the Strait of Hormuz – a critical waterway carrying approximately 45% of global seaborne sulfur trade – entered a de facto blockade. Shipping traffic through the strait plunged by 90%, severing the "Achilles' heel" of the global sulfur supply chain. The Middle East accounts for roughly 25% of global sulfur production and 45% of global seaborne sulfur trade.
During the blockade, an estimated 800,000 to 1 million metric tons of sulfur cargoes accumulated in the Persian Gulf. Over the three-and-a-half-month war period, total sulfur shipments amounted to only 80,000 metric tons.
On June 17, the US and Iran remotely signed a Memorandum of Understanding, effective immediately; June 19 marked the formal signing of the agreement. Under the terms, the Strait of Hormuz is set to fully reopen within 30 days, with the US lifting its maritime blockade. Since the ceasefire announcement on June 15, approximately 640,000 metric tons of sulfur have departed the strait – compared to just 80,000 metric tons shipped during the entire three-and-a-half-month war. On June 23, Iran officially confirmed that the Strait of Hormuz was fully open to global commercial shipping for a 60-day period, with no transit fees charged during this window.
The easing of supply concerns triggered an immediate panic sell-off. Zhenjiang Port granular sulfur fell from 11,750 yuan/mt on June 11 to 9,200 yuan/mt by June 24. The evacuation of previously stranded cargoes from the Persian Gulf, combined with phased restarts of damaged oil and gas facilities in the Middle East, opened a window for partial supply recovery.
However, a full recovery will take time. Even under the best-case scenario, significant improvements in shipping volumes are unlikely before August. Most cargoes currently moving correspond to old sales contracts, with no empty vessels yet returning to load new cargoes. An estimated 300,000-400,000 metric tons of sulfur remain stranded in the strait. Damaged gas fields and refineries in Qatar and the UAE may keep their medium-term exports below pre-war levels.
II. Global Sulfur/Sulfuric Acid Supply Disruptions: Three-Layered Squeeze, Widening Deficit
Approximately 98% of global sulfur is produced as a byproduct of oil refining and natural gas desulfurization, making supply highly inelastic and unable to flexibly adjust output like primary products. The Middle East accounts for about 25% of global sulfur production and 45% of seaborne sulfur trade. The Strait of Hormuz blockade directly cut off nearly half of global seaborne trade, exposing the structural vulnerability of the global sulfur supply chain's over-reliance on a single producing region and a single maritime chokepoint.
The essence of this supply crunch is a "three-layered squeeze": Layer 1: Physical cutoff – the Hormuz blockade severed Middle Eastern supply, halting nearly half of global seaborne trade. Layer 2: Policy lockdown – overlapping export bans from Russia, Kazakhstan, and Turkey blocked alternative supply sources, further tightening global tradable volumes. Layer 3: Capacity and inventory collapse – war-damaged Middle Eastern production facilities are slow to restart, and global port inventories have fallen to decade-low levels, eliminating any buffer. These three constraints occurred simultaneously and reinforced each other, tightening supply from all directions – and this is the core driver of the current market.
(1) Middle Eastern Supply Cutoff and Global Trade Flow Restructuring
During the blockade, Middle Eastern sulfur exports nearly came to a halt. In 2025, China sourced 56.2% of its sulfur imports from the Middle East, with overall sulfur import dependency exceeding 50%. The blockade sharply reduced import volumes and widened the supply gap.
The blockade drove up official selling prices from Middle Eastern suppliers: ADNOC (UAE) raised its June OSP to $860/mt FOB, with Qatar's QSP and Kuwait's KSP both rising to $805/mt FOB in June. In July, ADNOC further increased its OSP to $1,000/mt FOB (+16.3% month-on-month), while Qatar's QSP also rose to $890/mt FOB. All surpassed their 2008 peaks.
Even after the Strait of Hormuz reopened, the pace of supply recovery remains far slower than expected.
(2) Russia Extends Export Ban, Kazakhstan Follows Suit
Russia: On June 25, 2026, the Russian government officially signed a decree extending the temporary ban on industrial sulfur exports through December 31, 2026. First implemented on November 1, 2025, the ban has been extended multiple times. Gazprom's Astrakhan gas field (4.8 million mt/yr sulfur capacity) is operating only one production line, while the Orenburg facility (1.55 million mt/yr) was damaged by conflict on June 24, sharply reducing domestic sulfur output.
Kazakhstan: On June 26, the Ministry of Energy of Kazakhstan issued Order No. 1363, imposing a complete halt on sulfur exports from June 27 until further notice, with exemptions only for shipments to Russia. Kazakhstan exported approximately 4.6 million mt of sulfur in 2025, with the ban directly impacting core buyers such as Morocco. OCP imports about 2.5 million mt of Kazakh sulfur annually, accounting for nearly 44% of its total imports – making the impact particularly acute.
Turkey: Implemented a sulfur export ban on April 7, lasting through the end of Q3.
(3) Canada: A Key Substitute Supplier with Surging Volumes and Prices
Against the backdrop of the Hormuz blockade and restricted Russian/Kazakh exports, Canada emerged as a critical swing supplier in the global sulfur market. Export data clearly reflects this structural shift:
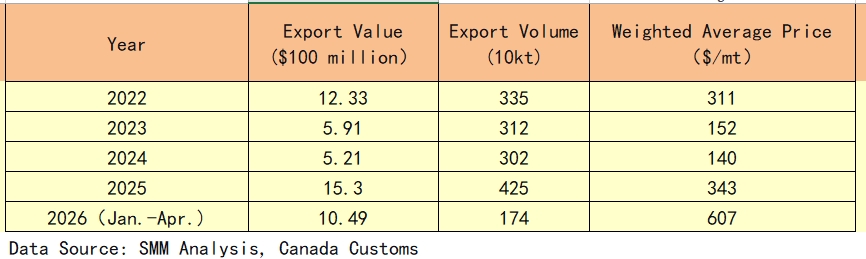
In 2025, Canadian sulfur exports saw both volume and value surge, with tonnage up 40.7% year-on-year to 4.25 million mt and export value reaching a record high of $1.530 billion. In the first four months of 2026, export value already reached $1.049 billion, with annualized volume of approximately 5.22 million mt – poised to set new records for the full year.
Exports are highly concentrated in Alberta and British Columbia, which together account for over 95% of national sulfur exports. FOB Vancouver prices surged from around $500/mt in January 2026 to $825-950/mt by April, gaining over 80%.
(4) China's Import Cliff and Decade-Low Inventory
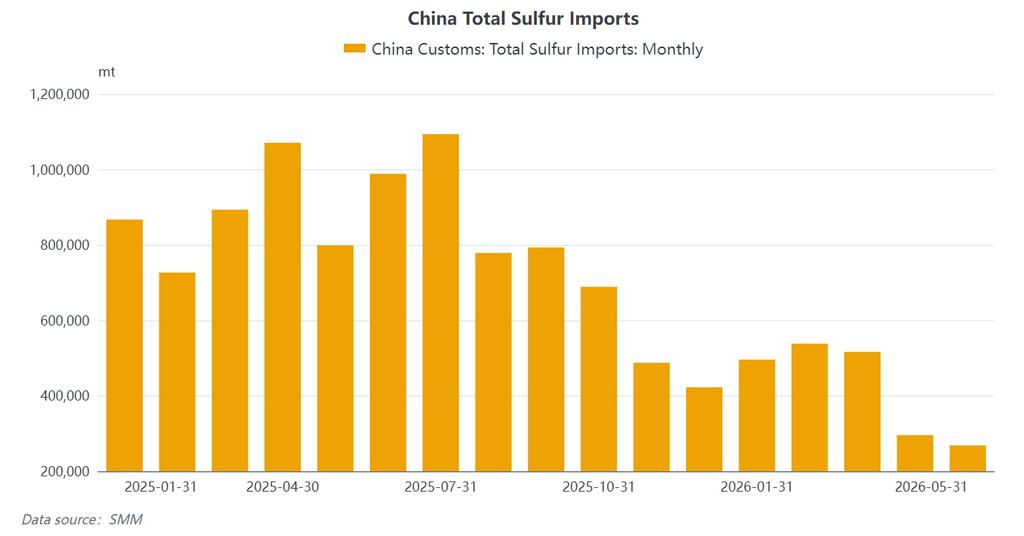
The import shock was most direct. In May 2026, China's sulfur imports fell to 268,300 mt, down 66.41% year-on-year. Cumulative imports from January to May reached 2.1154 million mt, down 51.44% compared to the same period in 2025 – a near-halving of import volume. Imports in May were only 268,380 mt, marking the second-lowest monthly imports in nearly 20 years. The average import price surged to $798.96/mt.
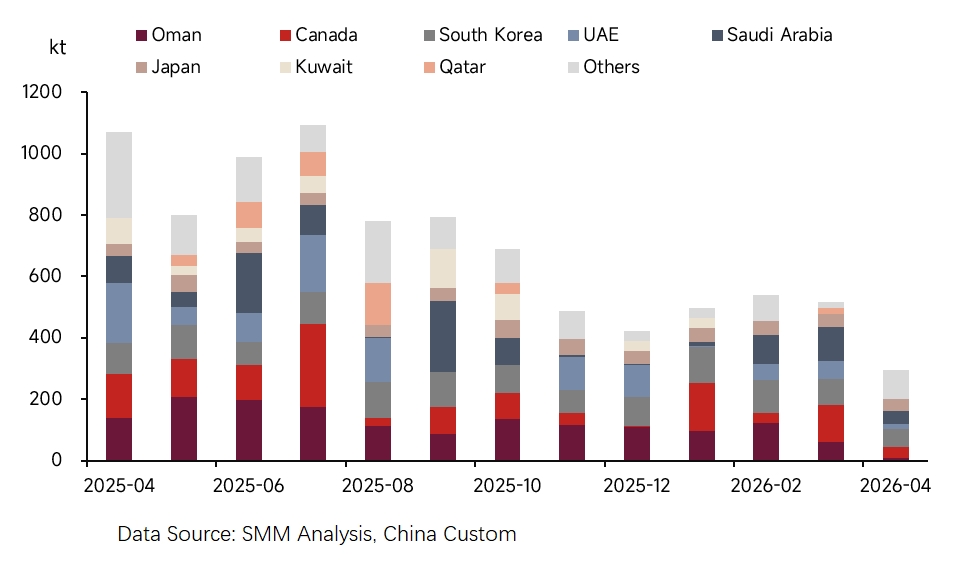
Import source structure drastically changed: Middle East share halved. China's sulfur import sources underwent a fundamental restructuring in January-May. The combined share of the traditional Middle Eastern four (Saudi Arabia, UAE, Qatar, Kuwait) plummeted from over 40% in the same period of 2025 to below 20%.
Alternative sources diversified: Oman jumped to first place with 541,000 mt (20.1%), followed by South Korea (485,000 mt, 18.0%), Japan (316,000 mt, 11.8%), and Canada (286,000 mt, 10.6%) as key supplementary suppliers. In April, Iran shipped 62,400 mt in a single month – the first large-scale direct arrivals since the conflict began, indicating that some cargoes had already transited the strait. In May, the top three sources – Oman, South Korea, and Japan – accounted for a combined 86.8% of imports, suggesting that replacement supply remains insufficient.
Port inventories collapsed in tandem. On June 23, China's total sulfur port inventory fell to 748,800 mt, the lowest level since July 2017. By July 3, port inventories stood at 727,900 mt, down 68.81% year-on-year. Based on May inventory levels, sulfur stocks could be fully depleted by August.
(5) Indonesia: Demand-Driven Growth, Middle East Still Key but Supply Landscape Shifting
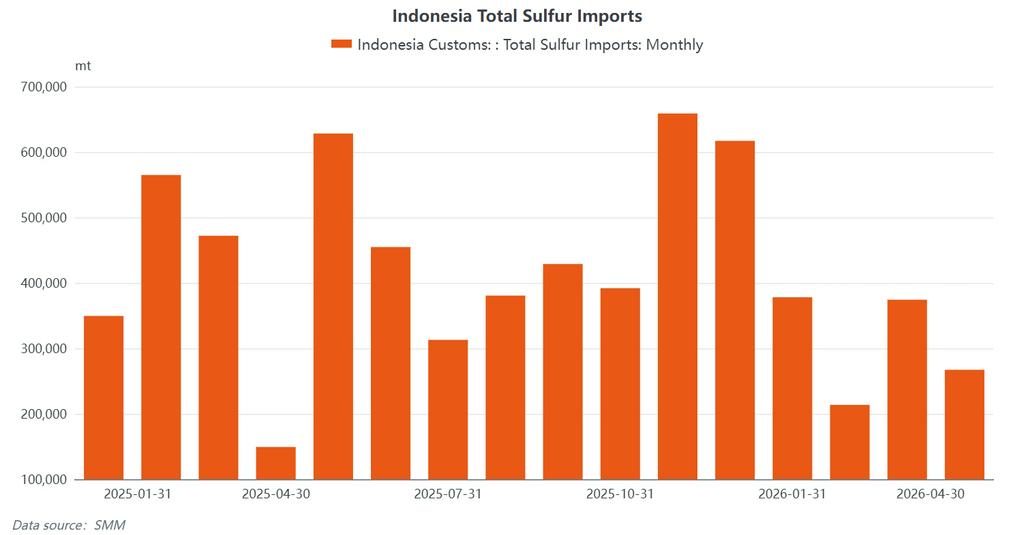
From January to April 2026, Indonesia imported approximately 1.23 million mt of sulfur. May imports are estimated to exceed 350,000 mt, reflecting HPAL plants' continued rigid demand despite high sulfur prices.
The Middle Eastern four (Oman, Saudi Arabia, UAE, Qatar) remain core suppliers, though their combined share has declined significantly from pre-conflict levels of over 70%. Imports are heavily concentrated in Weda Bay, OBI Island, and Morowali – key ports serving HPAL plants operated by Tsingshan, Huayou, and Lygend.
Sulfuric acid imports have also grown in tandem. Indonesia imported approximately 449,000 mt of sulfuric acid in January-May, up sharply year-on-year, reflecting HPAL producers turning to sulfuric acid as a substitute amid tight sulfur supply. Key sources were South Korea and Japan, consistent with the Asia-Pacific sulfuric acid trade flows tracked by SMM CFR Indonesia Sulphuric Acid.
Indonesia depends on imports for approximately 75%-80% of its sulfur requirements. Sulfur is a core input for HPAL nickel production, with consumption of 10-12 mt of sulfur per mt of MHP. HPAL plants typically maintain only 1-2 months of sulfur inventory cover.
(6) Sulfuric Acid Supply: Maintenance and Passive Curtailment
Sulfuric acid supply faced dual pressure from maintenance shutdowns and passive production cuts. In H1 2026, sulfur-burning acid producers continued to suffer deep losses – with high feedstock costs and reference prices unable to cover production costs, losses generally exceeding RMB 350/mt. In June, dual supply contraction – from both smelter acid maintenance and sulfur-burning acid cost inversion – pushed the industry's operating rate to approximately 60%. Multiple units in central and east China remained in maintenance, keeping spot supply tight and inventories low.
III. Global Sulfur/Sulfuric Acid Demand Disruption: High-Price Suppression and Structural Divergence
(1) Fertilizer Sector: Policy Support vs. Profit Collapse
The phosphate fertilizer industry faced a dual squeeze of "rigid demand" and "profit collapse." Sulfur's share of total phosphate fertilizer production costs surged from the normal 30-35% to over 130%, pushing the industry into deep losses. In H1, monoammonium phosphate (MAP) operating rates fell to around 40%, while diammonium phosphate (DAP) dropped to about 30%.
China's phosphate fertilizer exports remained restricted under the government's supply assurance policy, with domestic consumption sustained but profits fully eroded by feedstock costs.
(2) Chemical Sector: Transmission Blocked, Operating Rates Weakening
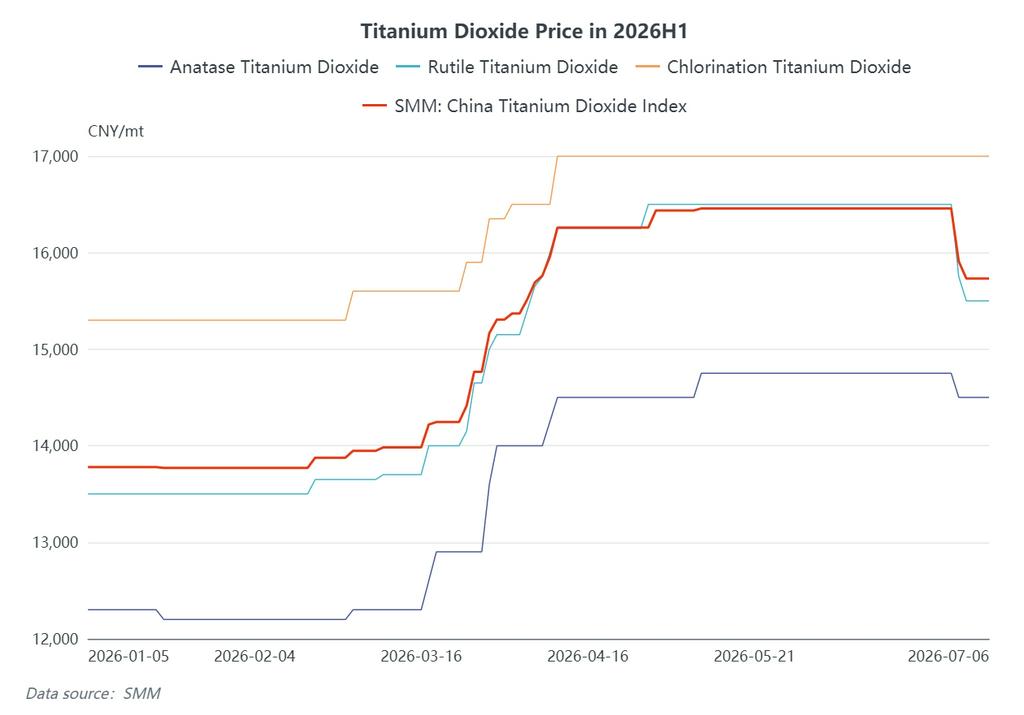
The titanium dioxide industry experienced multiple rounds of price increases driven by cost pressure. The SMM China Titanium Dioxide Index rose from approximately 13,778 yuan/mt at the start of the year, climbing above 15,000 yuan/mt by mid-to-late March, and peaked around 16,457 yuan/mt in mid-to-late June. Among them, rutile-type titanium dioxide prices rose from around 13,500 yuan/mt at the start of the year to approximately 15,500-16,500 yuan/mt in June, marking significant gains. However, downstream demand remained weak, and titanium dioxide operating rates continued to fall, limiting cost pass-through.
(3) New Energy Sector: A Bright Spot but Limited in Scale
Lithium iron phosphate (LFP) remained one of the few areas of relatively stable demand, though its scale is insufficient to offset the collapse in traditional demand. It is estimated that new LFP capacity additions in 2025-2026 correspond to over 3.3 million mt of incremental sulfur demand annually – a long-term demand driver that cannot be overlooked.
(4) Indonesian HPAL Nickel: The Most Direct Cost Impact
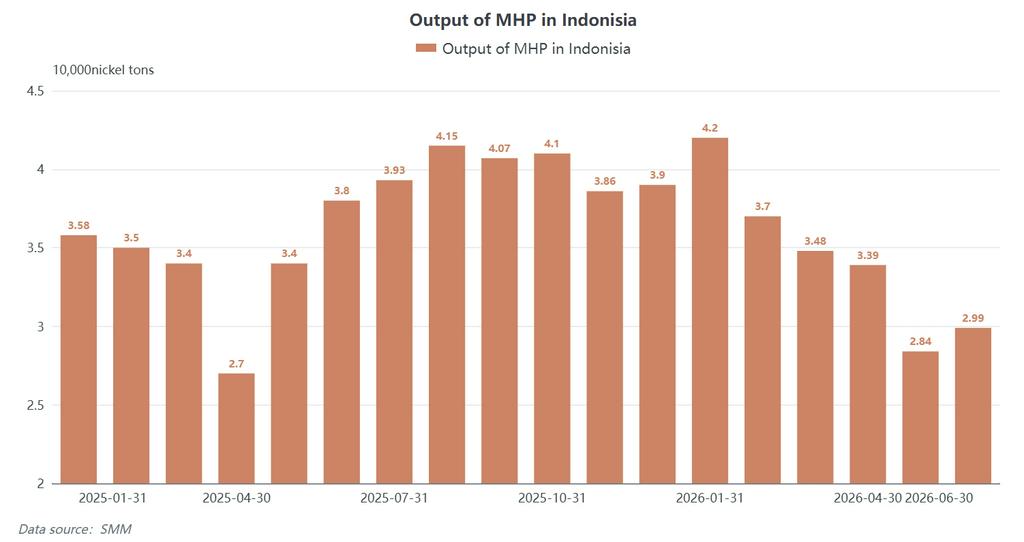
The Indonesian HPAL nickel sector is a key source of new sulfur demand. SMM CIF Indonesia Sulfur held steady at $1,250-1,300/mt in the first half of June. Each metric ton of MHP production consumes 10-12 mt of sulfur, significantly raising hydrometallurgical marginal costs. In June 2026, Indonesia's MHP production was approximately 29,900 Nickel mt, down notably from the January peak of 42,000 mt, reflecting the ongoing production suppression effect of high sulfur prices.
(5) Overall Demand Assessment
Demand destruction has spread from the fertilizer sector to chemicals and nickel smelting. However, the magnitude of supply contraction still far exceeds demand erosion, and in the short term, demand is unlikely to become the primary driver of price declines.
IV. Price Review: A Complete Surge–Peak–Correction Cycle
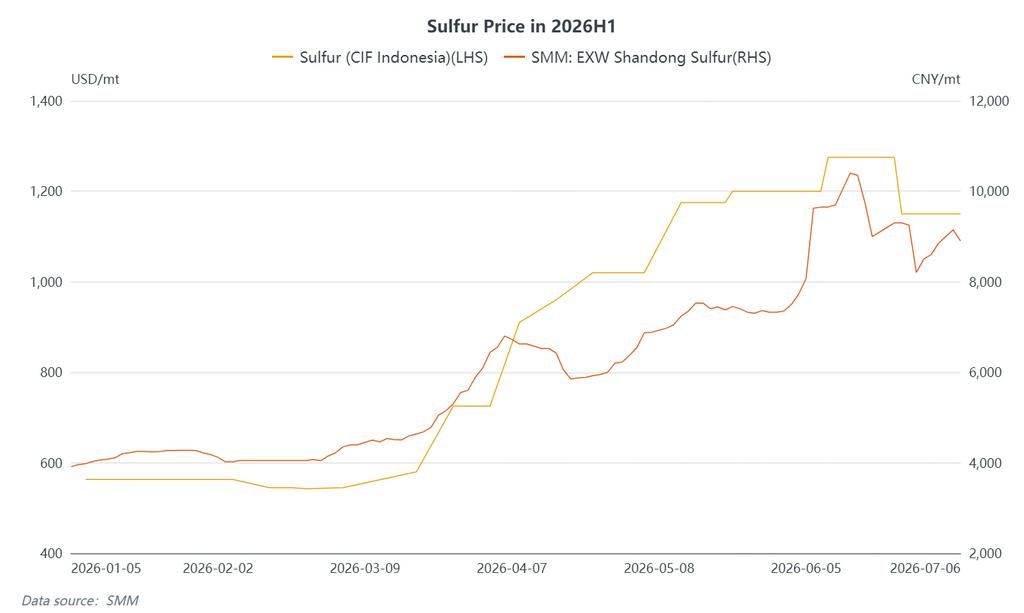
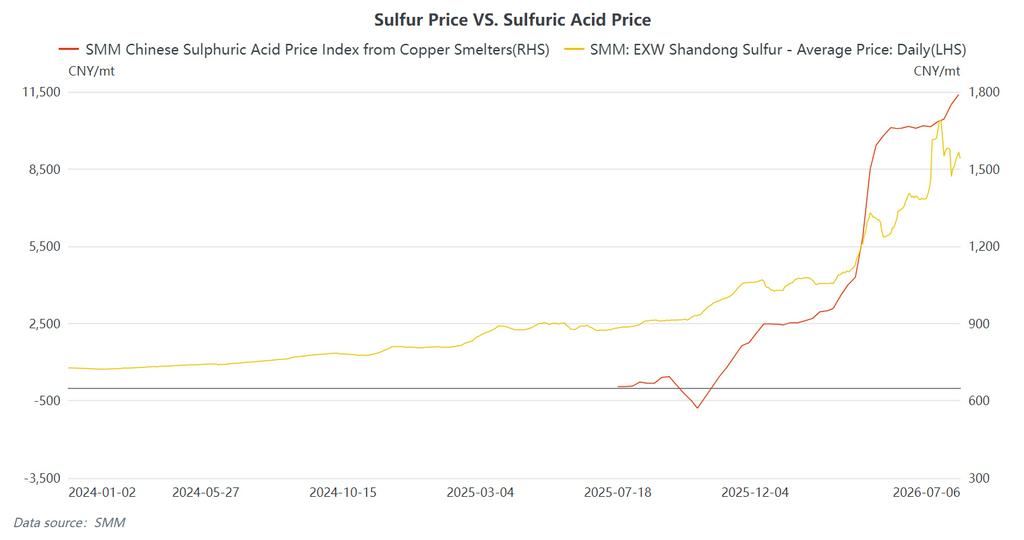
Sulfur (Domestic): SMM EXW Shandong Sulfur started the year around 3,910 yuan/mt. Prices rallied rapidly after the conflict broke out in late February, reaching 4,150 yuan/mt in early March, breaking 6,500 yuan/mt in early April, hitting 8,075 yuan/mt on June 5, and peaking at 10,053.5 yuan/mt on June 12 – a cumulative gain of approximately 157% from the start of the year. The ceasefire news in mid-June reversed market sentiment, triggering a rapid correction. On June 26, SMM EXW Shandong Sulfur was quoted at 7,800-8,607 yuan/mt, down nearly 3,000 yuan/mt from the peak. By July 3, prices had rebounded to 9,000-9,300 yuan/mt.
Sulfur (International): SMM CIF Indonesia Sulfur started the year around $563/mt, hit $1,250-1,300/mt on June 10, and corrected to $1,100-1,200/mt from June 25 onward – a gain of over 126% in H1.
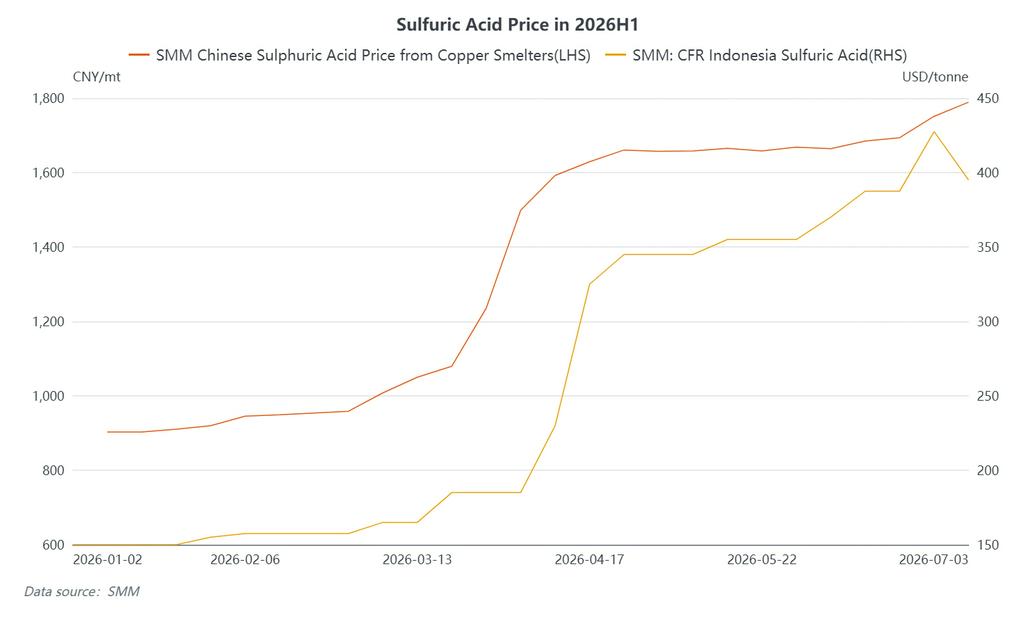
Sulfuric Acid (Domestic): The SMM China Copper Smelting Acid Index climbed from 903 yuan/mt in mid-January to a peak of 1,751 yuan/mt on June 26 – a gain of approximately 94% in H1, with a spread of 848 yuan/mt. The June average for the SMM China Copper Smelting Acid Index stood at 1,698.25 yuan/mt, up 36 yuan/mt from May's 1,662.25 yuan/mt.
Sulfuric Acid (International): SMM CFR Indonesia Sulphuric Acid started the year around $150/mt and reached $410-445/mt (avg. $427.5/mt) on June 26 – a gain of approximately 185% in H1. **SMM FOB Korea Sulfuric Acid** was quoted at $370-385/mt on June 26.
First divergence in June: After the US-Iran agreement was signed, sulfur prices fell sharply, but sulfuric acid prices did not follow suit – the first clear divergence between the two in 2026. This was mainly due to tightened spot supply from concentrated smelter acid maintenance in the first half.
V. Outlook: High-Level Consolidation with Wide Swings, Four Key Variables to Watch
- Sulfur: The market remains caught in a tug-of-war between "strong fundamentals (shortage)" and "weak expectations (arrivals + poor demand)." Low inventories and cost support persist in the near term – China's port sulfur inventory stood at just 790,000 mt in early July, down over 1.57 million mt year-on-year, a decline of more than 66%. However, the 800,000-1,000,000 mt of stranded Persian Gulf cargoes is expected to arrive in late July, representing the biggest bearish factor. Supply constraints – including Russia's extended export ban through year-end and the 6-month timeline for Middle Eastern facility restoration – will continue to limit downside. Sulfur prices are expected to trade in a wide high-level range in H2.
- Sulfuric Acid: Cost support remains intact, though supply-demand dynamics are expected to tighten further. Prices may hold firm in late June to early July, with a potential downward bias later in the month. High sulfur costs provide support, but downstream phosphate and titanium dioxide sectors are increasingly resistant to high prices, with procurement slowing and traders turning cautious – suggesting growing downside risks.
Four Key Variables to Watch:
- The pace of Strait of Hormuz reopening and Middle Eastern production recovery: Strait reopening is not an "instant fix." Mine clearance, backlog clearance, and shipping confidence rebuilding take time. Qatar and the UAE's war-damaged gas fields and refineries may keep medium-term exports below pre-war levels, with significant shipping recovery unlikely before August.
- Indonesian HPAL plants' procurement pace and inventory levels: Indonesia depends on imports for 75%-80% of its sulfur, with HPAL plants holding only 1-2 months of inventory. SMM CIF Indonesia Sulfur directly impacts MHP production costs and thus Indonesian nickel HPAL utilization. MHP output has already fallen from January's peak of 42,000 mt to 29,900 mt in June – and could face further pressure if sulfur prices remain elevated.
- Morocco's OCP and African Copperbelt demand release: African Copperbelt sulfur DAP/DDP prices remain elevated. OCP's procurement strategy at these high price levels will directly impact North African demand dynamics.
- China's autumn fertilizer restocking and sulfuric acid export policy: If autumn fertilizer restocking (July-September) proceeds as scheduled, it could support phosphate operating rates. Any adjustments to China's sulfuric acid export ban will influence global acid trade flows and regional price spreads.
![[Lithium Battery: Brunp Recycling Wins 2026 European Inventor Award]](https://imgqn.smm.cn/usercenter/EPIrk20251217171726.jpg)
![[Lithium Battery: Tinci Materials Shifts 400 Million Yuan In Fundraising To Electrolyte Project]](https://imgqn.smm.cn/usercenter/Bwmed20251217171726.jpg)