SMM June 14, 2010 News:
New energy data in May released this week, the development of the new energy vehicle industry in line with expectations, affected by the decline of subsidies, the year-on-year growth rate has slowed. At the same time, SMM power battery installation data show that the total installed capacity of power batteries in May was 5.68GWh, a slight increase of 4.94% from the previous month and an increase of 22.3% from the same period last year. Among them, the installed capacity of ternary battery is 3.75GWh, accounting for 66.1%, and the installed capacity of lithium iron phosphate battery is 1.73GWh, accounting for 30.5%.
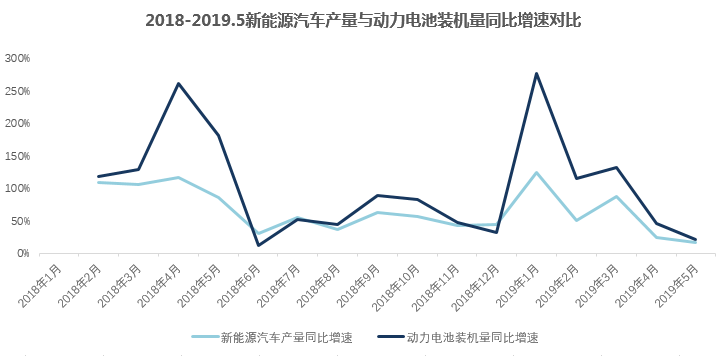
Whether it is the production and sales of new energy vehicles or the installation of power batteries, the year-on-year growth rate has been declining since January this year. On the one hand, it reflects that the demand of the new energy industry has been released ahead of schedule; on the other hand, the phased pain of subsidy retreat is still there. How to effectively balance between alleviating the pressure of cash flow and promoting technology research and development is an urgent problem for power battery enterprises this year.
In May, the production of new energy vehicles was 112000, up 10.4 percent from the previous month, up 16.9 percent from the same period last year, and sales reached 104000 vehicles, up 7.9 percent from the previous month, up only 1.8 percent from the same period last year. Although production and sales of new energy vehicles are still growing, it is already the slowest year-on-year growth rate since 2018.
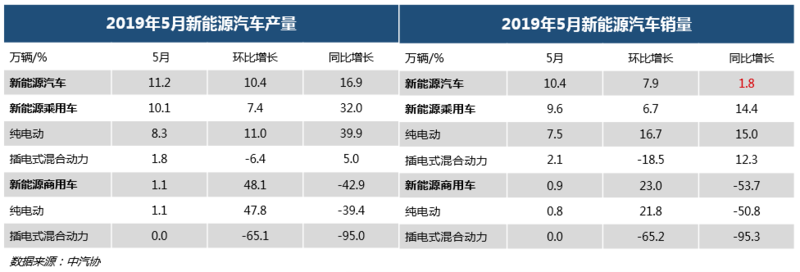
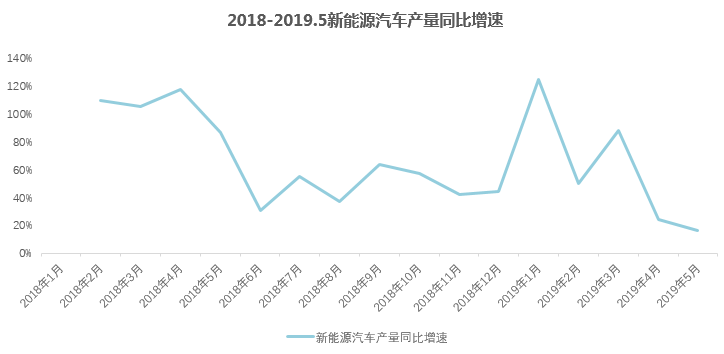
SMM believes that there are two main factors for the change in the production and sales of new energy vehicles in May. On the one hand, because the industry is pessimistic about the decline of the subsidy policy in 2019 since last year, and the industry expects the new energy subsidy policy to be released at the beginning of the year, so the "rush to install" behavior of car companies also began to appear at the end of last year, and demand has been released ahead of time. On the other hand, the implementation of the "National six" is coming soon, and a large number of "National five" models have been promoted in the near future, which has also led to the transfer of the consumption willingness of some consumers and increased the shipping pressure of new energy vehicles.
The transition period for new energy subsidies is coming to an end, in addition, the third quarter is usually the off-season of the industry, given that the current mainframe and battery plants are in the process of reshuffling, the strategic directions will be quite different this year. We expect downstream demand for new energy to remain weak in the third quarter, focusing on the implementation of the follow-up double points policy.
According to the SMM new energy database, in May 2019, China's power batteries installed a total of 5.68GWh, a slight increase of 4.94% over the previous month and an increase of 22.3% over the same period last year. In line with the growth rate of new energy vehicles, the year-on-year growth rate of power battery installations also fell to the lowest since 2018 (the slowest year-on-year growth rate in June 2018).
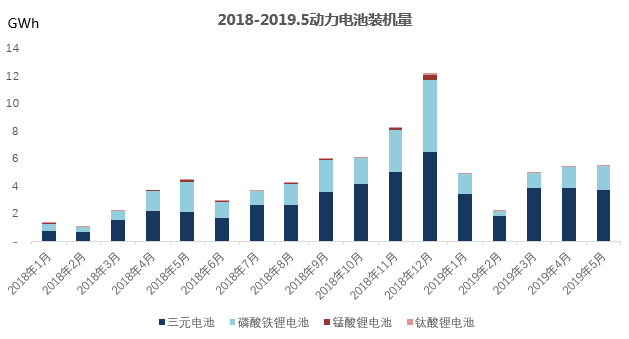
In May, the installed capacity of ternary battery was 3.75GWh, accounting for 66.1%, which decreased by 6.7%, and that of lithium iron phosphate battery was 1.73GWh. accounted for 30.5%, increased by 3.2% compared with the previous month.
The recovery of the installed capacity of lithium iron phosphate battery is mainly affected by the rush installation in the bus market. In 2018, the proportion of ternary batteries and lithium iron phosphate fluctuated around 6:4 in the new energy vehicle industry. Among them, the installed capacity of lithium iron phosphate batteries exceeded that of ternary batteries for the first time in May 2018. In addition, the installed capacity of lithium iron phosphate batteries increased significantly in December 2018. Looking at the month of the sharp increase in the installed capacity of lithium iron phosphate batteries, we found that the installed capacity of EV buses increased significantly in that month, and the time was generally at the end of the year and on the eve of the subsidy. The amount of bicycle subsidy for EV buses is usually about twice that of passenger cars, which makes "rush loading" before the end of the transition period more important to the bus market.
It is worth noting that the installed capacity of composite lithium battery has increased gradually since 2019. The installed capacity of composite lithium battery in May was 64.4MWh. According to SMM, Ningde era has begun to develop composite lithium-ion batteries, by doping part of the lithium manganate in the ternary battery to achieve the purpose of reducing costs and improving safety performance, and may realize the mass production and installation of this type of battery in the second half of this year.
Let's take a look at the market share of power batteries in May.
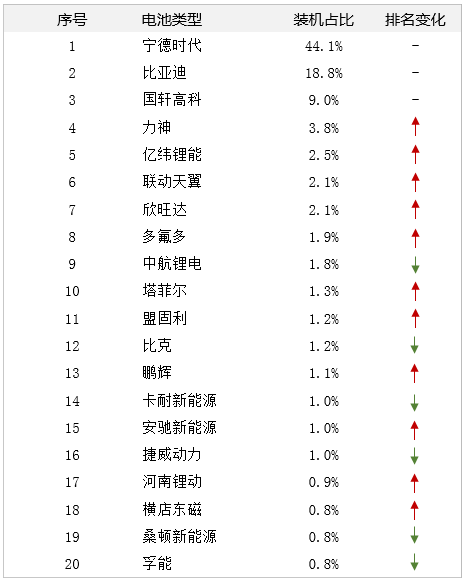
With the exception of TOP3's power battery companies, the ranking of power battery companies changed in May. This also shows that at present, all enterprises are undergoing transformation and change, and it is not easy to get a solid place in the power battery market.
Although BYD was still second in the ranking of power battery installations in May, its market share actually fell 10.5% from a month earlier. Although BYD is currently the industry chain integrity of a relatively high degree of enterprise, but because the downstream customer share is still concentrated in the group itself, affected by the group car production and sales volume, the future can continue to expand downstream customers.
According to SMM statistics, China's ternary material production in May 2019 was 20500 tons, down 5 per cent from the previous month and up 64 per cent from the same period last year. At the end of the subsidized transition period and safety concerns, manufacturers in Beijing, Zhejiang, Jiangsu and Hunan reduced their orders and reduced production to varying degrees in May. Reducers say signs of a pick-up in demand are unclear.
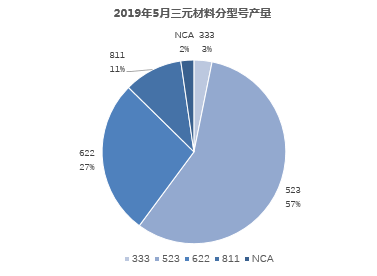
It is worth noting that in high nickel, the proportion of 8-series products rose to 11%. The positive material factory said that it was the demand raised by the leading battery factory for the preparation of products after the Spring Festival next year, and the demand for 8-series products is expected to grow slowly in the future.
In May 2019, the national production of lithium iron phosphate was 8400 tons, down 0.1 per cent from the previous month and up 78.9 per cent from the same period last year. At present, the industry concentration of lithium iron phosphate tends to be stable, and the main demand is still power batteries, but a considerable part of the production capacity has been used in the field of energy storage batteries and consumer batteries.
In May 2019, the national production of lithium manganate was 5400 tons, up 0.1 per cent from the previous month and 16.7 per cent from the same period last year. Due to the low energy density and cheap price, the demand structure of lithium manganate in 2018 is mainly consumer batteries. We expect that with the maturity of doping technology in the future, superimposed enterprise cost reduction pressure, the demand structure of lithium manganate can be further optimized in the future, and the demand for high-end lithium manganate may increase.
SMM Cobalt Lithium Research team
Hu Yan 021 51666809
Hong Lu 021 51666814
Ning Ziwei 021 51666780
Qin Jingjing 021 51666828
![[Импорт сподумена в Китай в августе 2026 года вырос на 22,6% м/м до рекордного уровня (~76 тыс. т LCE)]](https://imgqn.smm.cn/usercenter/oVqJl20251217171730.jpg)