If CBAM in 2023–2025 merely asked importers to file numbers, the definitive regime that began on 1 January 2026 makes them pay, for the first time, for the carbon embedded in imported steel. Its skeleton is a set of implementing regulations — but what really sets the bill is the country default value, which pulls the "same goods, different origin" carbon cost apart by an order of magnitude. This piece uses the main traded steels — HRC, CRC, coated sheet, billet, rebar and wire rod — as its sample, walks through the new rules, and draws a cost map across twelve origins.
Policy anchor: five core regulations and the compliance timeline
The definitive phase is not one law but a rule system that landed in late 2025 and is being calibrated through 2026. Sorting out these regulations is how you sort out where the cost comes from:
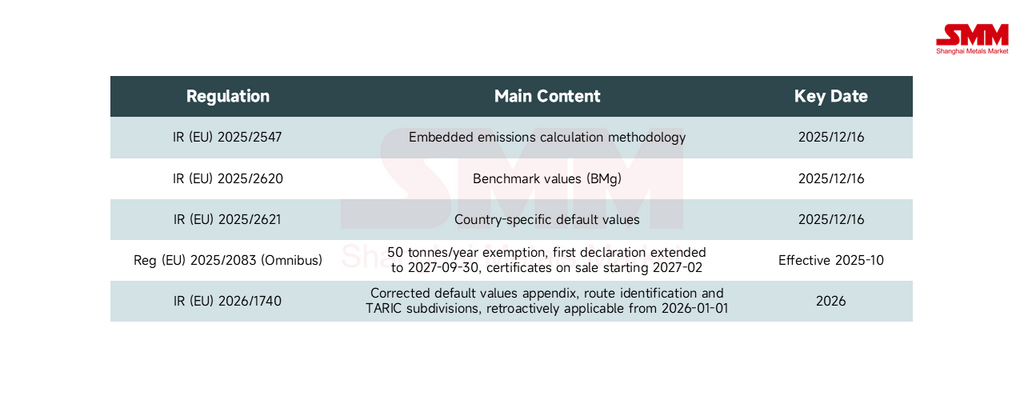
The timetable is equally clear. Certificates go on sale from 1 February 2027; importers must file their first CBAM declaration by 30 September 2027 (covering emissions embedded in 2026 imports) and surrender certificates; only an authorised CBAM declarant may import covered goods. The Omnibus package also sets a de minimis threshold of 50 tonnes per year — on the Commission's reckoning, exempting roughly 90% of importers while still covering about 99% of embedded emissions. In short: no meaningful tonnage escapes.
Pricing hub: how the certificate price transmits from the EU ETS
The certificate price is not set administratively; it is pegged to the EU Emissions Trading System (ETS) as the weighted average of that quarter's auction clearing prices. The first two are published — Q1 2026 at 75.36 EUR per tonne of CO₂-equivalent (about 87.04 USD/tonne, published 7 April) and Q2 2026 at 75.28 EUR/tonne (about 86.95 USD/tonne, published 6 July), down 0.08 EUR quarter on quarter. The Q3 price is due 5 October. From 2027, publication moves from quarterly to weekly, so price moves will feed through more immediately.
A carbon price near 75 EUR/tonne looks modest — but multiply it by steel's embedded emissions and the per-tonne cost swells fast. The very stability of the price throws the other variable into sharp relief: the country default value.
The core variable: default emission intensity opens the cost gulf
In the definitive phase, an importer that cannot provide verified actual emissions must use the EU's country default values, plus a mark-up on top: for iron and steel, +10% in 2026, +20% in 2027, capped at +30% from 2028. Default values are set per country and per product. For carbon-steel HRC (HS 7208), the default direct intensity (tCO₂e/tonne) by origin is:
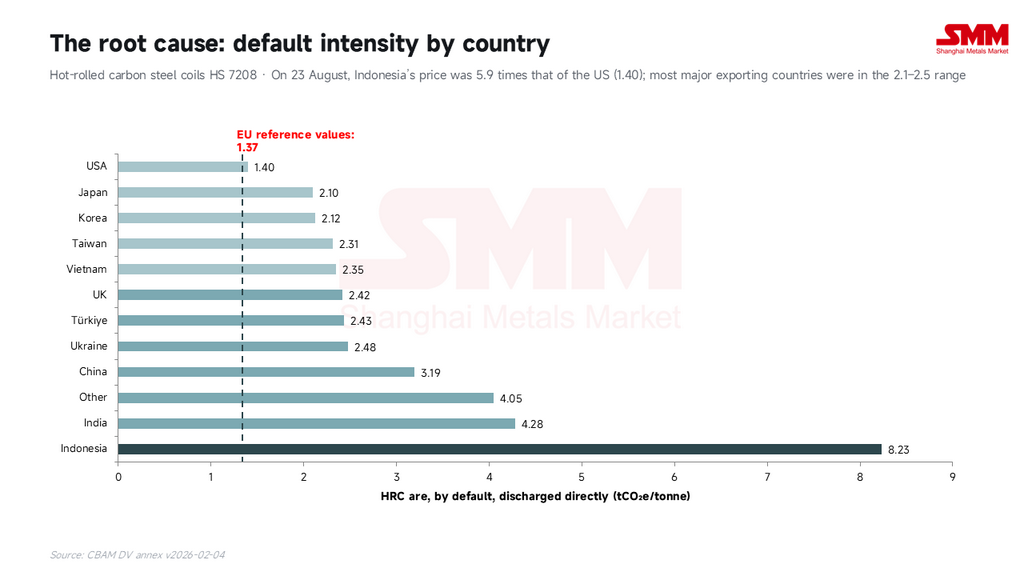
The gap is rooted in process route and feedstock. Indonesia's 8.23 stands alone (a coal-based, high-carbon steel system); India's 4.28 is next. China's 3.19 sits above most major exporters — a reflection of its BF/BOF-heavy mix. Economies leaning on electric-arc / short-process routes — Türkiye, Vietnam, Taiwan — cluster at 2.1–2.5. And the USA's 1.40, on a scrap-EAF-dominated fleet, hugs the EU benchmark itself.
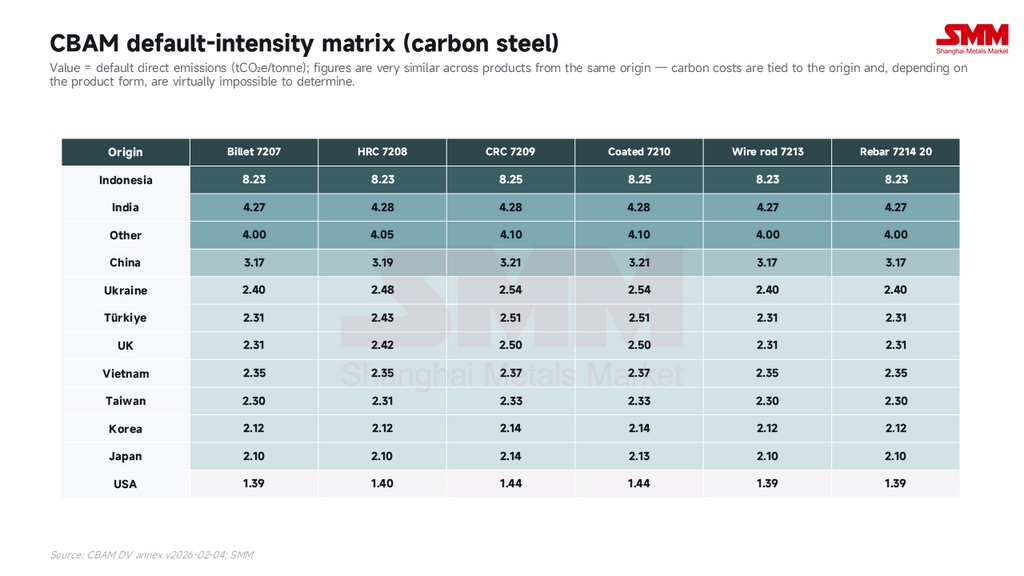
Widen the lens to the full country × product matrix and the pattern sharpens: within a single origin, default values for billet, HRC, CRC, coated sheet, wire rod and rebar are nearly identical (China 3.17–3.21 across the board; Indonesia 8.23–8.25). It is origin, not product, that opens the gap. For a high-carbon origin, changing the form of the exported steel does almost nothing to escape the carbon cost — the difference is locked at the molten-steel source.
Decoding the rules: free-allocation phase-out and the process-route contest
CBAM does not charge for all embedded emissions. It first deducts the free allocation that an equivalent EU product would have received. The core formula:
Certificates due per tonne = embedded emissions − free-allocation deduction (SEFA); where SEFA = CBAM factor × cross-sectoral correction factor (CSCF) × benchmark (BMg).
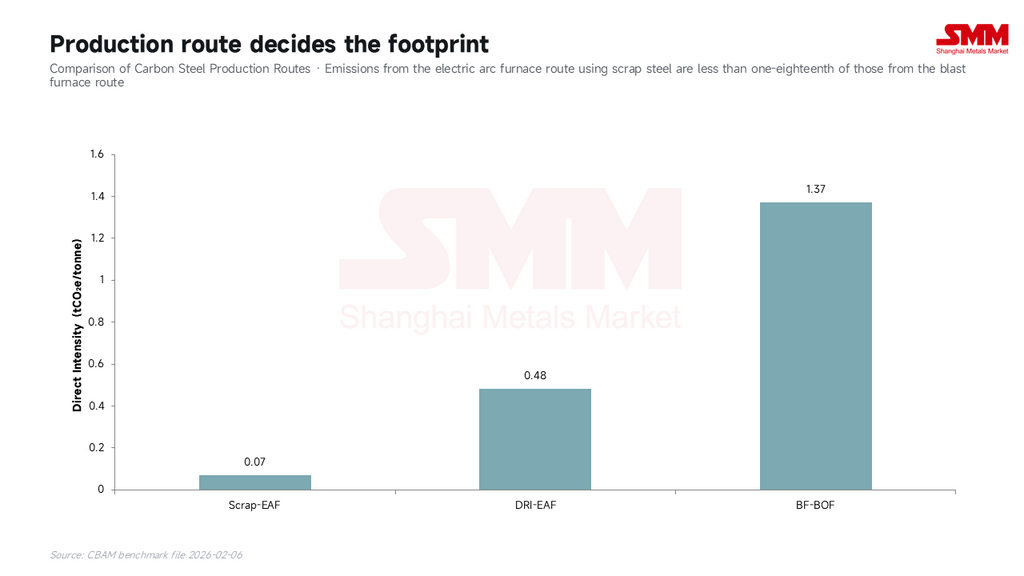
First, the benchmark (BMg) is set per product in two columns: Column B for the mainstream primary route (HRC 1.370, CRC 1.458, coated 1.491, billet/longs 1.364), Column A for the scrap-EAF route (HRC just 0.044; rebar/wire rod 0.038). Verified declarations take the column matching the actual route; default-value declarations take Column B.
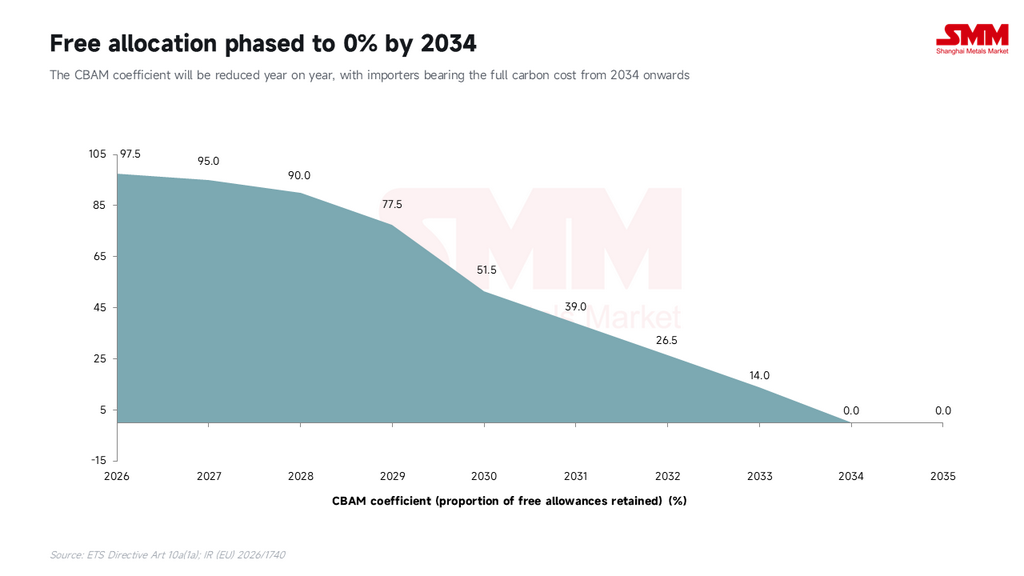
Second, the CBAM factor — the share of free allocation not yet phased out — falls from 97.5% in 2026 to 0% by 2034, when imports bear the full carbon cost.
Third, in the definitive phase steel counts direct emissions only; indirect (electricity) emissions are excluded for now.
Process route therefore becomes the watershed: scrap/EAF about 0.072, DRI/EAF about 0.481, BF/BOF about 1.370 tonnes of CO₂-equivalent per tonne — the scrap route emits under one-eighteenth of the blast furnace. The shorter and greener the process, the more competitive it becomes under CBAM.
The panorama: a 40× carbon-cost map for the same coil of HRC
Combine default values, benchmark deduction, mark-up and certificate price and you get the per-tonne CBAM cost. For carbon-steel HRC (HS 7208) at the Q2 2026 certificate price:
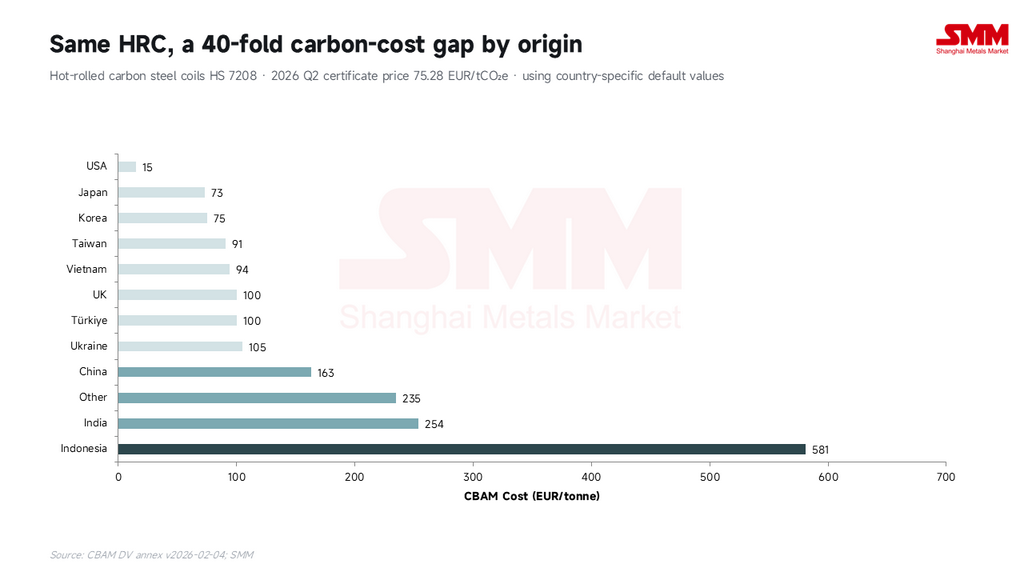
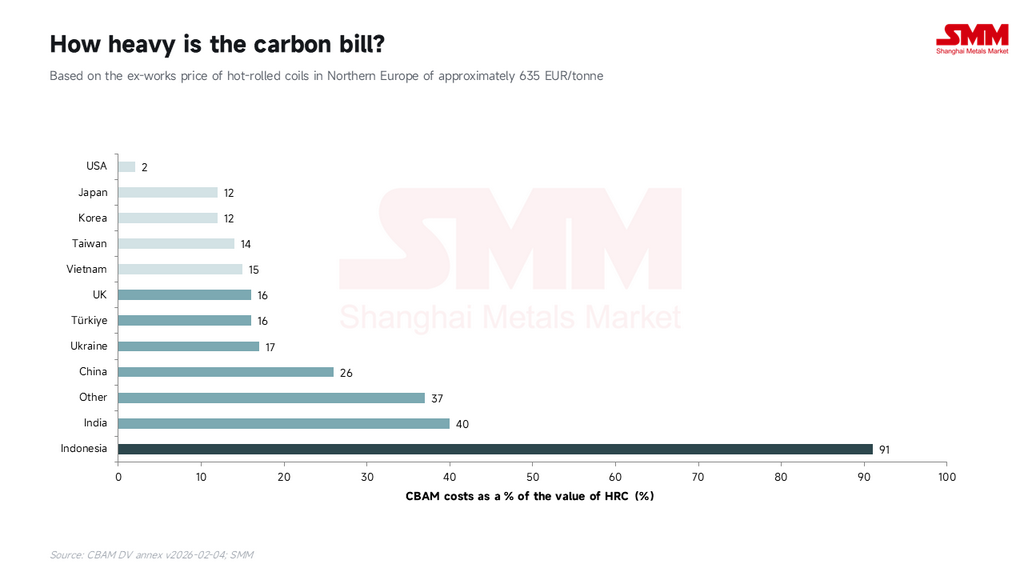
This table upends traditional price comparison. Indonesian material carries a carbon cost almost equal to buying a second coil (91% of value) — effectively priced out of the EU. Chinese material bears about 163 EUR/tonne, 26% of value — still competitive, but clearly burdened. The USA, Japan and Korea, by contrast, pay only 2%–12% of value; their low-carbon routes convert directly into quoting power. (Economies not listed individually take the "other countries" column at 235 EUR/tonne — higher than China's — so routing through Malaysia or Thailand buys nothing.)
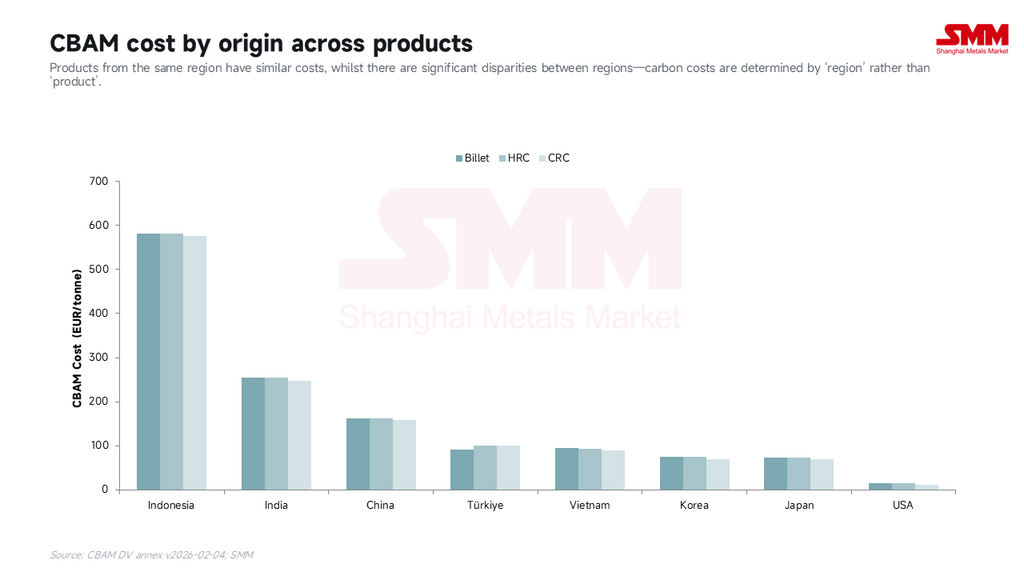
Put billet, HRC and CRC side by side and the three products within one origin are nearly identical (China 162 / 163 / 158 EUR/tonne) — reaffirming that carbon cost is set by origin. Switching product form cannot cut the bill; only a change of origin or of process (verified data / a low-carbon route) can.
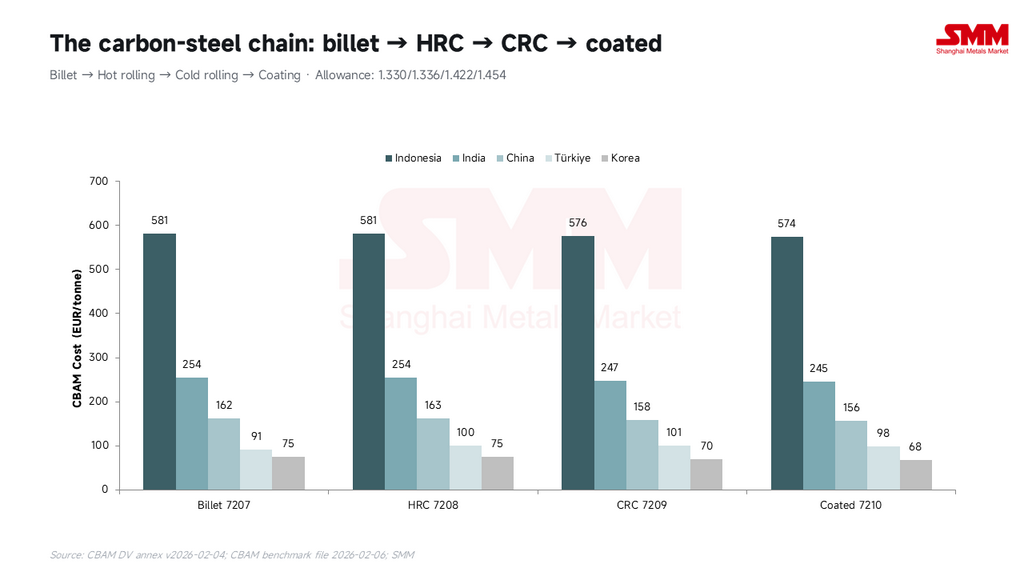
Tracing the chain: carbon labels from billet to coated sheet
Billet is the anchor of melt-and-pour traceability. Both CBAM and the new quota regime look to where the liquid steel solidified, so a billet's carbon label passes straight through to downstream re-rolled products.
Two long products deserve a note: rebar (HS 7214 20 00) and wire rod (HS 7213) share a 1.364 benchmark and 1.330 deduction — China 162 EUR/tonne, Türkiye 91 EUR, Ukraine 98 EUR. Türkiye and Ukraine happen to be the EU's mainstay rebar/wire-rod suppliers, so their carbon bills are mild; for Chinese longs, CBAM stacks another layer on top of the 50% out-of-quota duty.
Viewed together along the chain: the deduction only wobbles between 1.33 and 1.45, while default emissions stretch from 1.4 to 8.3 — at every link, the cost ranking is set by origin.
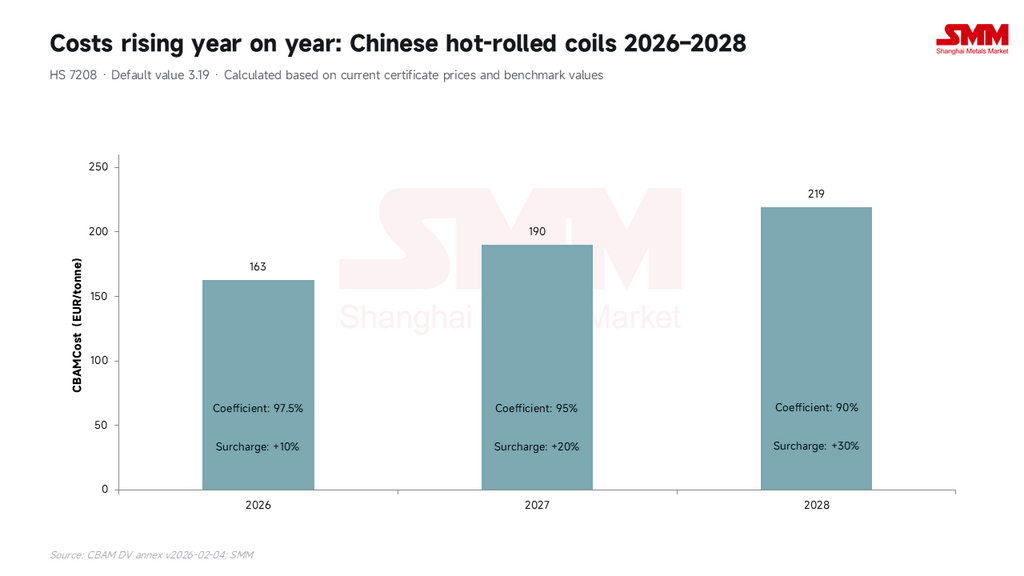
Dynamic evolution: the compounding of carbon cost, 2026–2028
CBAM's cost is not a one-off; it rises year by year. The default-value mark-up walks from +10% toward its +30% cap even as the free-allocation deduction shrinks with the phasing-out CBAM factor — two forces pushing the bill higher from both sides. For Chinese HRC, the per-tonne CBAM cost climbs from about 163 EUR in 2026 to about 190 EUR in 2027 and 219 EUR in 2028 (roughly 189 / 219 / 253 USD); Indonesia climbs from 581 to 646 and 713 over the same span. For high-carbon origins, time is not a friend. (Computed at the current certificate price and benchmarks; the 2028 benchmark vintage will differ slightly.)
Regional scan: cost and quota verdicts for twelve major producers
Both axes — carbon (default value, cost, share of value, escalation) and trade (quota position) — in one table, all on an HRC basis:
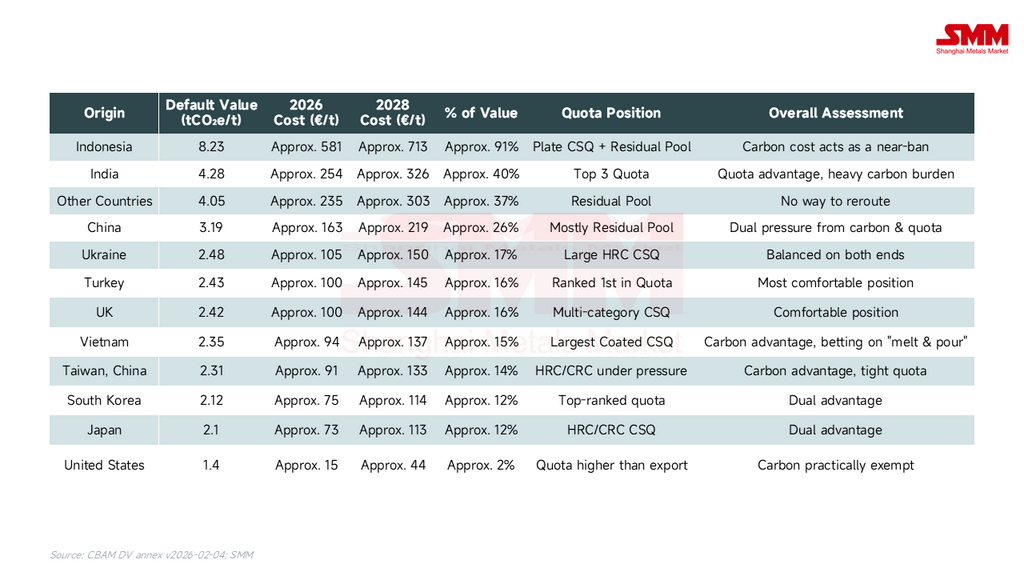
In detail:
- Indonesia: a default value of 8.23 in a league of its own; an HRC carbon cost of 581 EUR/tonne (91% of value), rising to 713 EUR by 2028 — effectively a shut door under default values. Only verified actual data (if real processes beat the default) or a low-carbon route reopens the channel. A caveat, though: CBAM will not force Southeast Asia's BF/BOF assets to close. That high-carbon capacity will most likely be absorbed by redirecting trade flows — toward the Middle East or intra-Asian markets.
- India: default 4.28, cost 254 EUR/tonne (40% of value). A top-three quota holder with ample HRC/CRC/coated CSQ — the quota gives, and carbon takes half back; expect more Indian tonnage weighting toward the Middle East and Southeast Asia.
- China: default 3.19, cost 163 EUR/tonne (26%). A mid-high carbon burden stacked on the weakest quota hand — no CSQ in most categories and a residual pool of only 0.95 Mt. Squeezed on both axes, though with the most to gain from verified actual data (EAF and advanced lines can beat the country default substantially).
- Türkiye: default 2.43, cost 100 EUR/tonne (16%), plus the largest quota in Europe (2.86 Mt) — the most comfortable winner of this reform, a double dividend of geography and short-process routes.
- Ukraine: default 2.48, cost 105 EUR/tonne, with a large HRC CSQ (0.48 Mt) and wartime arrangements — balanced on both axes.
- Vietnam: default 2.35, cost 94 EUR/tonne — surprisingly carbon-light — plus the largest coated-sheet CSQ. The only open question is melt-and-pour: from October 2027, re-rolled products traced to high-carbon slab will have both their quota and carbon accounts recomputed.
- Taiwan, China: default 2.31, cost 91 EUR/tonne — light on carbon; the pressure is on the quota side (tighter HRC/CRC, 106 kt of CRC potentially out of quota).
- Japan and South Korea: defaults near 2.1, costs of 73–75 EUR/tonne (12%), with strong quotas — the strong-on-both camp, where low-carbon routes convert into share.
- USA: default 1.40, cost only 15 EUR/tonne (2%) — the scrap-EAF fleet makes CBAM a rounding error; what limits US exports to the EU is freight and price spreads, not carbon.
- Other (unlisted) countries: a flat 4.05 and 235 EUR/tonne — above China. The four ASEAN producers are in a phase of rapid steel-market growth, yet re-routing through Malaysia or Thailand to "launder" origin costs more under CBAM, not less. That punitive fallback default is by design — the EU's deliberate anti-circumvention backstop, working in tandem with the melt-and-pour rule as a double lock.
Twin barriers: carbon cost stacked on safeguard quota
CBAM rarely acts alone. From the second half of 2026, a single coil can hit two gates at once: the 50% out-of-quota duty under the new steel safeguard regime, and the CBAM carbon cost. The two tools point the same way — melt-and-pour traces liquid-steel origin, CBAM's default values penalise high-carbon long routes — both steering demand toward low-carbon, short-process, traceable and in-quota supply. For a high-default origin like Indonesia, or for Chinese material stuck with residual-pool quota and a mid-high carbon bill, it is the toughest combination; Türkiye, Japan and Korea sail through both gates.
Strategic response: carbon-asset management and supply-chain moves for exporters
Facing a bill that rises every year, exporters have three levers.
First, replace default values with verified actual data. The definitive phase allows declaring verified actual emissions, and actual values carry no mark-up; for EAF or advanced lines, real emissions often beat the country default substantially, cutting costs at a stroke. But note: actual data must pass a rigorous audit by an EU-accredited verifier. For non-EU producers, standing up a data foundation that meets the EU's MRV (monitoring, reporting and verification) requirements is itself an upfront compliance cost — the return on that investment has to be weighed case by case.
Second, plan low-carbon routes and green power — turning scrap ratio, DRI share and renewable-electricity use into verifiable carbon competitiveness.
Third, fold CBAM certificate cost, safeguard duty and anti-dumping/countervailing duty into a single EU quote, and pair it with an FX-volatility monitor while tracking the certificate price — quarterly now, weekly from 2027 — for a two-layer dynamic adjustment. Note too that a carbon price already paid abroad is deductible pro-rata — one concrete reason exporting nations are accelerating domestic carbon markets. Carbon is moving from a compliance line item to a pricing variable.
![[SMM Steel] Preços de transação de vergalhão na Malásia sobem levemente](https://imgqn.smm.cn/usercenter/JdqON20251217171718.png)
![[SMM Steel] More Trade Remedies from Taiwan Add Pressure to Vietnam’s Export Market](https://imgqn.smm.cn/usercenter/wSpkX20251217171718.png)
![[SMM Steel] Baixos estoques e suporte de custos impulsionam recuperação nos preços do vergalhão turco](https://imgqn.smm.cn/usercenter/tgoYV20251217171715.jpg)