SHANGHAI, Feb 24 (SMM) - This is a roundup of China's metals weekly inventory as of February 24.
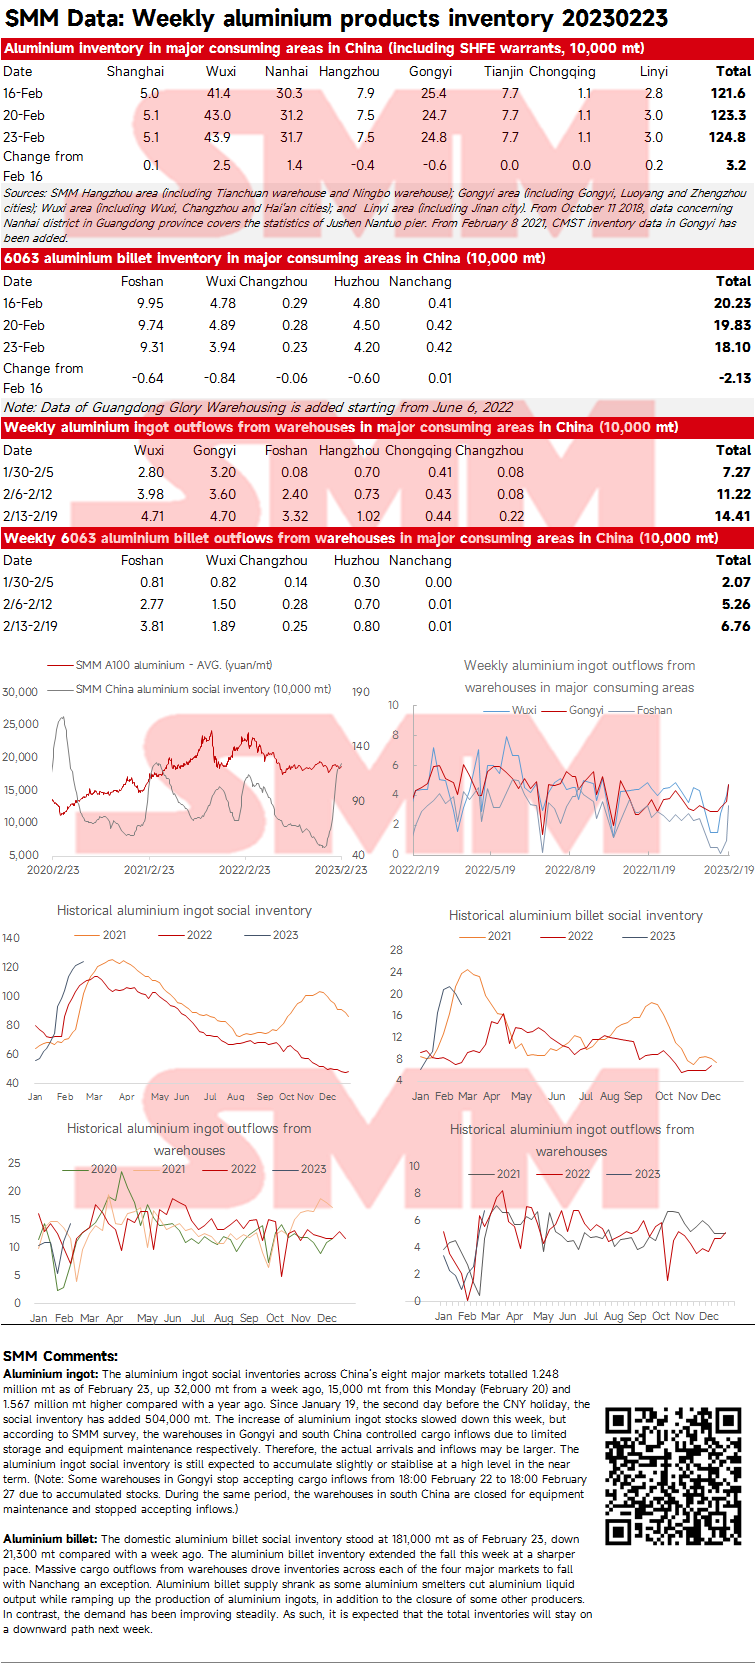
SMM Aluminium Ingot and Billet Social Inventories as of February 23
Aluminium ingot: The aluminium ingot social inventories across China's eight major markets totalled 1.248 million mt as of February 23, up 32,000 mt from a week ago, up 15,000 mt from this Monday (February 20) and 1.567 million mt higher compared with a year ago. Since January 19, the second day before the CNY holiday, the social inventory has added 504,000 mt. The increase of aluminium ingot stocks slowed down this week, but according to SMM survey, the warehouses in Gongyi and south China controlled cargo inflows due to limited storage and equipment maintenance respectively. Therefore, the actual arrivals and inflows may be larger. The aluminium ingot social inventory is still expected to accumulate slightly or staiblise at a high level in the near term. (Note: Some warehouses in Gongyi stop accepting cargo inflows from 18:00 February 22 to 18:00 February 27 due to accumulated stocks. During the same period, the warehouses in south China are closed for equipment maintenance and stopped accepting inflows.)
Aluminium billet: The domestic aluminium billet social inventory stood at 181,000 mt as of February 23, down 21,300 mt compared with a week ago. The aluminium billet inventory extended the fall this week at a sharper pace. Massive cargo outflows from warehouses drove inventories across each of the four major markets to fall with Nanchang an exception. Aluminium billet supply shrank as some aluminium smelters cut aluminium liquid output while ramping up the production of aluminium ingots, in addition to the closure of some other producers. In contrast, the demand has been improving steadily. As such, it is expected that the total inventories will stay on a downward path next week.
Copper Inventory in Major Chinese Markets Declined 4,500 mt
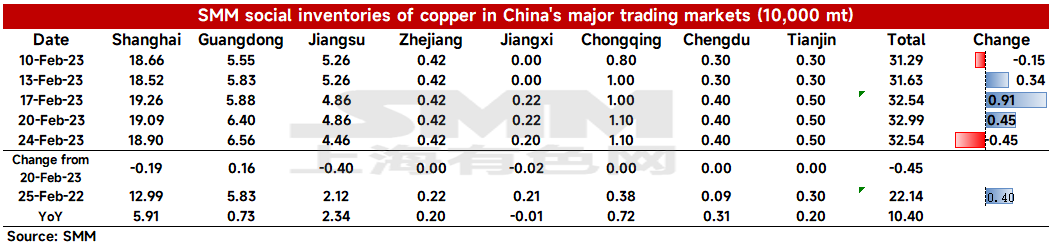
As of Friday February 24, copper inventories in mainstream markets tracked by SMM fell by 4,500 mt from Monday to 325,400 mt, and were flat from last Friday. This is up 128,800 mt from pre-CNY level, snapping a growth of eight consecutive weeks since end-December. The market shall keep an eye on whether there will be a pivot in inventory next week.
Only Guangdong saw inventory growth compared to Monday. Total domestic inventory grew 104,000 mt from 221,400 mt in the same period last year. The inventory was 59,100 mt higher than the same period last year in Shanghai, 7,300 mt higher in Guangdong, 23,400 mt higher in Jiangsu, and 7,200 mt higher in Chongqing.
The inventory in Shanghai decreased by 1,900 mt to 189,000 mt compared with Monday, and the inventory in Jiangsu decreased by 4,000 mt to 44,600 mt. Despite arriving shipments of imported copper recently, the volume was not high. Downstream stockpiling in east China increased slightly compared with last week, causing a slight inventory decline. Inventory in Guangdong increased by 1,600 mt to 65,600 mt. Consumption in Guangdong continued to weaken this week until it improved slightly on Friday. Increased shipments arrivals of seaborne copper combined with sluggish consumption drove the inventory growth in Guangdong, which can also be reflected in falling daily average shipments there.
SMM understood that arriving shipments of imported copper will increase slightly next week. But most market supply will be domestic copper. Consumption next week will outperform this week on the back of falling copper prices and adequate cash flows in March. To sum up, SMM expect supply and demand to increase next week. And inventory would fall marginally.
Copper Inventory in China Bonded Zone Grew 9,300 mt This Week
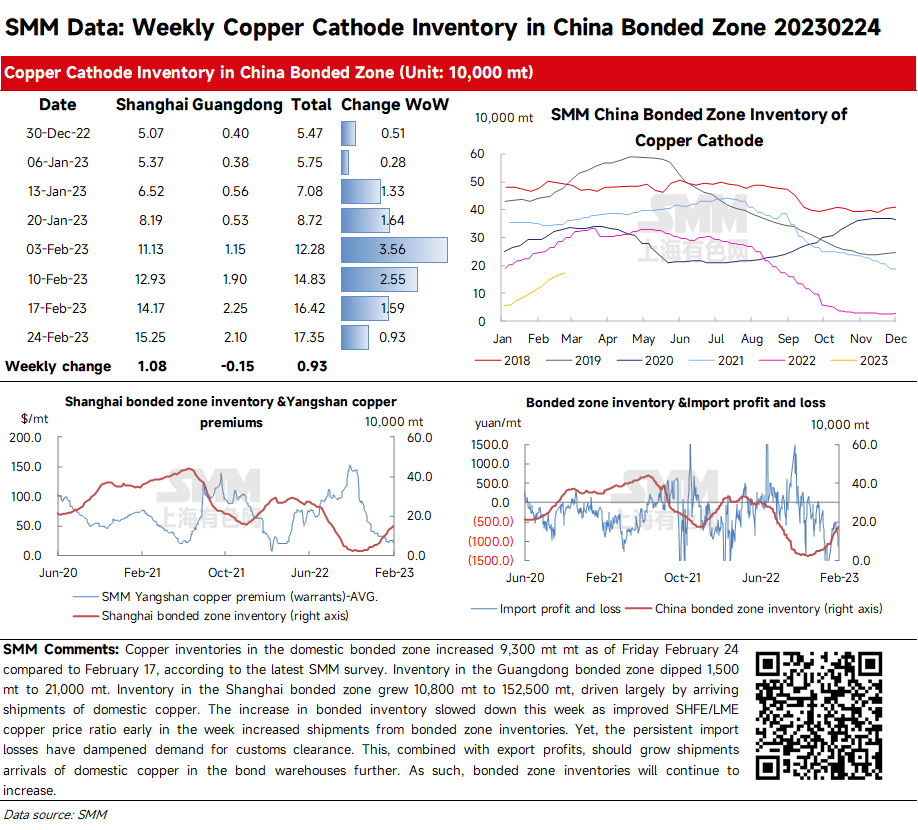
Copper inventories in the domestic bonded zone increased 9,300 mt mt as of Friday February 24 compared to February 17, according to the latest SMM survey. Inventory in the Guangdong bonded zone dipped 1,500 mt to 21,000 mt. Inventory in the Shanghai bonded zone grew 10,800 mt to 152,500 mt, driven largely by arriving shipments of domestic copper. The increase in bonded inventory slowed down this week as improved SHFE/LME copper price ratio early in the week increased shipments from bonded zone inventories. Yet, the persistent import losses have dampened demand for customs clearance. This, combined with export profits, should grow shipments arrivals of domestic copper in the bond warehouses further. As such, bonded zone inventories will continue to increase.
Bonded Zone Inventory of Nickel Drops Slightly from February 17
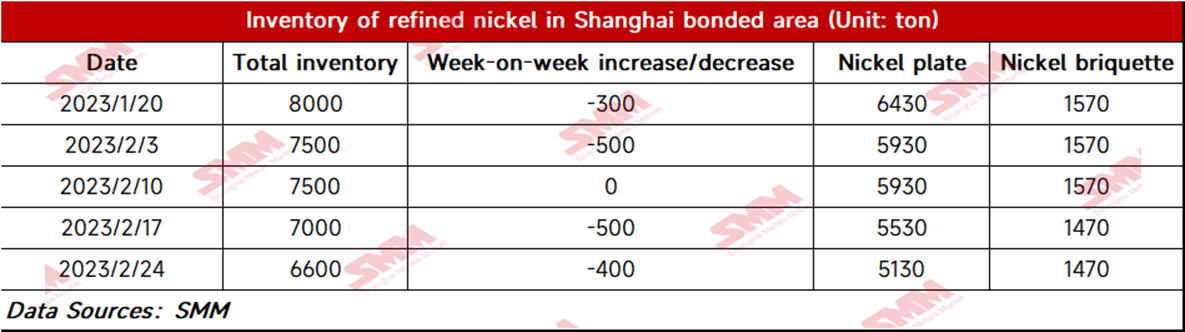
Bonded zone inventory of nickel dropped 400 mt to 6,600 mt WoW as of February 24, with the inventory of nickel briquettes and nickel plates standing at 1,470 mt and 5,130 mt respectively. Nickel plate inventory fell more amid the opening of the import window this week. Downstream demand was poor early this week when the nickel prices rose. Afterwards, the demand grew following the fall in nickel prices on Thursday and Friday. Nickel briquette demand from the stainless steel sector was low, thus the bonded zone inventory of nickel briquettes stood flat WoW this week.
Zinc Ingot Social Inventory Dips 200 mt from this Monday
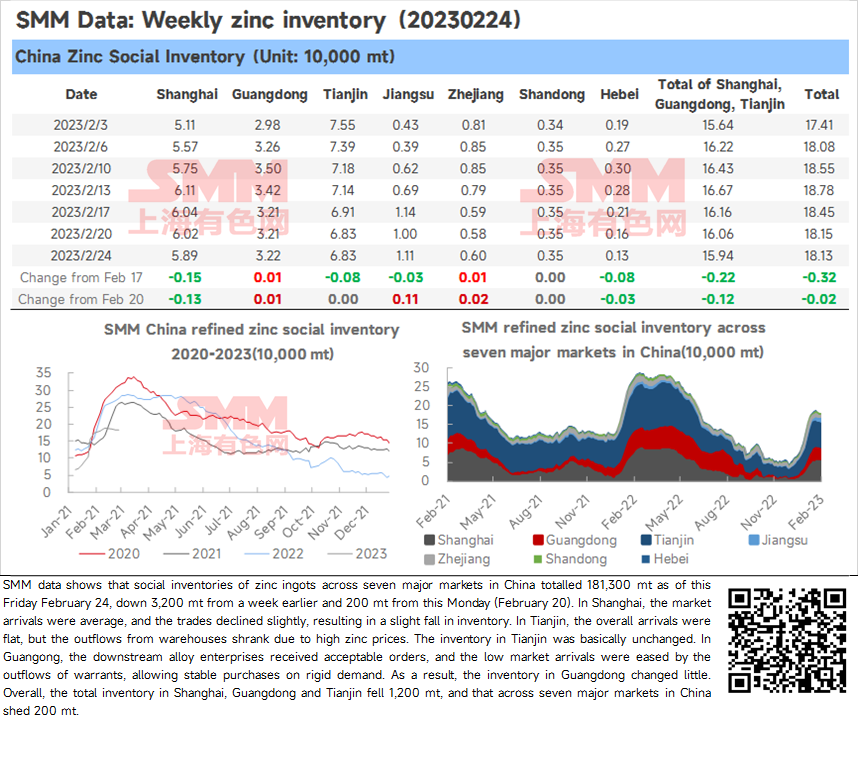
SMM data shows that social inventories of zinc ingots across seven major markets in China totalled 181,300 mt as of this Friday February 24, down 3,200 mt from a week earlier and 200 mt from this Monday (February 20).
In Shanghai, the market arrivals were average, and the trades declined slightly, resulting in a slight fall in inventory. In Tianjin, the overall arrivals were flat, but the outflows from warehouses shrank due to high zinc prices. The inventory in Tianjin was basically unchanged. In Guangong, the downstream alloy enterprises received acceptable orders, and the low market arrivals were eased by the outflows of warrants, allowing stable purchases on rigid demand. As a result, the inventory in Guangdong changed little.
Overall, the total inventory in Shanghai, Guangdong and Tianjin fell 1,200 mt, and that across seven major markets in China shed 200 mt.
SMM Lead Ingot Social Inventory Fell with Fewer Sources from Smelters
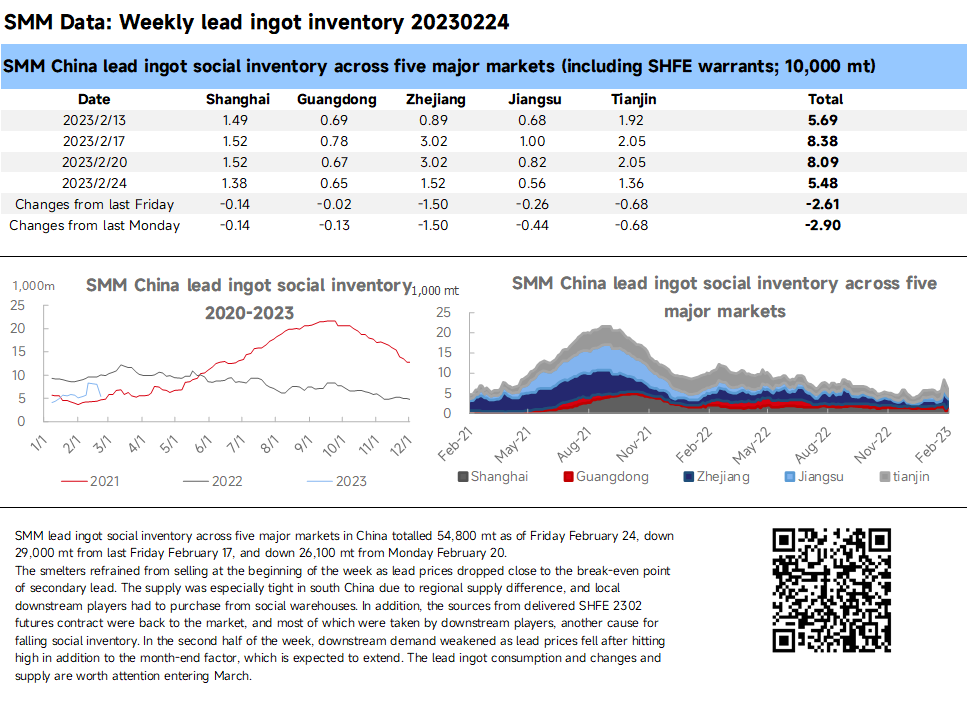
SMM lead ingot social inventory across five major markets in China totalled 54,800 mt as of Friday February 24, down 29,000 mt from last Friday February 17, and down 26,100 mt from Monday February 20.
The smelters refrained from selling at the beginning of the week as lead prices dropped close to the break-even point of secondary lead. The supply was especially tight in south China due to regional supply difference, and local downstream players had to purchase from social warehouses. In addition, the sources from delivered SHFE 2302 futures contract were back to the market, and most of which were taken by downstream players, another cause for falling social inventory. In the second half of the week, downstream demand weakened as lead prices fell after hitting high in addition to the month-end factor, which is expected to extend. The lead ingot consumption and changes and supply are worth attention entering March.
Silicon Metal Social Stocks Extend Decline
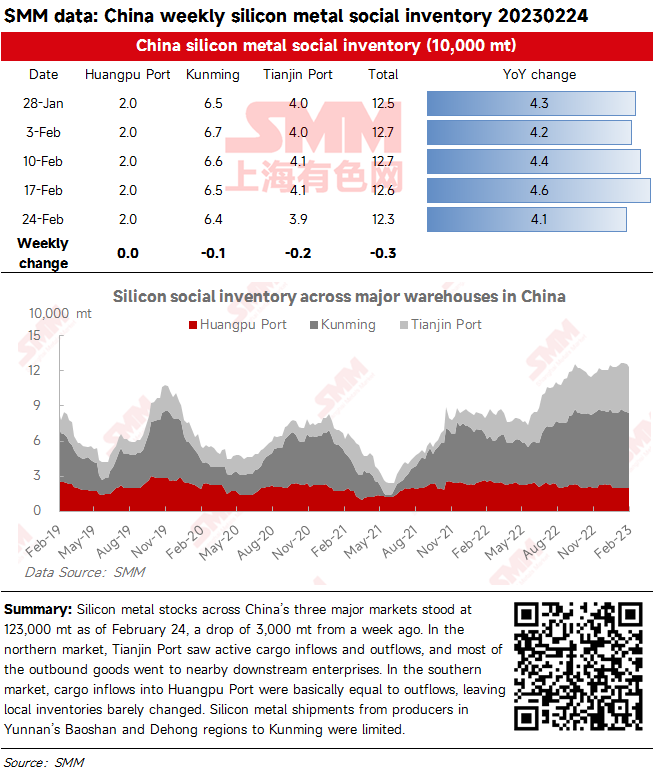
Silicon metal stocks across China’s three major markets stood at 123,000 mt as of February 24, a drop of 3,000 mt from a week ago. In the northern market, Tianjin Port saw active cargo inflows and outflows, and most of the outbound goods went to nearby downstream enterprises. In the southern market, cargo inflows into Huangpu Port were basically equal to outflows, leaving local inventories barely changed. Silicon metal shipments from producers in Yunnan’s Baoshan and Dehong regions to Kunming were limited.
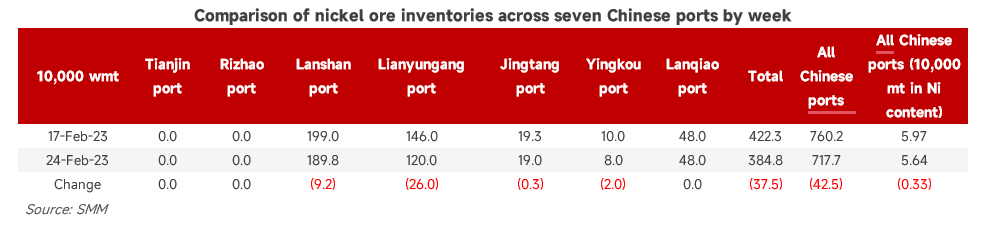
Nickel Ore Inventories at Chinese Ports Dip 425,000 wmt WoW
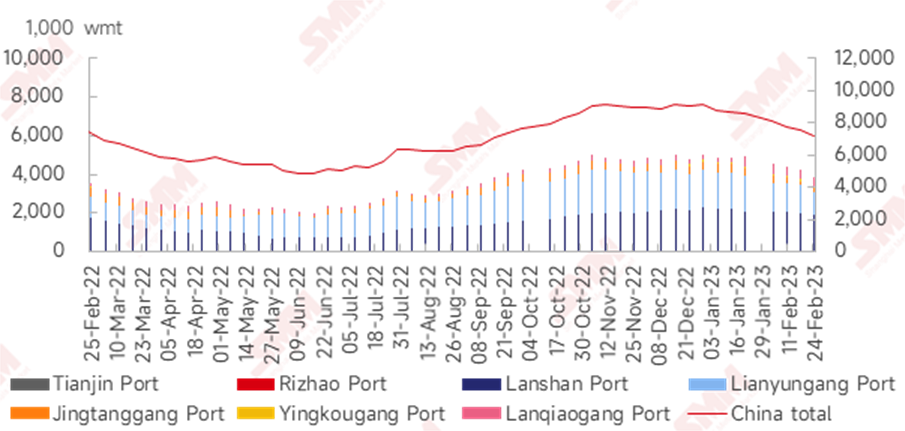
As of February 24, the nickel ore inventories at Chinese ports dropped 425,000 wmt from a week earlier to 7.18 million wmt. The total Ni content stood at 56,400 mt. The port inventory across seven major Chinese ports stood at 3.85 million wmt, 375,000 wmt lower than last week. Demand from NPI plants grew somewhat. However, the imports were still hindered by the rainy season in the Philippines. The recent imports have remained low. Port inventory of nickel ore may fall amid the better demand.


![[SMM Flash de Cromo] Exportações de FeCr de alto carbono da África do Sul sobem 20% em agosto na comparação mensal, para 117.180 t, impulsionadas por embarques para Canadá e EUA](https://imgqn.smm.cn/usercenter/TdoSs20251217171724.jpeg)