SHANGHAI, Jul 22 (SMM) - This is a roundup of China's metals weekly inventory as of July 22.
SMM Aluminium Ingot and Billet Inventory both Dropped on Week
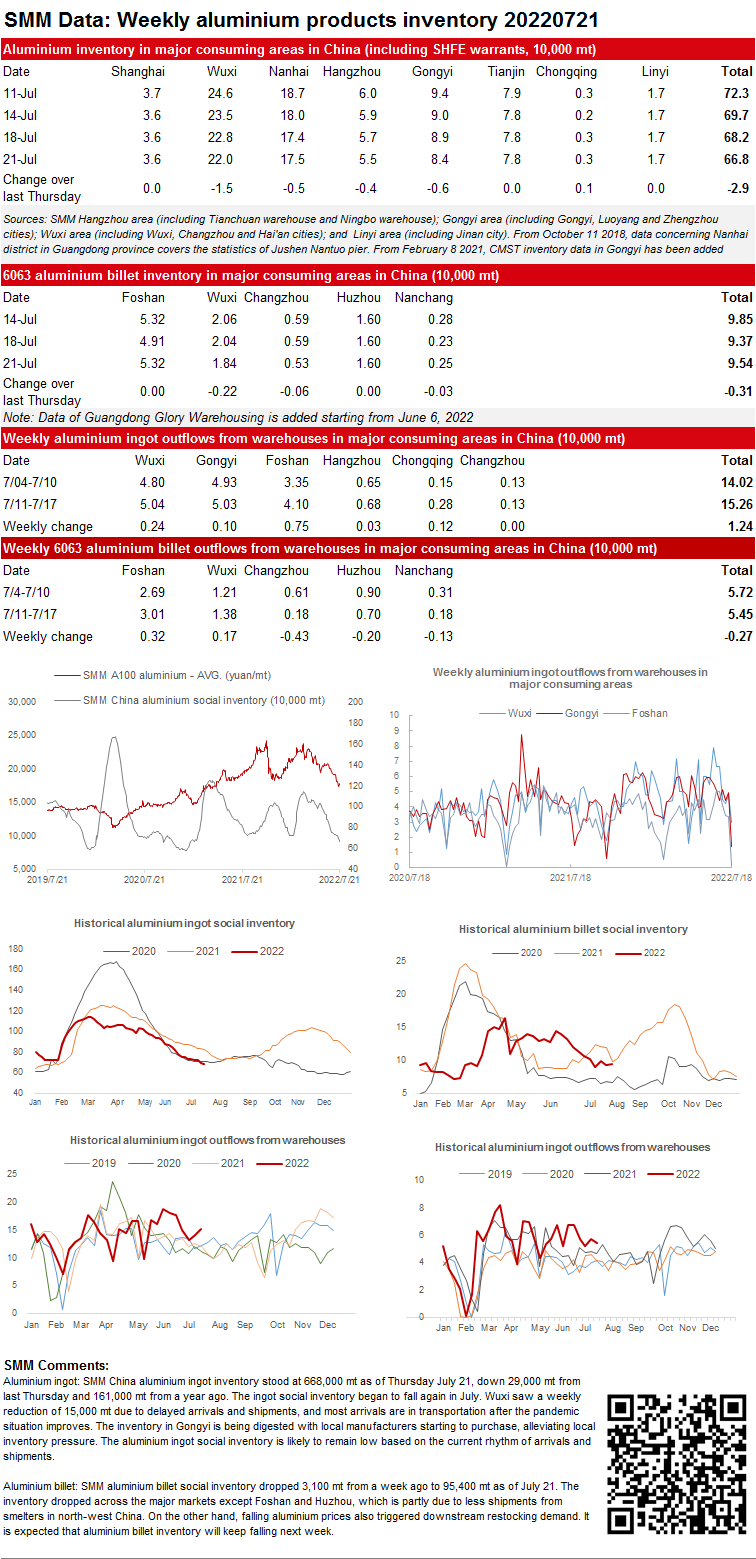
SMM China aluminium ingot inventory stood at 668,000 mt as of Thursday July 21, down 29,000 mt from last Thursday and 161,000 mt from a year ago. The ingot social inventory began to fall again in July. Wuxi saw a weekly reduction of 15,000 mt due to delayed arrivals and shipments, and most arrivals are in transportation after the pandemic situation improves. The inventory in Gongyi is being digested with local manufacturers starting to purchase, alleviating local inventory pressure. The aluminium ingot social inventory is likely to remain low based on the current rhythm of arrivals and shipments.
SMM aluminium billet social inventory dropped 3,100 mt from a week ago to 95,400 mt as of July 21. The inventory dropped across the major markets except Foshan and Huzhou, which is partly due to less shipments from smelters in north-west China. On the other hand, falling aluminium prices also triggered downstream restocking demand. It is expected that aluminium billet inventory will keep falling next week.
Zinc Ingot Social Inventory Decreased on Week
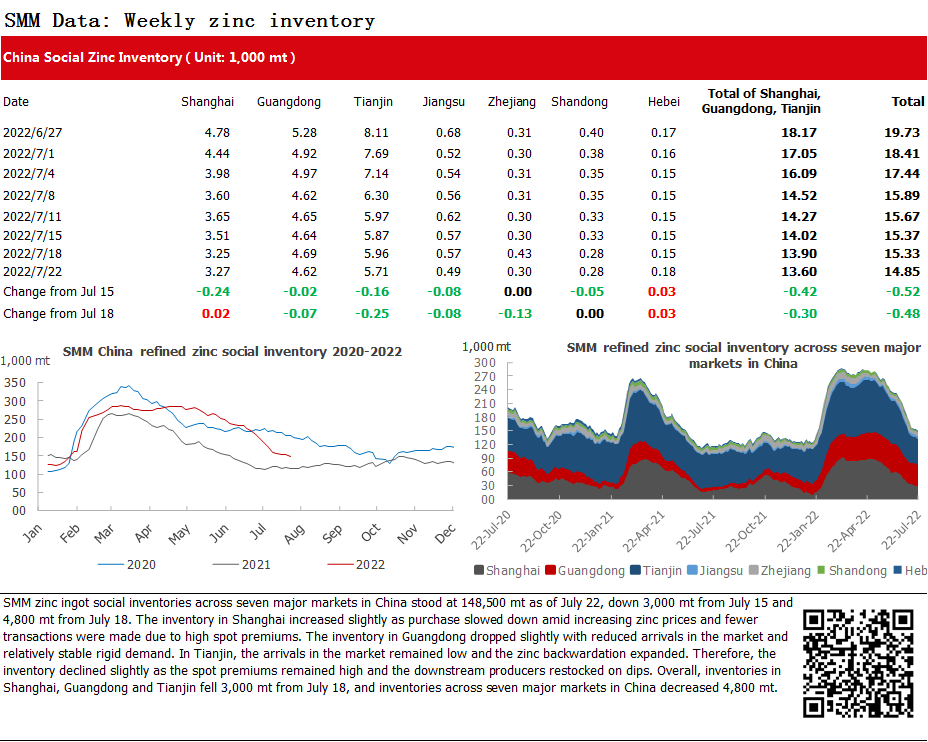
SMM zinc ingot social inventories across seven major markets in China stood at 148,500 mt as of July 22, down 3,000 mt from July 15 and 4,800 mt from July 18. The inventory in Shanghai increased slightly as purchase slowed down amid increasing zinc prices and fewer transactions were made due to high spot premiums. The inventory in Guangdong dropped slightly with reduced arrivals in the market and relatively stable rigid demand. In Tianjin, the arrivals in the market remained low and the zinc backwardation expanded. Therefore, the inventory declined slightly as the spot premiums remained high and the downstream producers restocked on dips. Overall, inventories in Shanghai, Guangdong and Tianjin fell 3,000 mt from July 18, and inventories across seven major markets in China decreased 4,800 mt.
Copper Inventory across Major Chinese Markets Decreased by 15,300 mt from Monday
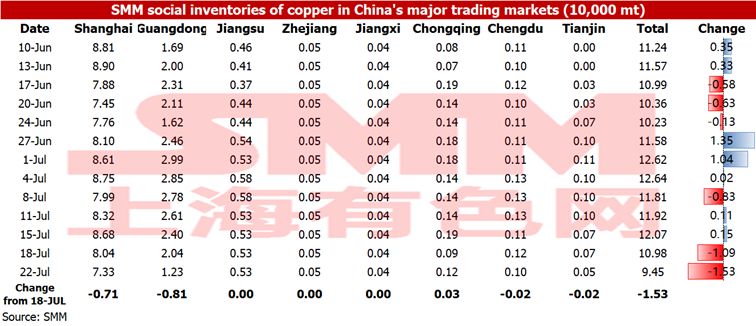
As of Friday July 22, SMM copper inventory across major Chinese markets declined by 15,300 mt from Monday to 94,500 mt, down 26,200 mt from last Friday.
The inventory in Guangdong decreased sharply with a weekly drop of 8,100 mt, mainly due to the decrease in import volume and shipments flowing into the warehouses in Guangdong, while the downstream consumption was fair. The decline in Shanghai inventory was smaller than that in Guangdong inventory. Last week, the inflow of copper remained at low levels, and a large amount of copper that arrived last weekend was consumed, thus the spot premiums maintained firm. The inventory in other regions of China changed little.
Copper Inventory in China Bonded Zone Dropped by 2,000 mt on Week
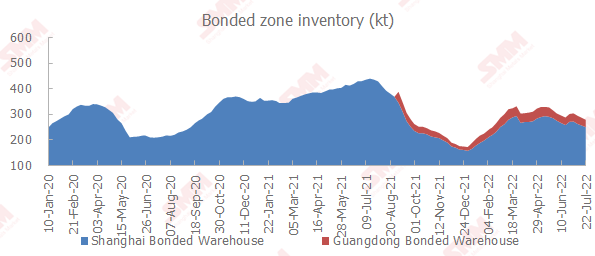
Copper inventories in domestic bonded zones decreased by 2,000 mt from last Friday July 15 to 276,300 mt as of Friday July 22, according to the SMM survey. The bonded zone inventory has dropped for four consecutive weeks, but the speed was significantly slowed down. The inventory in Shanghai bonded zone stood unchanged at 249,500 mt WoW, while that in Guangdong dropped by 2,000 mt to 26,800 mt. Recently, the trading in the import market was poor. The import losses fluctuated around 350 yuan/mt over the SHFE 2208 copper contract this week, which could not offer solid support to the exports. Besides, the shipments of warrants out of the warehouses were limited, and the arrival of imported copper was flowing into the bonded warehouses one after another, hence the inventory this week dropped only slightly.
Bonded Zone Inventory of Nickel Decreased this Week as the Price Ratio Improved
The price ratio gradually recovered this week, and the spot imports gained considerable profits even though the US dollar was high. According to SMM research, the bonded zone inventory stood at 6,500 mt this week. The inventory of nickel briquette was 2,900 mt, and that of nickel plate was 3,600 mt, a decrease of 1,300 mt WoW. The lower nickel inventory was contributed by the falling futures prices, the better demand for overseas pure nickel that was aroused by the improvement of the domestic alloy sector, and the recovered SHFE/LME nickel price ratio.

Total Silicon Metal Inventory across Major Ports in China increased on Week
According to SMM statistics, the social inventory of silicon metal across Huangpu port, Kunming city and Tianjin port totalled 101,000 mt as of July 22, up 2,000mt from the previous week. On the whole, the inventories of silicon metal in north and south China were relatively flat with slow inflow and outbound shipment. Specifically, in north China, the inventory declined slightly with low arrivals at Tianjin port. In south China, the inventories in Huangpu port and Kunming city both increased, with more cargoes to arrive at the Huangpu port. The inventories of most silicon plants increased slightly year-on-year. The total social inventory is expected to remain high next week.

Nickel Ore Inventories at Chinese Ports up 375,000 wmt WoW
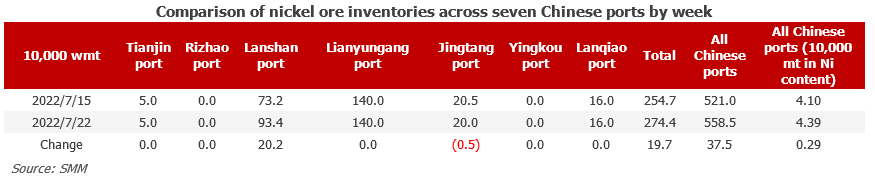
As of July 22, port inventories of nickel ore in China increased by 375,000 wmt to 5.585 million wmt compared with last week. The total Ni content stood at 43,900 wmt. The port inventory of nickel ore across seven major Chinese ports stood at 2.744 million wmt, 197,000 wmt higher than last week. The nickel ore inventory is increasing slowly. On one hand, the import volume was less than that of the same period last year. On the other hand, due to the weather conditions earlier and the recent drop in ore profits squeezed by the falling NPI prices, the shipments of nickel ore were low in the peak season. Profits of some low-grade ores have reached near the break-even point, dragging down the mines’ shipment enthusiasm. In addition, the domestic NPI plants with thin profits intended to lower the purchase prices. If the current supply and demand are maintained, the import volume during the year will be far less than expected.



![[SMM Flash de Cromo] Exportações de FeCr de alto carbono da África do Sul sobem 20% em agosto na comparação mensal, para 117.180 t, impulsionadas por embarques para Canadá e EUA](https://imgqn.smm.cn/usercenter/TdoSs20251217171724.jpeg)