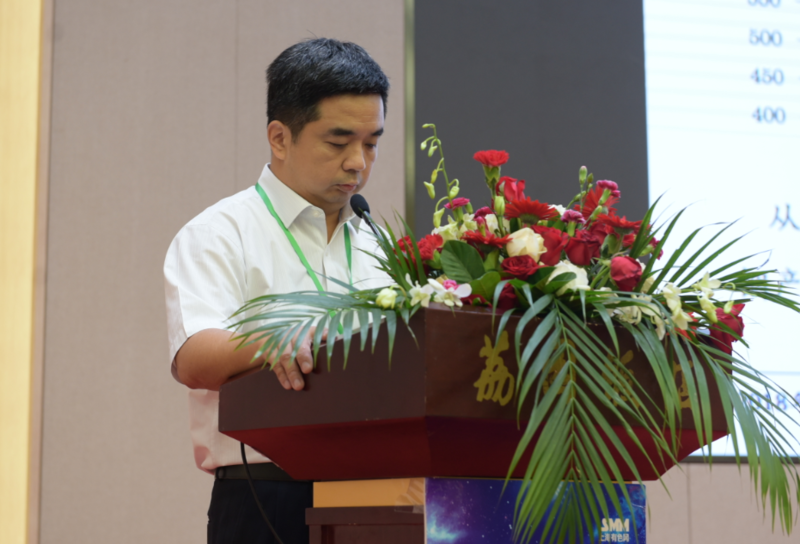
SMM News: on May 24-26, at the "2018 small Metal Industry Summit" held in Nanning, Guangxi, Mr. Zhao Kefeng, chairman of Zhuzhou Keneng New Materials Co., Ltd., gave a summary and explanation of the indium market.
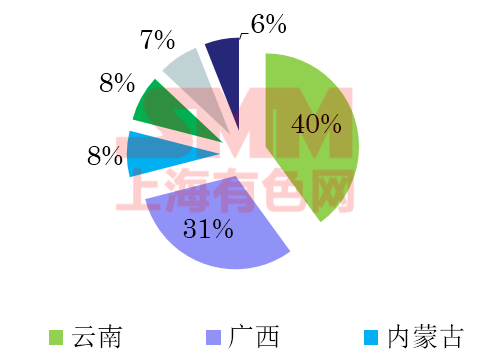
Zhao Kefeng said that the distribution of global-indium in the earth's crust is very small and dispersed. although there are five independent minerals identified, these minerals are rarely found in nature. the basic amount of indium is dispersed in minerals of other elements as impurities. More than 63% are dispersed in lead-zinc ore. According to the data released by (USGS) in 2008, the world's indium reserves are 11000 tons and the basic reserves are 11600 tons. The countries rich in indium resources are Canada, China, the United States, Peru and Russia, which account for about 80% of the global indium reserves.
Indium resource distribution map of China:
Output and inventory
2007-2017 trend chart of primary indium production in China:
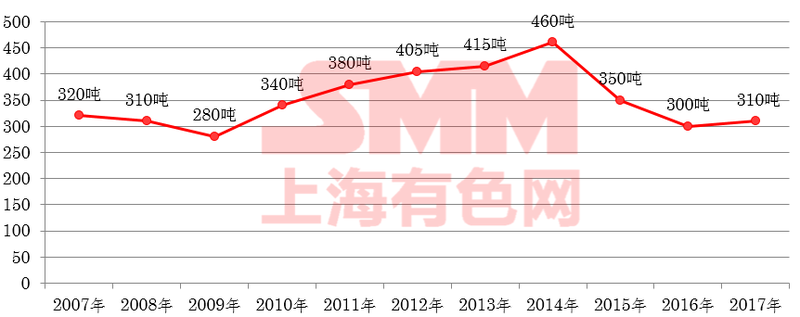
China is the most important producer of primary indium in the world. according to the American Geological Society, China's indium production increased year by year until 2014 and began to decline after reaching 460 tons in 2014.
Chart of global primary indium production, 2007-2017:
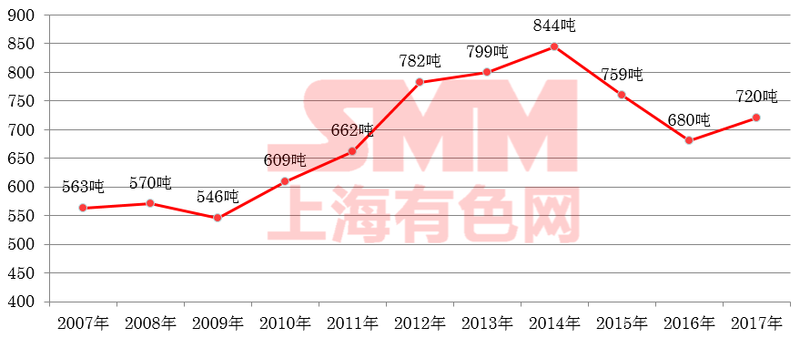
As can be seen from the above table: global primary indium production began to increase in 2009, global primary indium production exceeded 800 tons in 2014, but production began to decline sharply in the past two years.
Analysis of primary indium production in China and the world from 2007 to 2017:

China's primary indium accounts for more than 50 per cent of the world's total, reaching 57.4 per cent in 2011, but has fallen below 50 per cent in the past two years.
Chart of global regenerated indium production, 2007-2017:
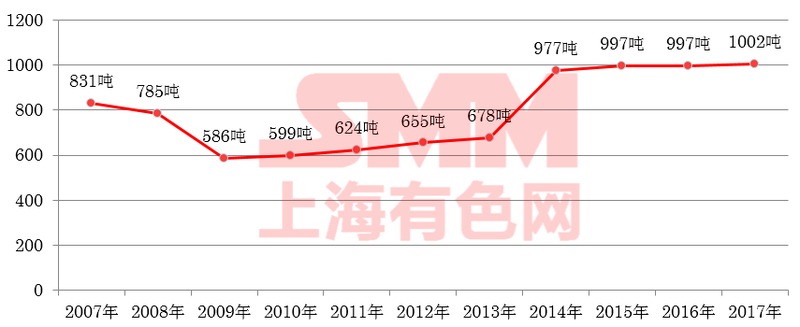
Global production of regenerated indium began to grow in 2009 and exceeded 900 tons in 2014.
Global Indium production Analysis Table 2007-2017 (in tonnes):
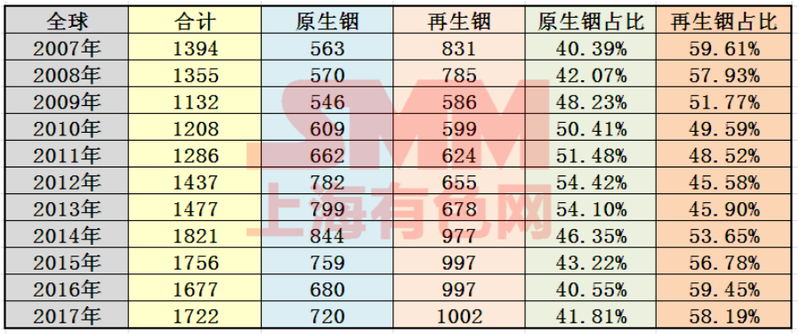
The proportion of primary indium increased gradually from 2007 to 2014, while the proportion of regenerated indium was opposite.
Chart of indium inventory on an exchange from 2012 to 2015:
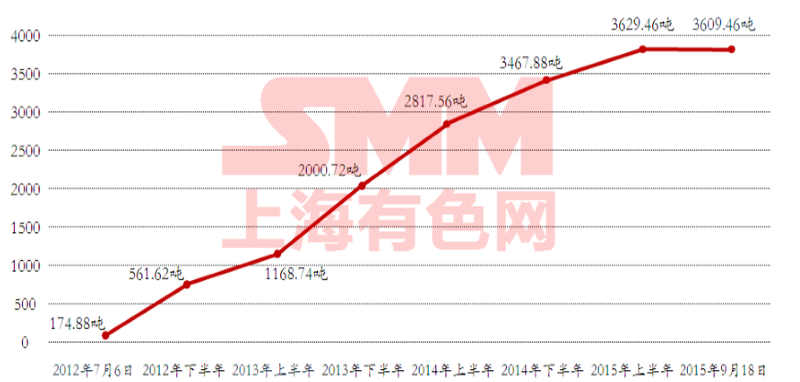
As can be seen from the above table, the semi-annual inventory growth rate is 561.62 tons, 607.12 tons, 831.98 tons, 816.84 tons, 650.32 tons, 161.58 tons and 3609.46 tons as of September 18, 2015.
Supply and consumption
Global indium consumption structure:
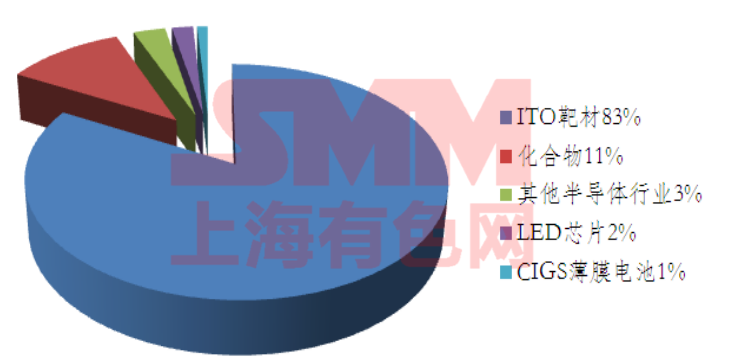
Chart of global total indium supply, 2007-2017:
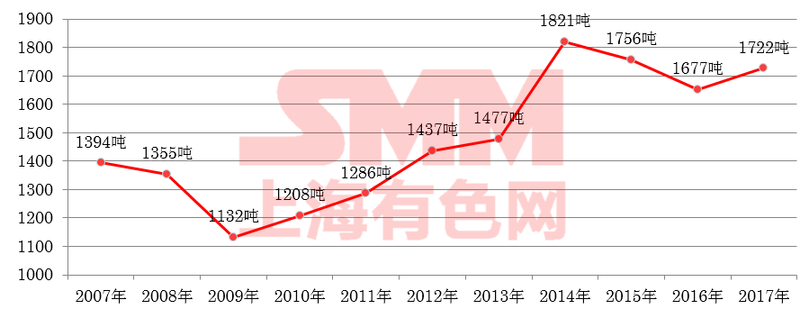
Global indium supply has risen sharply since 2009, including 151t in 2012; global indium supply has exceeded 1800 tonnes since 2014 and has since declined.
Chart of total global indium consumption, 2007-2017 (tonnes):

As can be seen from the above table: global consumption of indium has increased by 56 per cent in a decade, an increase of 589 tons.
Analysis of global total indium supply and consumption, 2007-2017 (tonnes):
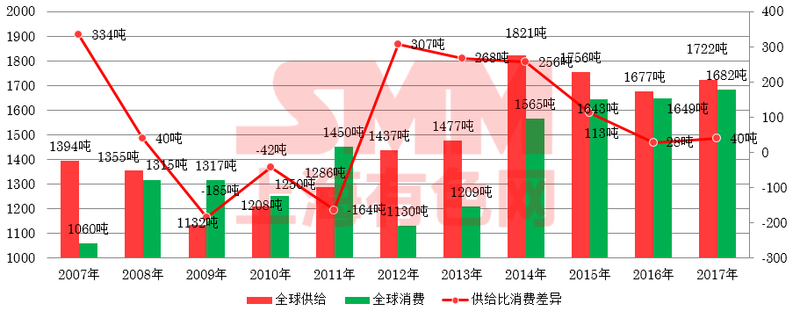
From the above table, it can be seen that supply exceeded demand in 2007-2008, especially 334 tons in 2007, less than demand in 2009-2011, and began to surplus from 2012 to 2015, but there has been a basic balance between supply and demand since 2016.
Import and export situation
Comparative table of China's unwrought indium export data by country, 2009-2017 (in tons):
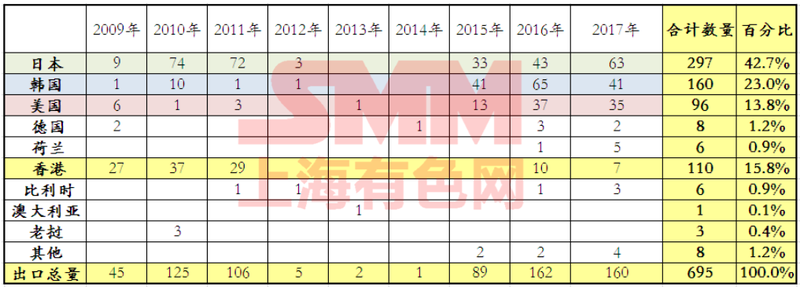
From the above table, it can be seen that China's exports were relatively large from 2009 to 2011, very small in 2012 and 2014, and began to grow sharply in 2015.
Trend chart of China's unwrought indium export price from 2007 to 2017:
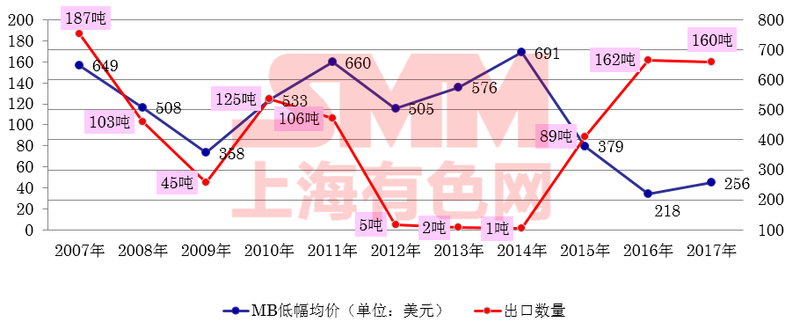
Volume and price movements were relatively consistent until 2012 and deviated significantly from 2012 to 2014. The post-2015 period is essentially the same.
Comparative table of Japan's unwrought indium imports by country, 2007-2017 (in tons):
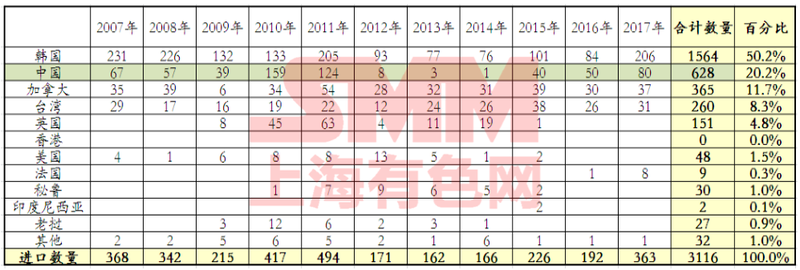
From the above table, it can be seen that Japan, the largest consumer, imports mainly from South Korea, with very little imports from China in 2012-2014, and Japan has significantly increased its purchases from China since 2015.
Trend chart of import price analysis of unwrought indium in Japan, 2007-2017:

Indium prices have fallen since hitting a 10-year high in 2014, but Japanese purchases have continued unabated.
Comparative table of import data of unwrought indium in Korea by country, 2009-2017 (in tons):
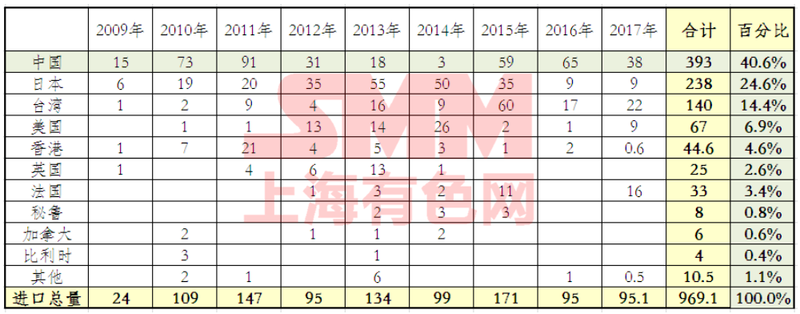
From the above table, it can be seen that after 2012, the main importer of indium in South Korea has changed from China to Japan, the total import volume is relatively large, but since 2015, it has mainly imported from China.
Trend chart of import price analysis of unwrought indium in Korea, 2009-2017:
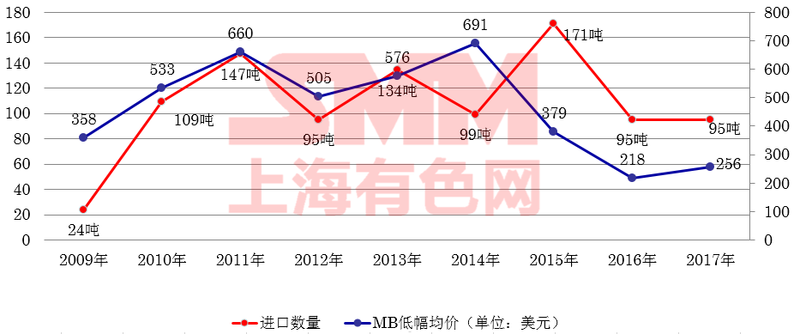
South Korean purchases are relatively consistent, but fewer at high prices in 2014.
Comparative table of unwrought indium imports in the United States by country, 2009-2017 (in tons):

United States procurement is relatively stable and Canada is the main supplier.
Trend chart of import price analysis of unwrought indium in the United States from 2009 to 2017:
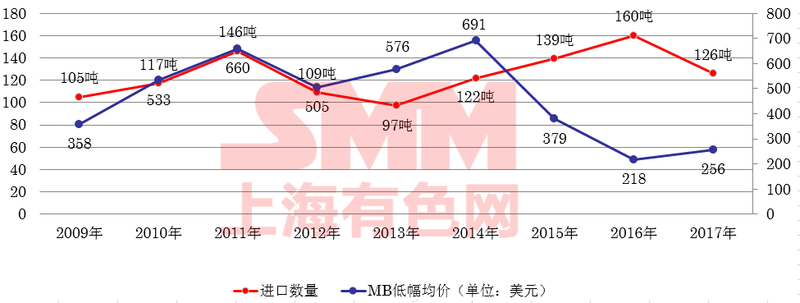
The price of indium imported from the United States is relatively stable and consistent.
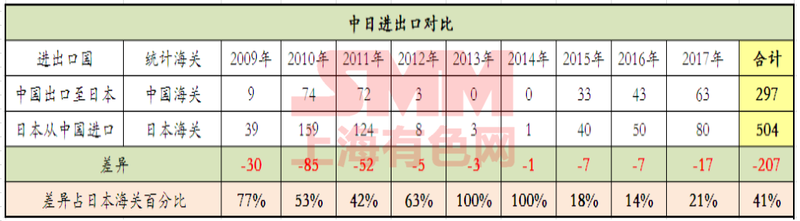
Comparative Analysis Table of unwrought Indium between China and Japan, 2009-2017 (tons):
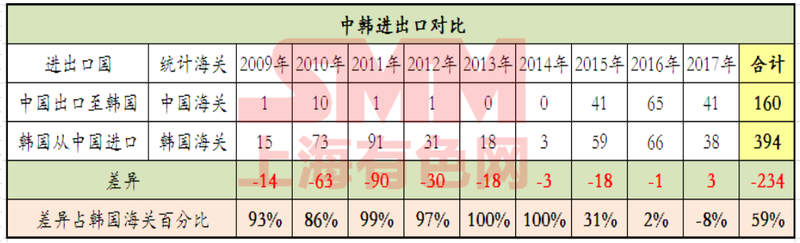
Comparative Analysis Table of unwrought Indium between China and South Korea, 2009-2017 (tons):
Comparative Analysis Table of unwrought Indium between China and the United States, 2009-2017 (tons):
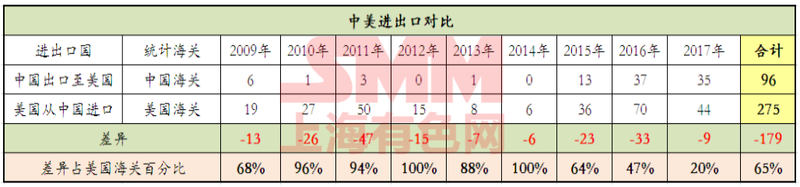
From the comparison of customs statistics in the above countries, Zhao Kefeng believes that:
There are some differences in the comparison of customs data between China, Japan, South Korea and the United States. the main reason is that China's indium is exported through abnormal channels, mainly from Japan, South Korea, Europe and the United States, as well as Hong Kong and Taiwan. Call on the industry self-discipline, legal operation; overseas businessmen purchase regular channels of goods, jointly maintain a healthy indium ingot market.
Comparative Chart of China's unwrought Indium Export data 2007-2017:
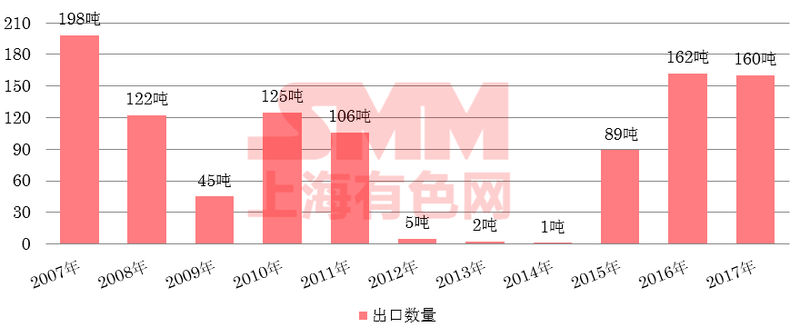
Zhao Kefeng believes that China's indium exports almost stopped between 2012 and 2014, mainly because of export tariffs and wide differences in domestic and foreign prices. Exports resumed after tariffs were lifted in 2015.
![[SMM Flash de Cromo] Previsão de demanda global de aço fica estável em 2026 com enfraquecimento da China, recuperação esperada em 2027](https://imgqn.smm.cn/usercenter/eThpo20251217171723.jpeg)
![[SMM Flash de Cromo] Exportações de minério de cromo da África do Sul caem 11% em agosto, enquanto embarques de ferrocromo se recuperam 20%](https://imgqn.smm.cn/usercenter/rUQIB20251217171723.jpeg)
![[Revisão Semanal de Cromo da SMM] Fluxos de Exportação se Recuperam com Aumento dos Estoques Portuários da China e Divergência dos Preços Africanos](https://imgqn.smm.cn/usercenter/QmrGh20251217171725.jpg)