According to SMM, the spot price of battery-grade lithium carbonate in 2026 traced a curve that first rose and then fell: the Q1 average was RMB 154,400/t; Q2 surged to RMB 171,900/t (on May 13 it briefly hit the year's high of RMB 200,500/t), marking the price peak of this round of “new cycle” recovery. In Q3, however, the price failed to hold at highs and fell to RMB 147,500/t, down 14.2% QoQ; battery-grade lithium hydroxide (coarse particles) also fell from RMB 158,400/t to RMB 135,400/t. After entering October, the decline accelerated further; on October 30, lithium carbonate spot had fallen to around RMB 90,000/t, about 38% lower than the Q3 average. The inflection point of price peaking and falling has appeared, but in the just-disclosed Q3 reports this showed a typical “lag” and “temperature gap”: because the statements reflect cumulative performance for the first three quarters, most companies still enjoy the YoY high-growth dividend from the first-half price rise; but looking only at Q3, signs of QoQ profit decline and inventory impairment have emerged. The Q3 reports are not only a summary of the first-half boom, but also a mapping of the first footprints of the cycle downturn.
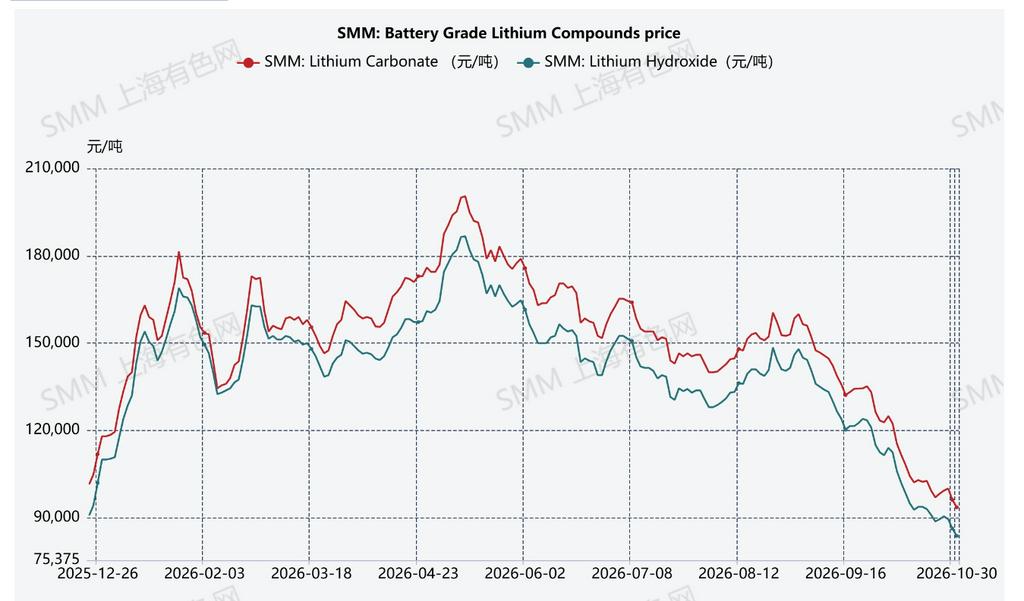
1: Quarterly average spot prices of battery-grade lithium salts (SMM, RMB/t)
I. Gradient transmission: the transmission path of price declines along the chain
By gross margin, the lithium battery chain shows a steep gradient: Tianqi Lithium's H1 overall gross margin was 64.4%, with its lithium mining business as high as 74%; Zangge Mining's lithium carbonate business gross margin was 73.3%; the lithium salt processing segment fell to 27%-42% (Ganfeng Lithium 27.4%, Chengxin Lithium 27.1%, Tianhua New Energy 35.5%); cathode materials only 5%-14%; and the battery cell segment 12%-23%. This gradient determines the order of profit sensitivity when price declines arrive.
In the Q3 single quarter, except Zangge Mining (77% of profit came from investment income from an associate copper mine), upstream companies' single-quarter net profit attributable to shareholders generally fell QoQ: Tianqi Lithium -43%, Ganfeng Lithium -68%, Tianhua New Energy -83%; Sichuan New Energy Power turned to a single-quarter loss of RMB 131 million after inventory write-downs. Divergence is also clear: Salt Lake Industry, with its own low-cost resources, fell only about -12% QoQ, and Yongxing Materials still earned RMB 419 million in the single quarter; while processors relying on purchased ore shifted directly from narrowing profits to loss provisions. Companies with their own low-cost resources showed stronger profit resilience in this price decline.
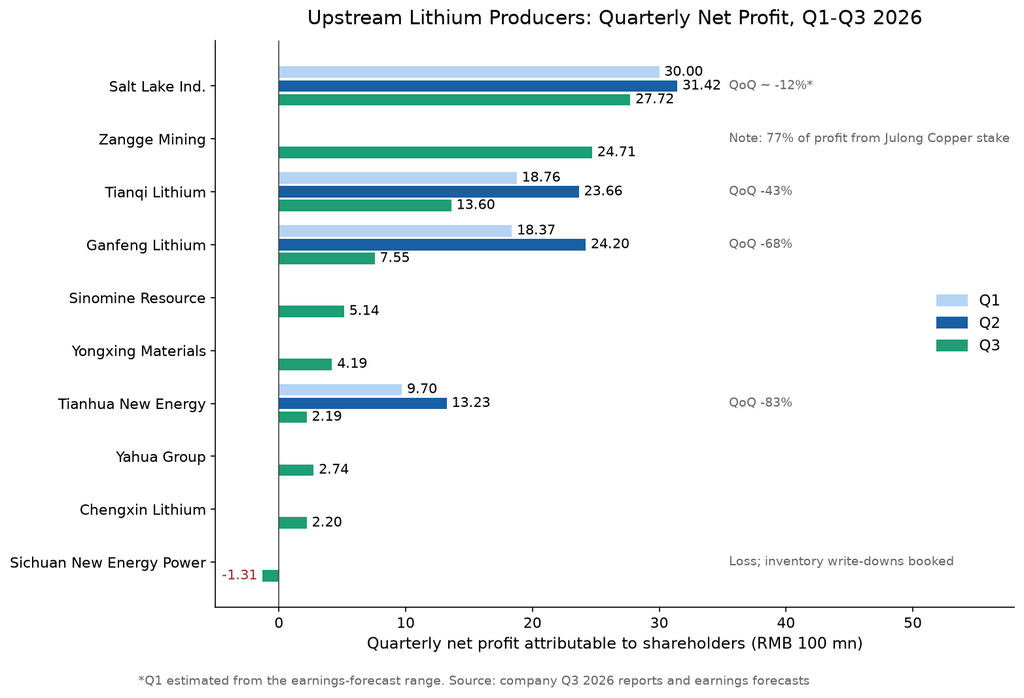
2: Single-quarter net profit attributable to shareholders of upstream resource companies (RMB 100 million)
II. Cash and inventory: a second lens beyond the income statement
More noteworthy than the QoQ profit decline is the divergence between cash flow and inventory. Dynanonic's first-three-quarter net profit attributable to shareholders was RMB 620 million, up 213% YoY, but net operating cash flow was -RMB 2.14 billion, deteriorating 106% YoY, with a single-quarter net outflow of RMB 910 million in Q3; Hunan Yuneng's book operating cash flow was -RMB 860 million (after excluding bill endorsements used to pay for long-term assets, it was actually +RMB 2.53 billion; the bill endorsement itself reflects tightening in the cash chain). The divergence between net operating cash flow and net profit shows that some profits are tied up in inventory and receivables.
Along with cash flow pressure, signs of inventory impairment have already appeared sporadically in Q3 reports: Dynanonic recorded asset impairment losses of RMB 64.7697 million in Q3 (all inventory write-downs), and inventory at the end of Q3 was RMB 2.26 billion, up 82% from the beginning of the year; Easpring recorded inventory write-down provisions of RMB 56.2195 million in the first three quarters; Ronbay Technology's inventory write-down provisions in the first three quarters were about RMB 110 million; Hunan Yuneng's inventory write-down provisions in the first three quarters were RMB 27.6937 million (the larger impairment in the same period came from bad debt provisions for receivables of RMB 260 million).
Compared with the spot price of around RMB 90,000/t at the end of October and the cost carryover at the end of September, the chain as a whole does indeed face some impairment testing pressure. But it is not one-way linear deterioration: if some companies accelerate inventory turnover in Q4, and some goods shipped at locked prices may later have impairment reversals, the scale of impairment in the annual report season will depend on actual selling prices and contract execution. The write-down provisions in the Q3 reports are an interim reflection based on market prices at the end of September; subsequent assessment still needs to combine the Q4 price path and turnover pace.
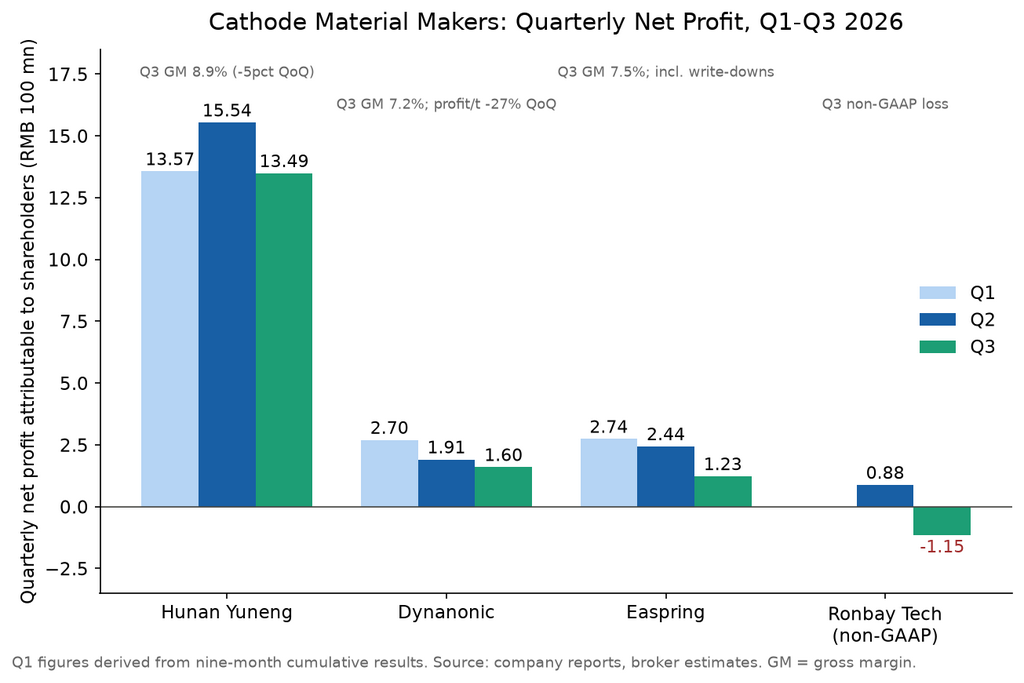
3: Single-quarter net profit attributable to shareholders of cathode material companies (RMB 100 million)
Another signal comes from the battery cell end. CATL's operating cash flow contracted noticeably in Q3; the company explained it as actively shortening supplier payment terms and increasing prepayments and R&D funding support. The battery leader's concessions to upstream through payment terms and funding support both explain the decline in its single-quarter gross margin from 23.15% to 20.69% and reflect the return of bargaining power in the chain from upstream to mid- and downstream.
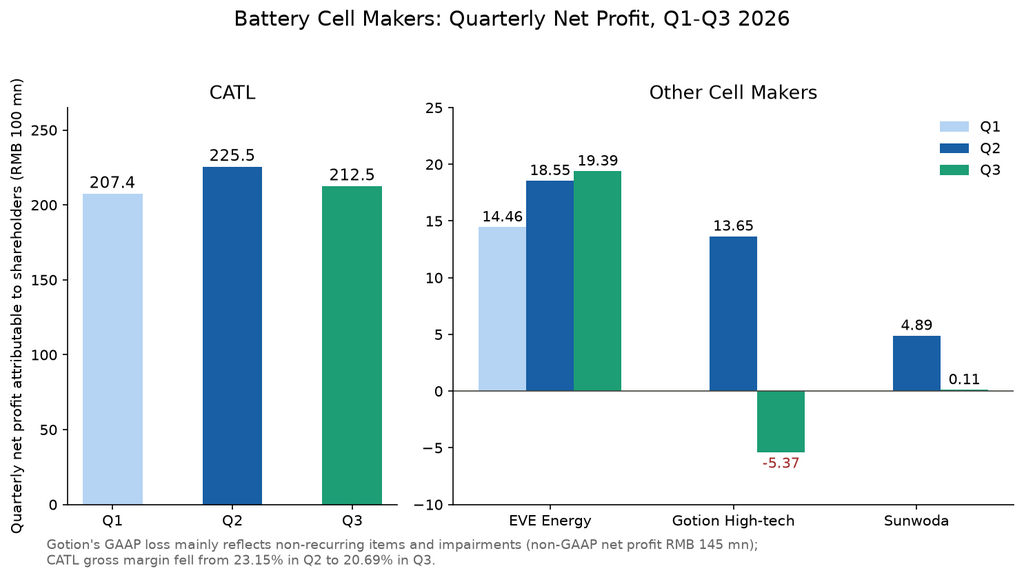
4: Single-quarter net profit attributable to shareholders of battery cell companies (RMB 100 million)
III. From capacity expansion realization to volume-price rebalancing: measurement conditions
From single-quarter sales in the Q3 reports, some companies did achieve impressive growth curves: Zangge Mining's Q3 lithium carbonate sales rose 93% QoQ; Hunan Yuneng's single-quarter sales were 449,000 t, up 47.5% YoY; Dynanonic's shipments rose 15% QoQ. But this was not simply a forced strategy to hedge price declines. From the industry rhythm, Q3 itself was the ramp-up period for some new capacity in the chain, superimposed on high demand and high expectations at the time for the peak season and overseas export front-loading; it was essentially the realization of expansion plans within the new cycle.
The real stress test occurs in Q4. As lithium carbonate spot prices broke below RMB 100,000/t and approached RMB 90,000/t, prices have fallen by about one-third from the Q3 average of RMB 147,500/t. If companies try to rely on “volume to offset price” to maintain revenue scale, sales would need to achieve nearly 50% QoQ growth, which is extremely difficult under current capacity utilization and demand conditions.
From the latest production schedule tracking, demand-side signals are also changing in Q4. The power battery cell segment is overall flat, slightly up, or slightly down in Q4, with obvious year-end destocking; earlier, high inventory led leading companies to cut production schedules; LFP cathode material growth declined, and ternary cathode materials clearly pulled back; although energy storage cell schedules still maintained slight gradual growth, they are difficult to fully offset weakness in the power battery end. This means that the volume-growth logic faces objective constraints after the peak season tops out, and the probability that Q4 becomes the lowest point of full-year reported profit rises.
IV. Structural variables in the price decline
This downturn is not a broad-based decline. The energy storage segment is currently a relatively strong hedge variable in the chain: EVE Energy's first-three-quarter energy storage battery shipments were 67.5GWh, up 39% YoY, and Q3 net profit attributable to shareholders rose 4.5% QoQ against the trend. From high-frequency data, domestic utility-scale storage utilization rates remain high and demand is stable; energy storage cell schedules are relatively steady among all segments (maintaining slight QoQ growth from October to December), showing a certain independent trend. In addition, some auxiliary materials and specialty materials segments have better profitability due to supply consolidation or specific supply-demand mismatches, e.g., VC additive prices rose 53% cumulatively in Q3, and Huasheng Lithium's single-quarter net profit was RMB 313 million, up 800.58% YoY.
The decline in lithium prices redistributes profits along the chain: purchased-ore smelting is hit first; integrated leaders contract but remain generally stable; cathode materials are affected by high-priced inventory; the battery cell segment gains a cost dividend. The variables determining corporate divergence are shifting from price direction to resource endowment, inventory management, and cash flow discipline.
V. Conclusion and Q4 outlook
Looking ahead to Q4, three industry clues are worth tracking: first, against the backdrop of continued supply increases in the upstream lithium salt segment, inventory accumulation, and pressure on purchased-ore profitability, the actual scale of inventory write-downs and impairment provisions, especially for companies with a high proportion of purchased ore; second, after demand in cathode materials and other segments falls back and adjusts, the chain's destocking progress and subsequent downside risk to production schedules, especially midstream segments affected by tight copper foil supply and downstream price pressure; third, the transmission effect of battery leaders' production schedule cuts to midstream material production schedules. When the battery cell end begins to use cash flow to maintain the industrial ecosystem, the cycle position is often deeper than prices show. The lithium price bottom has not yet been confirmed, but the chain's financial statements have already priced in the downturn ahead of prices.