Around October 20, 2026, import and export data for cobalt- and lithium battery–industry-chain products for September were released in a concentrated manner. The data showed that, for spodumene concentrates, China’s spodumene imports in September 2026 were 970,100 mt in physical content, equivalent to approximately 81,300 mt LCE. For lithium carbonate, China imported 28,826 mt of lithium carbonate in September, down 5% MoM and up 47% YoY. Among them, lithium carbonate imports from Chile were 18,521 mt, accounting for 64% of total imports. From January to September, China’s cumulative lithium carbonate imports totaled 265,000 mt, up 53% YoY on a cumulative basis...... SMM compiled the import and export situation of battery materials from January to September, as follows:
Upstream
Lithium concentrates
According to a summary of China Customs detailed data, China’s spodumene imports in September 2026 were 970,100 mt in physical content, compared with 906,600 mt in Augustup about 7.0% MoM; based on estimates using this classification as well as grade, moisture content, and unit consumption parameters,this was equivalent to approximately 81,300 mt LCE.
By source country, imports from Australia, Nigeria, and Zimbabwe increased significantly: imports from Australia were 446,200 mt, up about 36.7% MoM, remaining the largest source country with a share of about 46.0%; imports from Nigeria were 189,800 mt, up about 40.1% MoM, rising to the second-largest source country; imports from Zimbabwe were 136,500 mt, up about 83.0% MoM. Imports from South Africa were 112,400 mt, down about 49.6% MoM; imports from Brazil were 81,200 mt, up about 30.9% MoM. In addition, imports from Burundi were about 1,800 mt, Rwanda about 1,300 mt, and Mozambique about 1,000 mt, while imports from Zambia and Somalia were relatively small; no import records from Mali and Canada appeared in this month’s details.
Overall, spodumene imports in physical content continued to increase in September, and the import structure tilted toward concentrates. Under this screening methodology, concentrates imports were about 688,800 mt, accounting for 71.0% of total physical imports, higher than 60.7% in August; raw ore imports were about 281,300 mt. Increased concentrates imports from Australia, Zimbabwe, and Nigeria offset the impact of reduced imports from Mali and Canada, becoming the main support for the growth in imported lithium resources supply this month.
In terms of spodumene concentrates (CIF China) quotations, according to SMM spot quotes, spodumene concentrates (CIF China) quotations in September generally drifted lower amid consolidation. As of September 30, the spot quotation for spodumene concentrates (CIF China) fell to $1,735/mt, a decline of 23.4% from early September.
According to SMM, in September, the spot theoretical profit from externally purchased spodumene concentrates remained in loss, with the loss widening further from August. Spodumene ore prices eased somewhat, but the decline was far smaller than that of lithium carbonate, as ore-side price adjustments lagged relatively behind, keeping processing spreads compressed at low levels. In September, the spot theoretical profit from externally purchased lepidolite concentrates swung wildly, with the midpoint shifting lower. There was a slight profit at the start of the month, but lithium chemical prices then accelerated downward while lepidolite ore prices adjusted with a lag, quickly pushing profits into negative territory and hitting bottom; although there was a brief recovery mid-month, profits pulled back again at month-end. Overall, the spot economics of the lepidolite route weakened notably.
Entering October, spot quotes for spodumene concentrates (CIF China) continued to move lower, holding steady over recent trading days. As of October 21, spot quotes for spodumene concentrates (CIF China) held steady at $1,505/mt.
Lithium Carbonate
In September, China imported 28,826 mt of lithium carbonate, down 5% MoM , up 47% YoY. Of this, imports from Chile were 18,521 mt, accounting for 64% of total imports; imports from Argentina were 7,607 mt, accounting for 26% of total imports. The two countries together accounted for about 90%, with the import source structure remaining stable. In January-September, China's cumulative lithium carbonate imports reached 265,000 mt, up 53% YoY.
In September, China exported 224 mt of lithium carbonate, down 14% MoM and up 49% YoY. In January-September, China's cumulative lithium carbonate exports were 3,045 mt, down 10% YoY.
In September, China imported 14,154 mt of lithium sulfate, up 61% MoM and up 163% YoY. In January-September, China's cumulative lithium sulfate imports reached 123,700 mt, up 79% YoY. Of this, imports from Chile were 12,936 mt and imports from Zimbabwe were 1,218 mt.
On lithium carbonate prices, SMM spot quotes show that domestic spot lithium carbonate prices drifted lower overall in September, briefly stabilizing mid-to-late month before pulling back again, falling to 122,800 yuan/mt at month-end, down about 23.3% from the start of the month.
From a fundamental perspective, on the supply side in September, production gradually recovered as lithium chemical plants using spodumene completed maintenance and resumed production, and raw materials arrived at ports. On the demand side, downstream cathode plants concentrated their pre-holiday stockpiling for the October peak season and holidays early in the month, showing strong dip-buying interest but limited acceptance of high prices. Mid-to-late month, dip-buying restocking and upstream holding back from selling provided phased support for spot prices; as the National Day and Mid-Autumn holidays approached, pre-holiday stockpiling gradually wound down, with some material plants turning cautious and waiting for early-month contract deliveries. Market transaction pace slowed, and lithium carbonate prices came under pressure again and moved lower.
Entering October, battery-grade lithium carbonate edged up briefly after the National Day holiday before entering a downward trajectory again. As of October 22, spot quotes for battery-grade lithium carbonate fell to 99,350 yuan/mt, with the average price breaking below the 100,000 yuan/mt mark.
Lithium Hydroxide
According to China Customs data, China's lithium hydroxide imports in September 2026 were 7,406.80 mt, up 44.8% MoM from 5,115.17 mt in August; exports were 10,007.17 mt, up 109.0% MoM from 4,789.36 mt in August. Lithium hydroxide shifted to a net export position for the month, with net exports of about 2,600.37 mt, compared with net imports of 325.81 mt in August, marking a directional shift in the import-export structure.
On the import side, the source structure saw a notable rotation in September. Indonesia remained the largest source, with imports of 4,713.52 mt for the month, accounting for 63.6% of total imports, up 81.8% MoM from 2,592.19 mt in August, as the clearing of previously accumulated cargoes accelerated again in September. Germany jumped to the second-largest import source, with imports from Germany of 1,320.02 mt, up 214.3% MoM from 420.00 mt in August, with its share rising to 17.8%. This jump corresponds directly with the pace of production ramp-up in European lithium chemical processing capacity: the Bitterfeld refinery in Germany has continued to increase battery-grade lithium hydroxide output, sending tonne-level samples to major European cathode material producers for customer certification, and plans to gradually approach full-capacity operation in H2 2026, with commercial volumes beginning to enter cross-border circulation. Among other sources, imports from Australia were 838.42 mt, from South Korea 385.83 mt, and from Argentina 140 mt, all relatively limited in volume.
On the export side, September's total volume broke through 10 kt, more than doubling from August. South Korea remained the largest destination, with exports of 6,434.58 mt for the month, accounting for 64.3% of total exports, up 104.8% MoM from 3,142.11 mt in August; exports to Japan were 2,038 mt, accounting for 20.4%, up 87.4% MoM. More significant at the margin was the Poland direction: exports for the month were 1,098.12 mt, accounting for 11.0%, up 205.0% MoM from 360.04 mt in August, making it a top-ranked major export destination for the second consecutive month. The sustained volume growth to Poland coincides with the concentrated commissioning of local cathode material capacity—the first phase of a Chinese-invested cathode material enterprise's 25,000 mt ternary cathode project in Poland has entered the final construction and commissioning stage, with localized delivery capacity in Europe about to come online; meanwhile, a cathode material project jointly invested by a leading European cathode producer and a European automaker is also planned to start production in Poland in H1 2026, further lifting phased stockpiling demand for lithium hydroxide in the Central and Eastern European cathode segment. Among other destinations, the Netherlands was 272.01 mt, Indonesia 60 mt, and Thailand 36 mt, all relatively small in volume.
Overall, the core change in September's lithium hydroxide imports and exports lay not in the two-way rebound in total volumes, but in the rebalancing of flow structures. On the import side, the concentrated arrival of Indonesian cargoes remained the main driver of total volume growth, but the rapid growth from Germany suggests that European lithium chemical capacity is transitioning from the certification stage to commercial circulation. Although the full-production timing has been pushed back from the original plan, its marginal supply is already reflected in China's import source structure. On the export side, the replenishment from South Korea and Japan formed the base for the doubling, while the sustained volume growth to Poland points to a more structural signal: the concentrated commissioning of cathode material capacity in Central and Eastern Europe is elevating Poland from a marginal destination to a frontier observation window for European lithium hydroxide demand. In the short term, the actual pace of European lithium chemical production ramp-up and the sustainability of China's exports to Poland will be the two key variables in determining whether lithium hydroxide trade flows enter a new round of rebalancing.
Battery Materials
LiPF6
According to China Customs data, in September 2026, China's cumulative LiPF6 exports were about 938.5 mt, down about 17% MoM, while China's cumulative LiPF6 imports were about 18 mt.
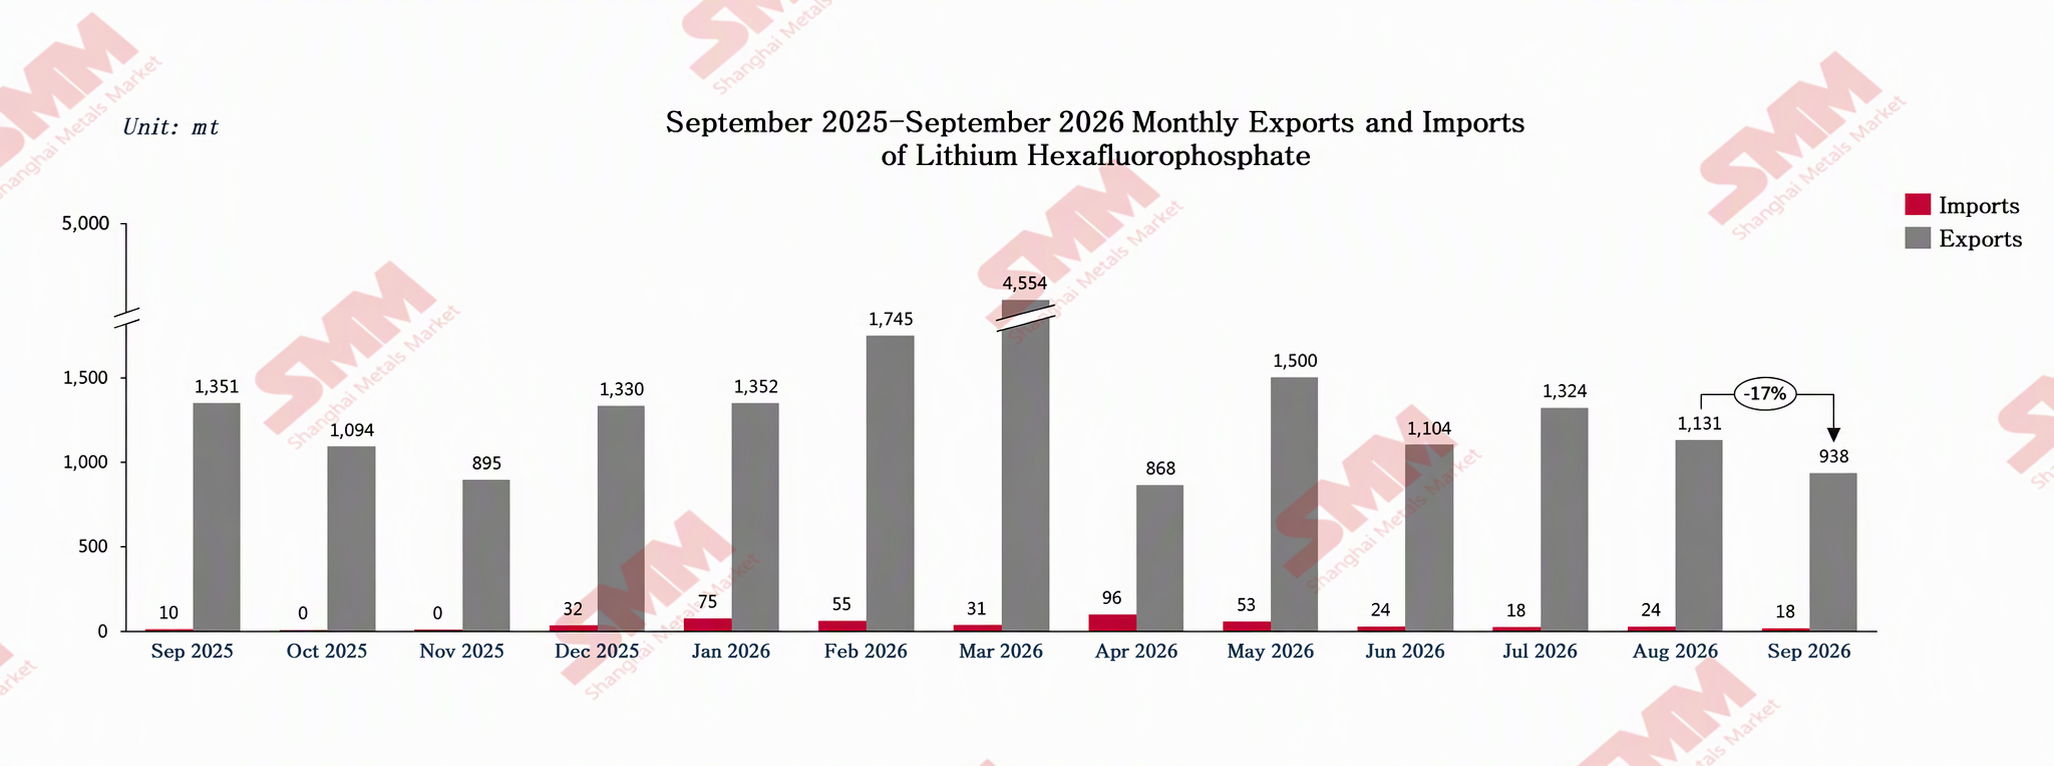
On the export side, China's LiPF6 exports in September 2026 were about 938.5 mt, down about 17% MoM from August and down about 30.5% YoY. Specifically, this month's LiPF6 was mainly exported to South Korea, Poland, Hungary, the US, and other countries. Exports to South Korea were 375.016 mt, up about 30.38% MoM; exports to Poland were 150.013 mt, down about 19.27% MoM; exports to Hungary were 129.001 mt, down about 21.82% MoM; exports to the US were 63.542 mt, down about 74.33% MoM.
Overall, overseas procurement volume of LiPF6 saw a slight decline in September.
Flake Graphite
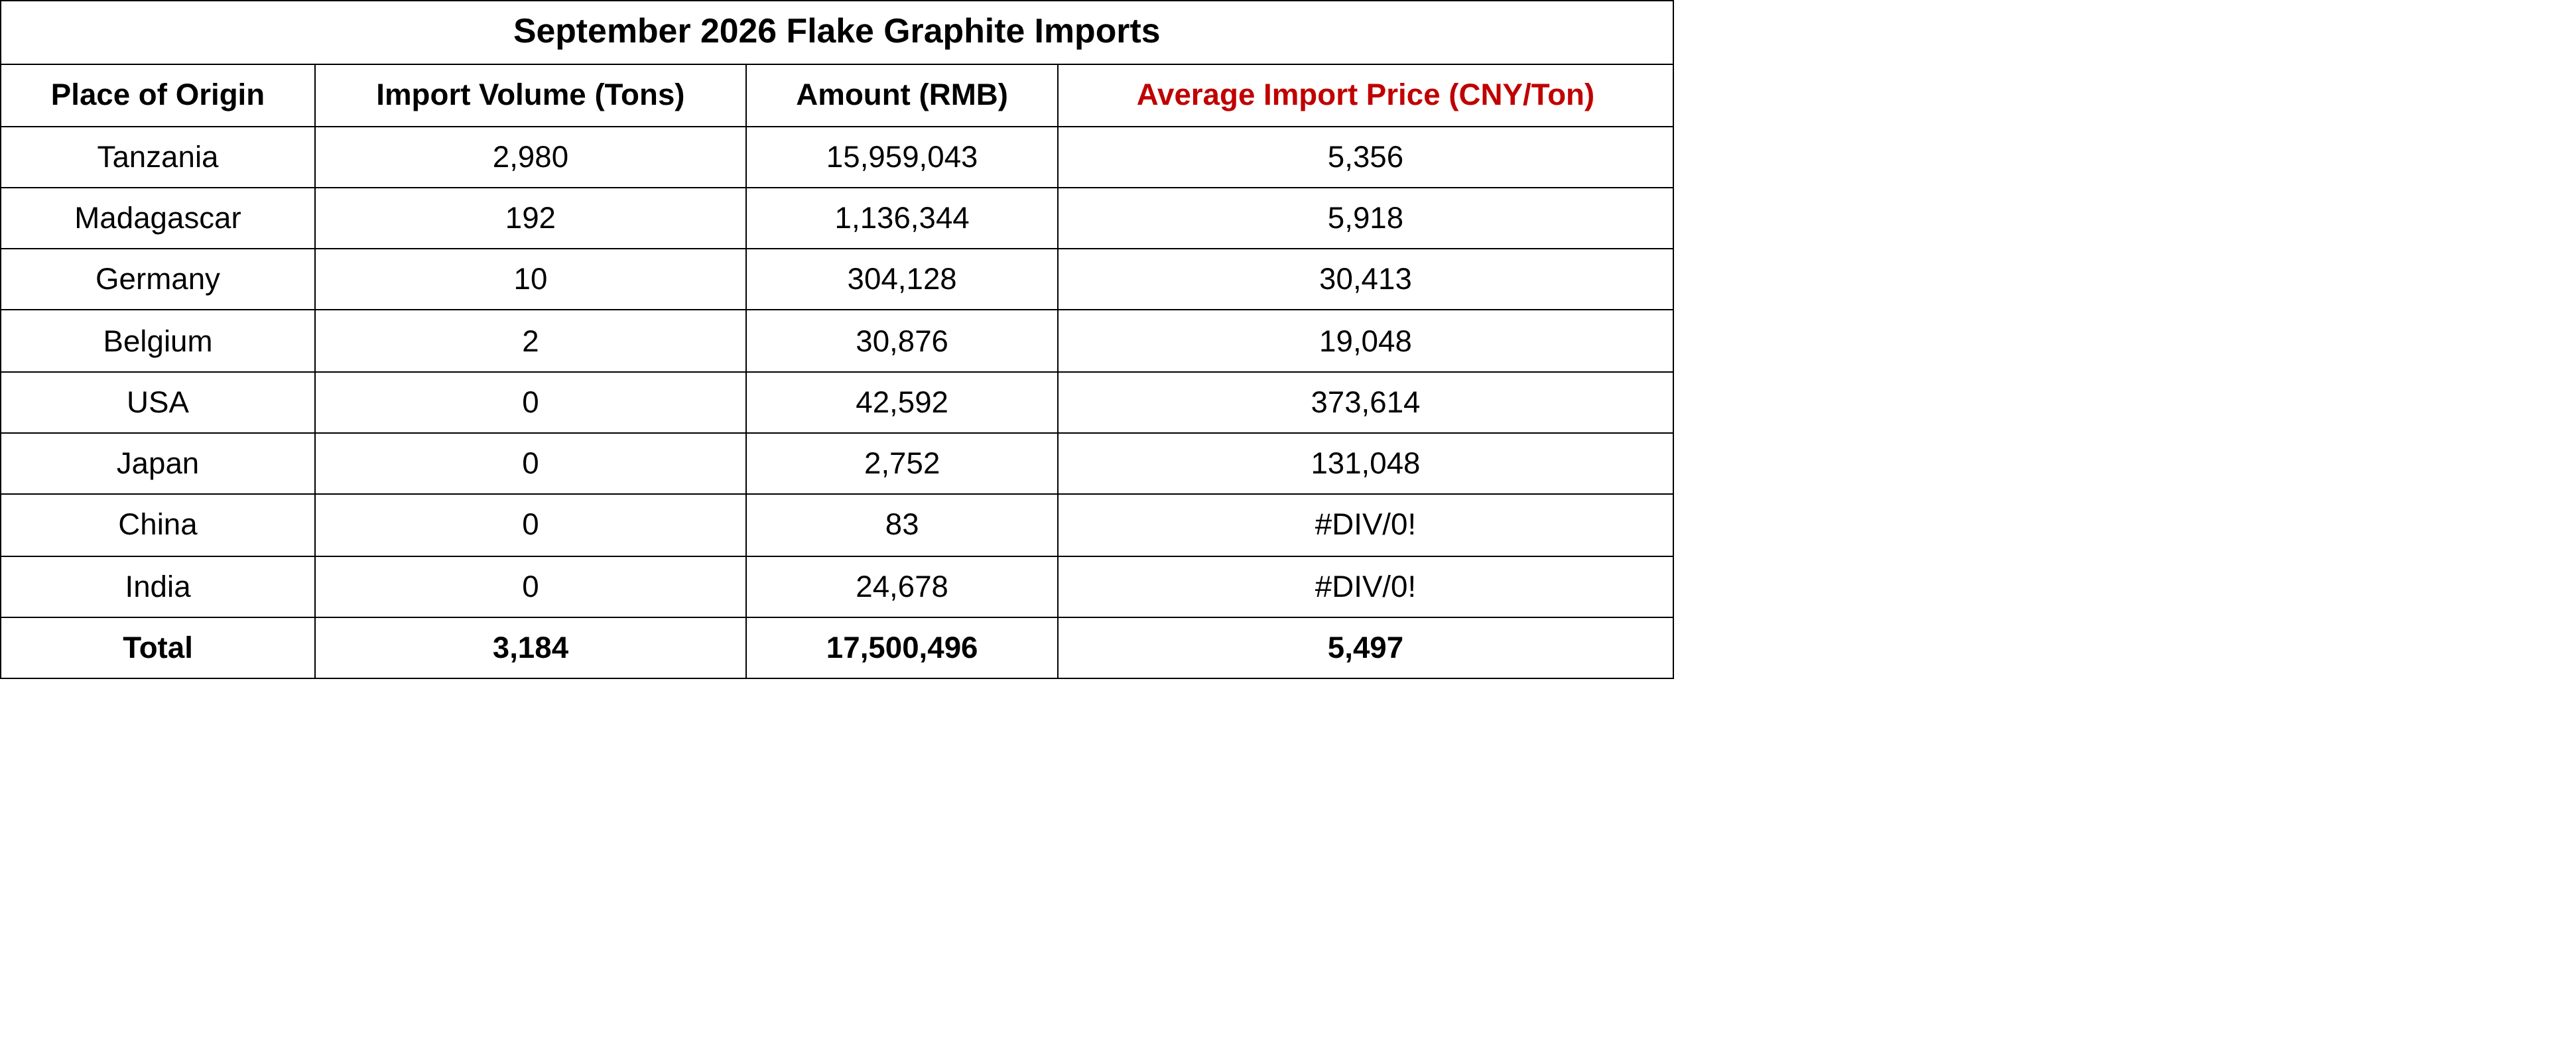
In September 2026, China's flake graphite imports reached 3,184 mt, down 66% MoM and up 35% YoY.
Source: China Customs, SMM
In September 2026, on the export side, monthly exports were 6,221 mt, down 2% MoM and up 5% YoY.
Looking at the export destination structure, Europe was the strongest engine driving this round of export growth , with some countries in Asia and Africa (mainly new additions from zero) also providing incremental support. Among them, Italy pulled up by 158.8 mt MoM, becoming the largest incremental country in Europe for the month; the UK, Russia, and Vietnam pulled up by 226 mt, 40 mt, and 18 mt MoM respectively; Iran edged up by 6 mt MoM; and the US in North America exported 1,522.62 mt this month, edging up by 42.62 mt MoM. In contrast, multiple Asian countries became severe drags , with South Korea down 528.035 mt MoM, the largest absolute decline in the table, Indonesia down sharply by 425.395 mt, Japan down 106.128 mt, and Malaysia down 4.502 mt. In addition, some markets on other continents also showed declines, with Canada in North America down 77.566 mt MoM and Spain in Europe down 68 mt.
Artificial Graphite
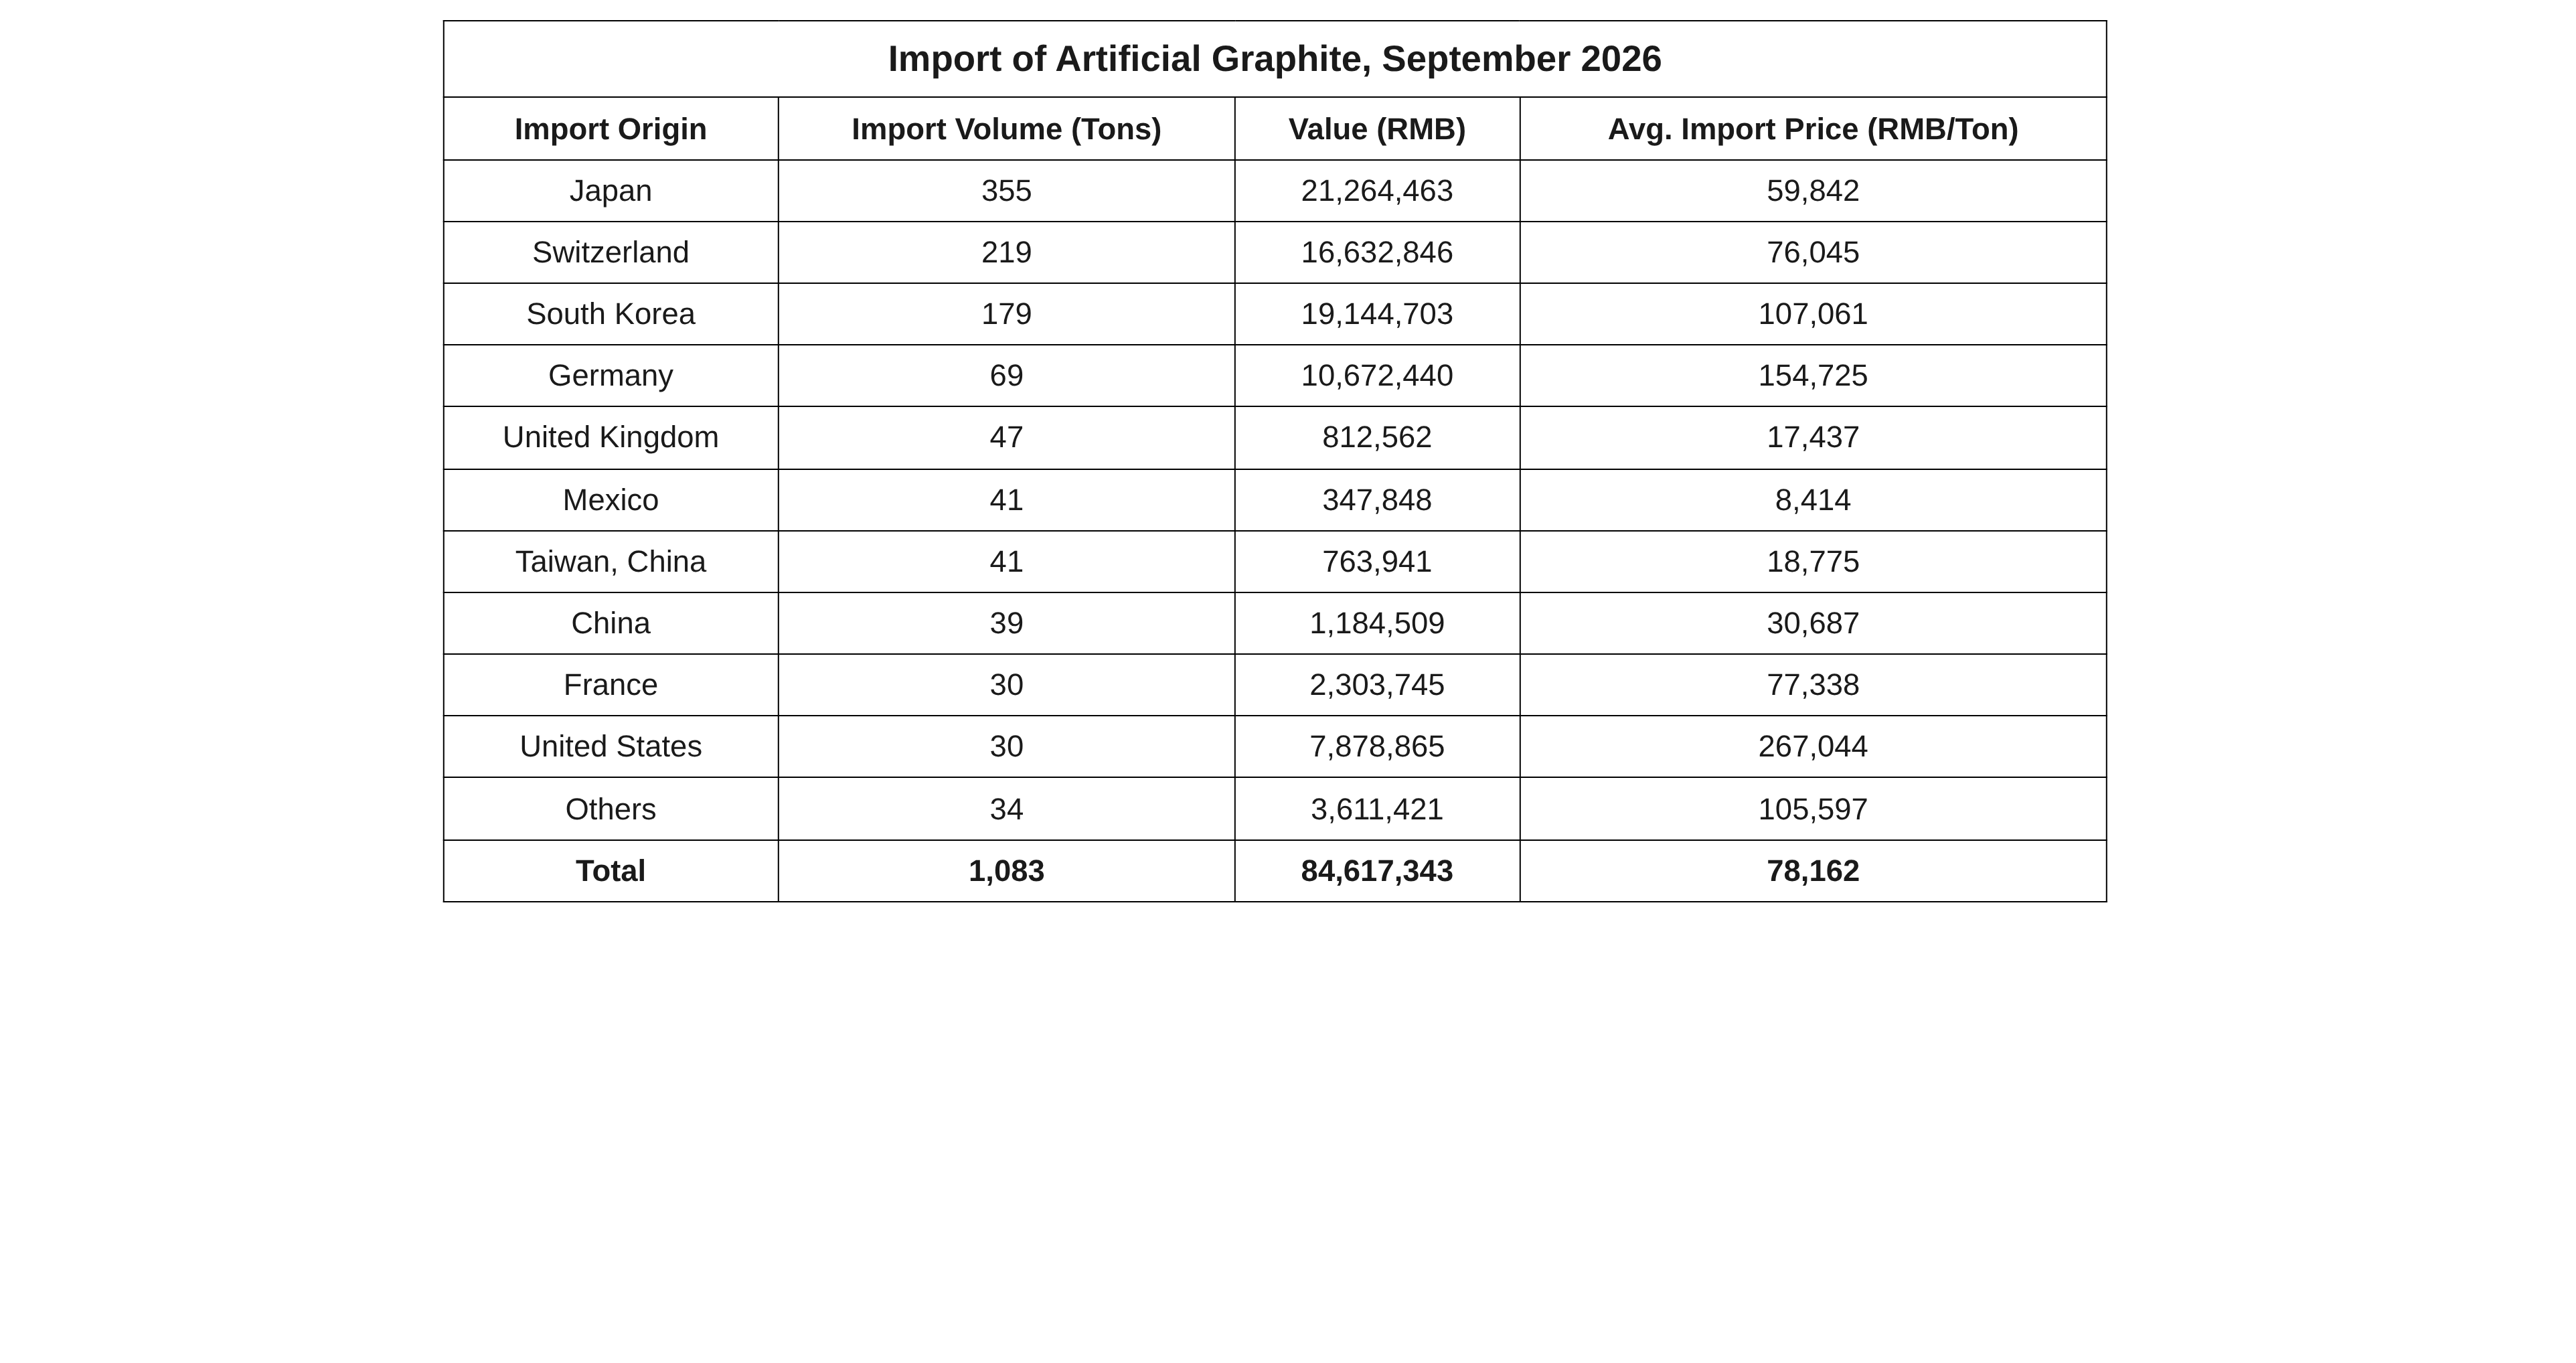
In September 2026, China's artificial graphite imports were 1,083 mt, up 70% MoM and down 2.5% YoY. On import average prices, in September 2026, China's artificial graphite import average price was 78,162 yuan/mt, up 32.6% MoM and up 41.9% YoY.
Source: China Customs, SMM
In September 2026, China's artificial graphite exports were 52,660 mt, down 9% MoM and down 6.2% YoY. On export average prices, in September 2026, China's artificial graphite export average price was 11,253 yuan/mt, up 36.8% MoM and up 31.3% YoY.
On the export side, by trading partner, Asia was the largest growth engine, but with extreme internal divergence. Among them, Malaysia surged 173% MoM (824 mt → 2,248 mt), making it the largest single-market increment for the month; South Korea was up 32% MoM, Thailand up 24% MoM, Indonesia up 42% MoM, and Japan and other East and Southeast Asian markets all expanded across the board. However, South Asia showed a cliff-like leading decline, with India (11,117 mt → 6,715 mt, down 40% MoM) posting a reduction of as much as 4,402 mt, becoming the core factor dragging down the overall market. In the Middle East, Turkey was down 43% MoM. The European market showed mixed performance, with the Czech Republic and Poland as the main European growth drivers; however, Spain and the UK posted MoM declines, creating a severe drag. North America contracted overall, with the US being the largest declining major market in North America (5,892 mt → 5,427 mt, down 8% MoM).
Among the top five domestic exporting provinces, three achieved positive MoM growth , with one province posting a doubling-style surge of 86% and another recording solid growth of 38%.
Phosphate Ore
In August 2026, China's phosphate ore imports briefly showed signs of "recovery" in the import market, with 116,000 mt and a MoM surge of 563.2%. However, one month later, September imports were knocked back to 22,000 mt, down 81.3% MoM, only slightly above July's 17,000 mt, a near three-year low. The August volume surge failed to form a trend, appearing more like a pulse driven by a policy window and a low base, rather than a signal of genuine demand improvement.
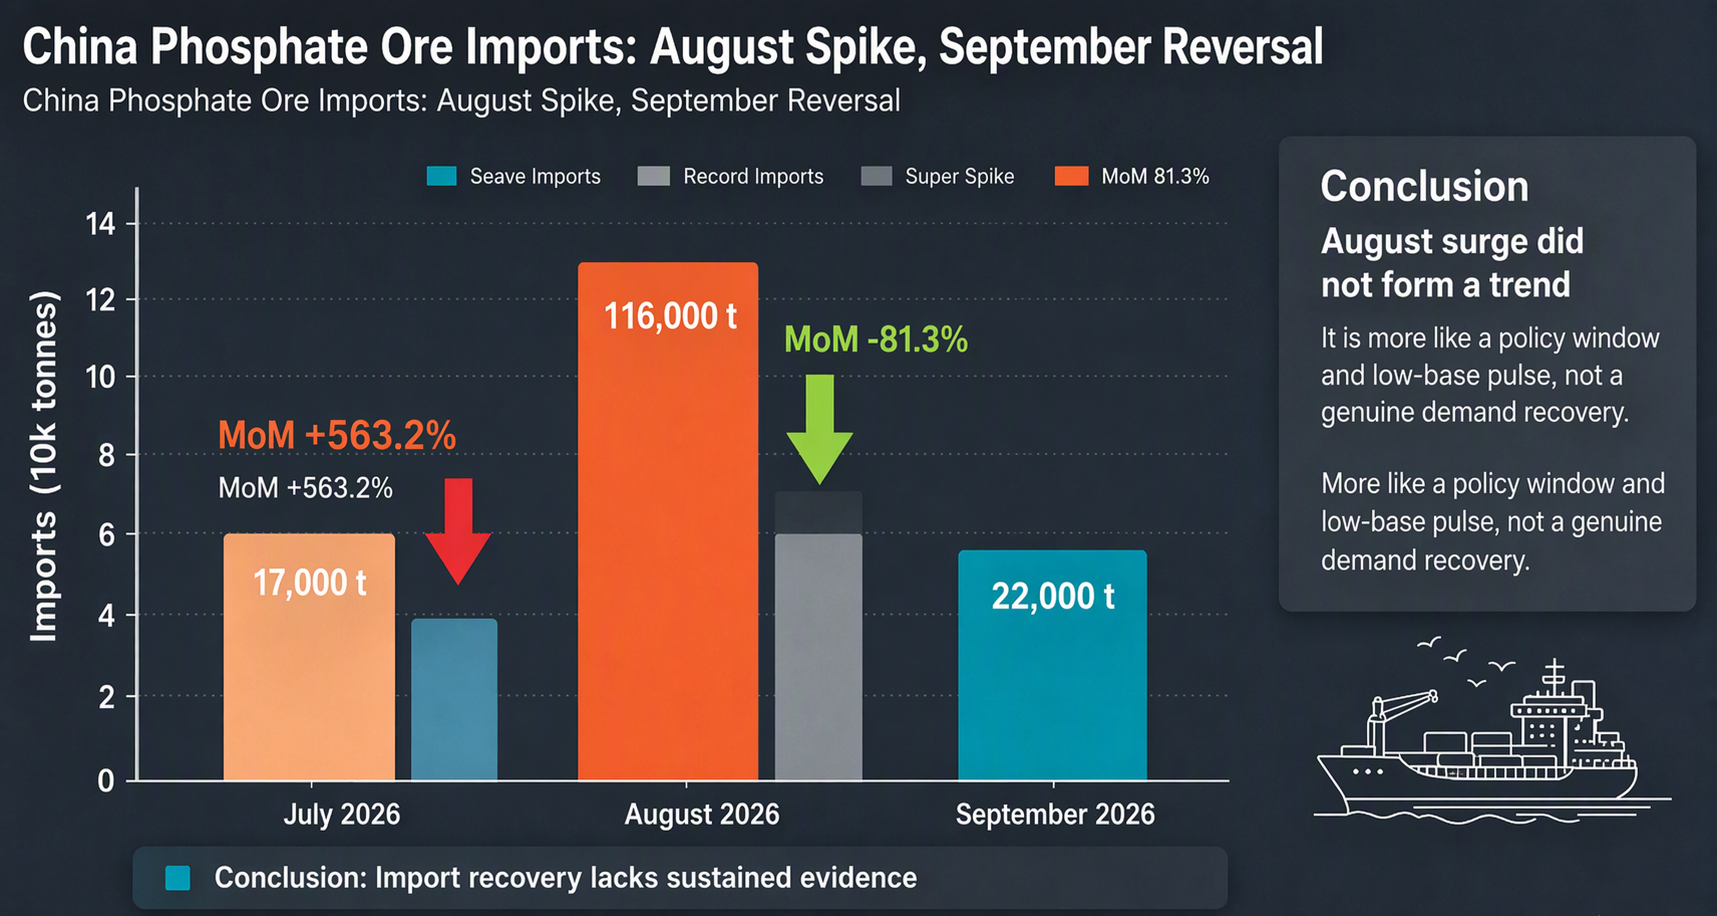
The September import decline of over 80% MoM appeared on the surface to be a natural pullback after concentrated arrivals in August, but the deeper pressure came from the continued contraction in downstream demand. Operating rates at ammonium phosphate and phosphate chemical enterprises remained low, with procurement mainly for immediate needs, sluggish inquiries for imported ore, and insufficient restocking willingness. Persistently high sulfur prices pushed up phosphate fertiliser production costs, forcing enterprises to proactively cut operating rates, which in turn narrowed procurement demand for phosphate ore. The domestic phosphate ore market itself was in a state of "weak supply and demand, stagnant stalemate," leaving imported ore without a basis for volume growth.
In other words, September's data was not an "anomaly" but rather a return to the normal level of phosphate ore imports seen in 2026. The 116,000 mt in August appeared abrupt precisely because it reflected the convergence of multiple one-off factors—low-base recovery, port arrivals during the ban window, and the resumption of Jordanian supply—all of which faded simultaneously in September.
......
September's import figure of 22,000 mt should not be read simply as an isolated "MoM plunge." It was a natural regression after the one-off August spike faded, and more importantly, the combined result of three constraints: sluggish downstream operating rates, just-in-time import procurement, and highly concentrated supply sources. The low-volume pattern of phosphate ore imports will most likely persist until substantive recovery emerges on the demand side. What the market needs to watch is not the month-to-month swings in import figures, but rather when phosphate fertiliser and phosphate chemical operating rates show a trend-based rebound, as well as marginal changes in supply stability from Egypt and Jordan—these two factors are the real variables that will determine whether imports can break out of the "20,000 mt-level" range.
Sulphur & Sulphuric Acid
In September 2026, China's monthly sulphur imports totalled 140,866.876 mt in physical content, down 48.27% MoM and down 82.24% YoY. Major import sources were South Korea, Japan, Kazakhstan, Vietnam, Brunei, and Saudi Arabia. January-September cumulative imports reached 3.06 million mt, down 61.8% YoY, with the largest suppliers being South Korea (668,900 mt), Oman (471,700 mt), the UAE (463,500 mt), and Canada (432,000 mt).
China's monthly sulphur exports totalled 10 mt in physical content, down 79.17% MoM and down 97.47% YoY, with Vietnam as the sole destination. January-September cumulative exports reached 39,283 mt, up 1,164.61% YoY, with Tanzania (35,757 mt) as the largest destination.
China's monthly sulphuric acid imports totalled 1,701.319 mt in physical content, down 82.88% MoM and down 79.69% YoY, with import sources including Taiwan, China, South Korea, Germany, Japan, and the US. January-September cumulative imports reached 16,101 mt, down 18.90% YoY, with the largest suppliers being South Korea (69,900 mt) and Taiwan, China (6,173 mt).
China's monthly sulphuric acid exports totalled 33,873.364 mt in physical content, up 1,268.927% MoM and down 92.13% YoY. Major export destinations were Chile, Angola, Cambodia, Ghana, Singapore, Hong Kong, China, Zimbabwe, and Thailand. January-September cumulative exports reached 821,684 mt, down 76.42% YoY, with the largest destinations being Indonesia (219,400 mt), Chile (175,700 mt), Saudi Arabia (103,000 mt), and India (102,400 mt).
Cobalt
Cobalt Hydrometallurgy Intermediate Products
Imports: Delayed Cargoes Concentrated in Bonded Warehouses, Share of Bonded Imports Jumped
This month, approximately 9,160 mt in physical content of intermediate products imported by China from the DRC entered Zhejiang and Guangdong provinces via Entrepot Trade by Customs Special Control Area, accounting for 65.5% of China's total imports. Ordinary Trade accounted for approximately 3,777 mt in physical content, or 27.0%, while processing trade with imported materials accounted for approximately 683 mt in physical content, or 4.9%. In addition, China imported approximately 341 mt in physical content of intermediate products from Russia via processing trade with imported materials this month, and approximately 27 mt in physical content from South Africa via Ordinary Trade. From a structural perspective, this month's import rebound was almost entirely driven by the release of bonded logistics cargoes: September bonded imports increased approximately 1.5x from 3,682 mt in physical content in August, with the share jumping from 46.8% to 65.5%. Meanwhile, Ordinary Trade imports remained basically flat MoM at approximately 3,800 mt in physical content, indicating that smelters' just-in-time procurement has not improved significantly, and arriving cargoes were predominantly placed into warehouses for observation, with limited volumes actually entering domestic circulation.
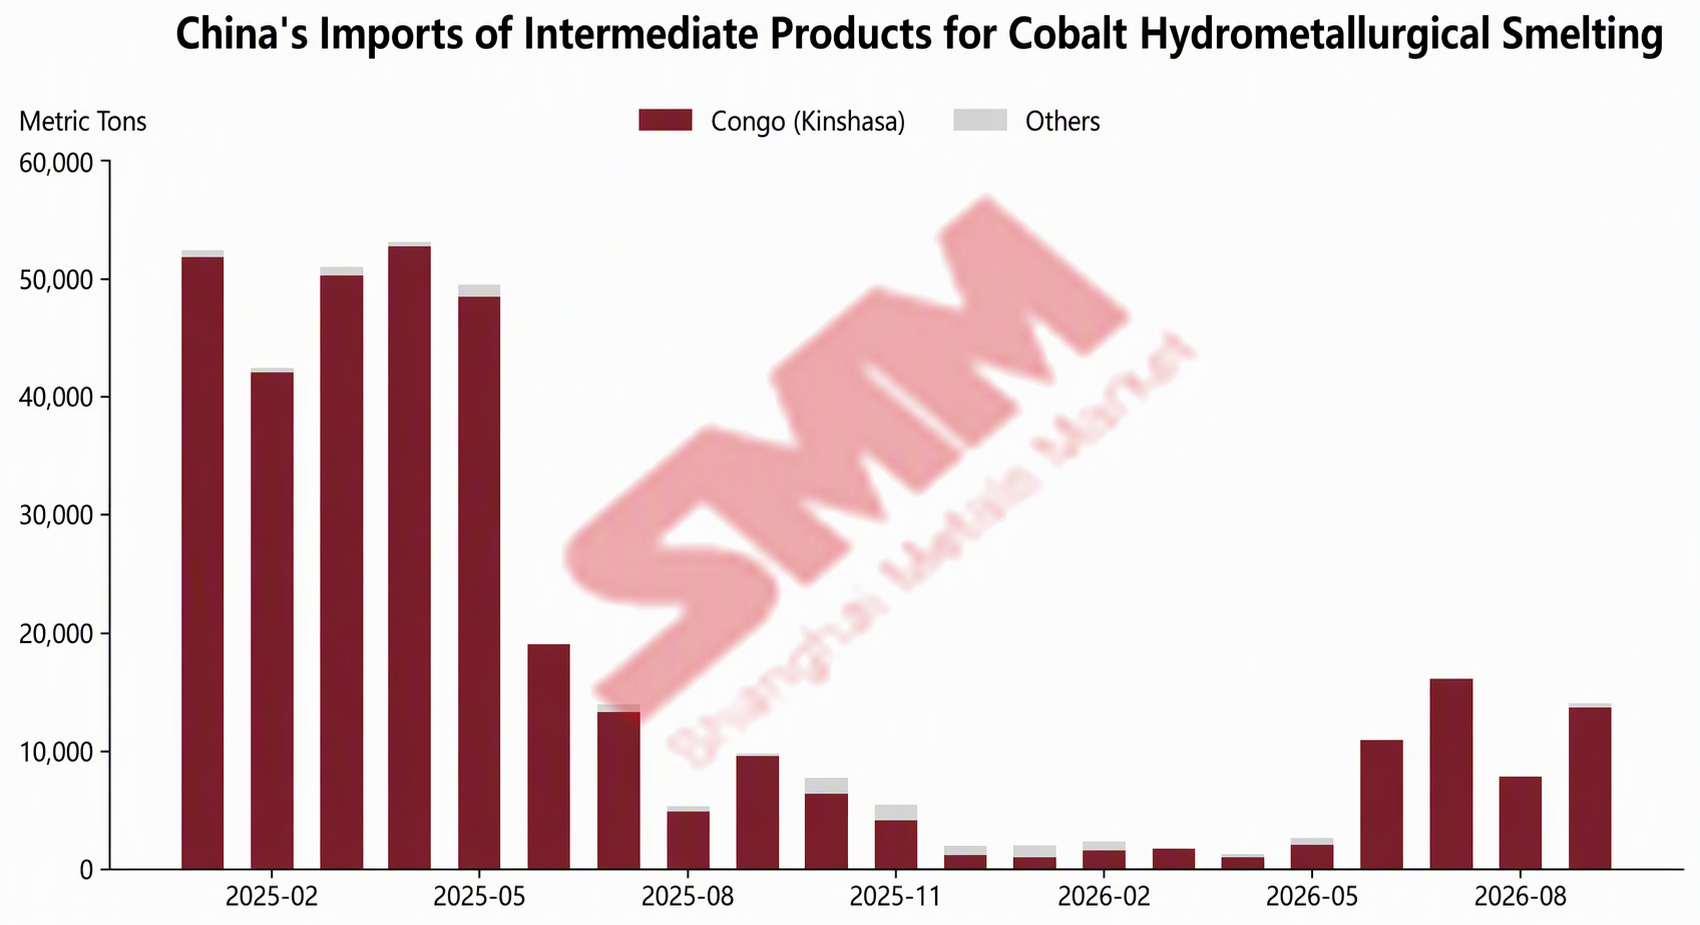
The sharp rebound in imports this month was mainly driven by two factors. First, shipments delayed in August due to typhoons "Dolphin" and "Saudel" affecting port operations along the east China coast were concentrated and realised as port arrivals in September. Second, actual shipments from the DRC remained high in the prior period. According to DRC CTCPM data, the DRC's monthly cobalt exports in June 2026 were approximately 11,800 mt in metal content, up 92.9% MoM, accounting for 48.9% of Q2 exports. Shipping via Durban to China typically takes about two months, so the concentrated shipments from the prior period gradually arrived in September. In addition, the 44% YoY increase in imports this month also reflected a base effect—the impact of the DRC's export policy in September 2025 had not yet fully faded, and imports that month were only 9,719 mt in physical content, below normal-year levels.
.......
Prices: Cobalt Salt and Intermediate Product Prices Continued to Decline, Payable Indicator Fell to 69% at Month-End
On the price front, domestic cobalt salt and intermediate product prices continued their synchronised decline in September. The low-end cobalt sulphate price fell from approximately 70,000 yuan/mt at the beginning of the month to approximately 60,000 yuan/mt at month-end, a monthly decline of approximately 14%. The low-end cobalt intermediate product price (CIF China) fell from $18/lb at the beginning of the month to $14.5/lb at month-end, a decline of approximately 19%, steeper than that of cobalt salt. In terms of the payable indicator, the low-end payable indicator for cobalt intermediate product raw materials (against the SMM cobalt sulphate average price) declined steadily from 77% at the beginning of the month to 69% at month-end. Under pressure from falling cobalt salt prices and losses, smelters continued to lower raw material procurement indicators, making it no easier for miners to conclude tenders, and the price divergence between buyers and sellers persisted. In terms of average import prices, the average import price of cobalt hydrometallurgy intermediate products in China in September 2026 was $13,828/mt in physical content, down 10.8% MoM. From January to September 2026, China's cumulative imports of cobalt hydrometallurgy intermediate products totalled 58,780 mt in physical content, down 80% YoY.
Market Outlook: Port Arrivals and Weak Demand Continue to Wrestle, Future Arrival Levels Remain Uncertain
Looking ahead, the growth and constraint factors for intermediate product imports remain in a tug-of-war. On the growth side, first, cargoes corresponding to the DRC's previously high shipment levels will continue to arrive at ports; second, bonded inventories were significantly replenished in September, and if smelters initiate restocking, bonded cargoes can be quickly converted into domestic supply. On the constraint side, cobalt salt prices had not stopped falling entering October, with the low-end cobalt sulphate price falling to approximately 50,000 yuan/mt after the holiday, and smelters' raw material purchase willingness remained low. Miners still have some cargoes stored in Africa or Southeast Asia awaiting market changes. In mid-October, the cobalt intermediate product payable indicator rebounded from 69% to around 78%, but this rebound was mainly due to the overly rapid decline in cobalt sulphate prices after the holiday and the relatively slower decline in intermediate product raw material prices, causing a passive rise in the indicator rather than signalling a recovery in intermediate product transactions. Before cobalt salt prices stop falling, smelters' purchase willingness is unlikely to recover significantly. Overall, the future trend of China's cobalt intermediate product imports will still depend on whether cobalt salt prices can stop falling and on smelters' restocking pace, with uncertainty remaining over the level of port arrivals.
Unwrought Cobalt
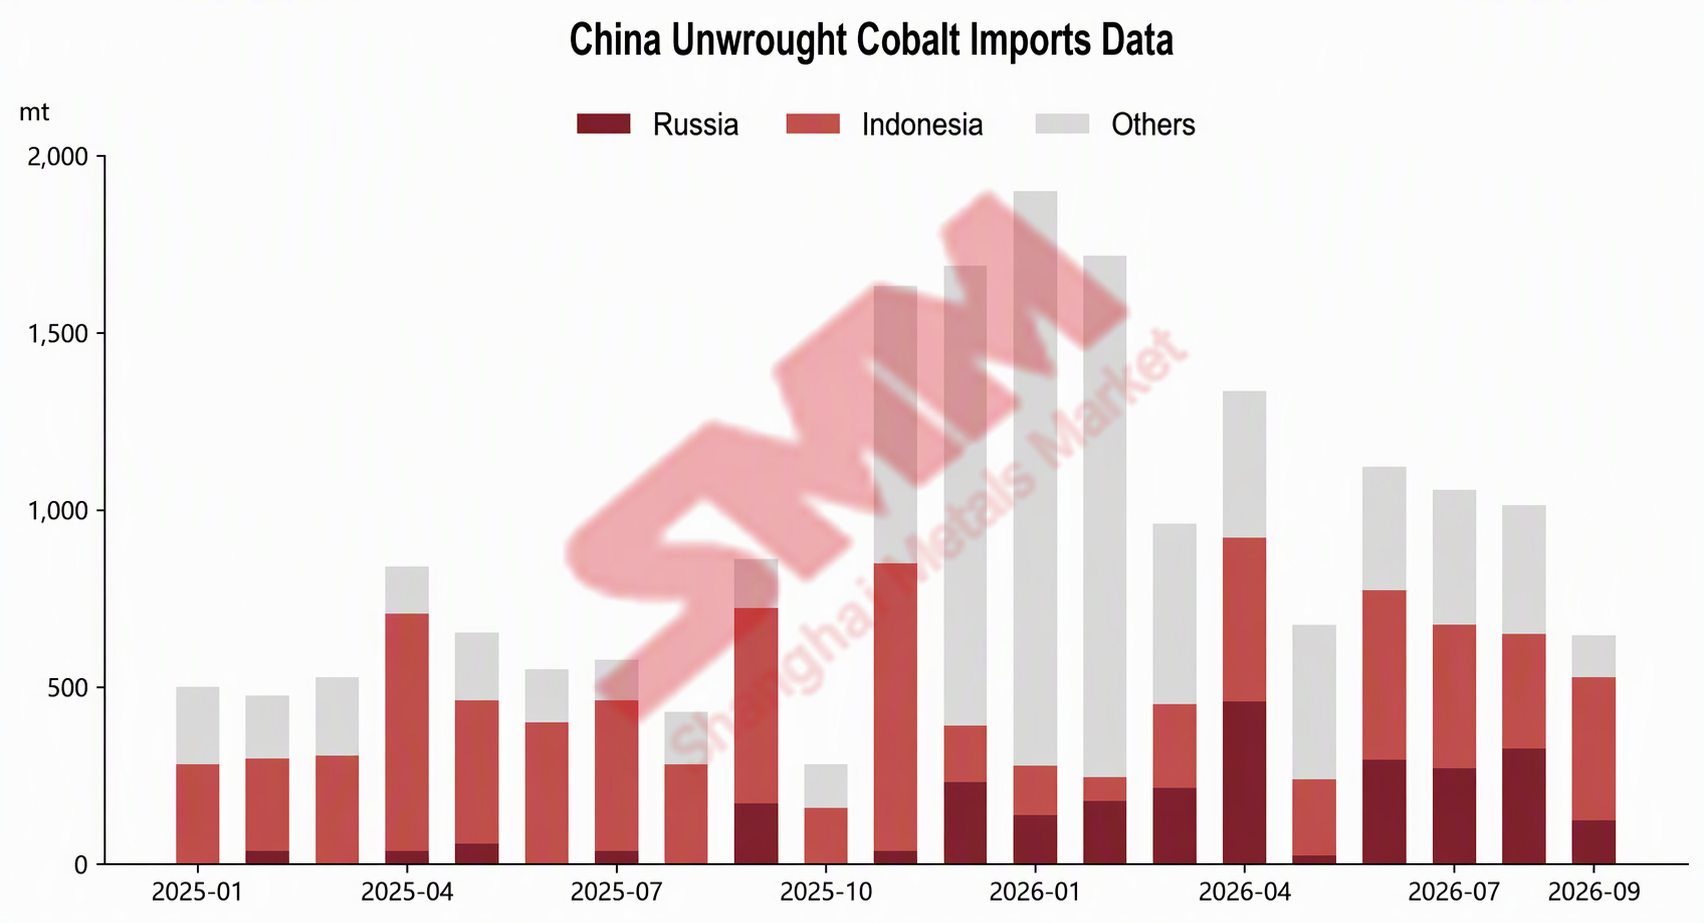
In September 2026, China's unwrought cobalt imports were approximately 642 mt, down 37% MoM and down 25% YoY. Exports were approximately 527 mt, up 9% MoM and down 1% YoY.
Imports: Import Window Deeply Closed, Indonesian Bonded Cargoes Became the Main Support
By country, China's top three sources of unwrought cobalt imports in September 2026 were Indonesia, Russia, and Australia, with import volumes of 402 mt, 123 mt, and 50 mt respectively. Indonesian cargoes increased 25% MoM, returning to the top single-month source position, with all volumes entering through Zhejiang ports via Entrepot Trade by Customs Special Control Area. In fact, Indonesia has been China's largest source of refined cobalt imports since 2025, with cumulative imports of approximately 7,418 mt, far exceeding Russia's 2,642 mt over the same period. This year, cumulative imports from Indonesia have reached approximately 2,716 mt, also firmly in first place, with only occasional months such as May and August seeing Russia slightly overtake. This month, Russian cargoes fell sharply by 62% MoM; Australian cargoes were flat MoM; and Madagascar, which supplied 51 mt in August, saw volumes fall to nearly zero in September.
From a price perspective, the domestic low-end refined cobalt price fell from 300,000 yuan/mt at the beginning of September to 254,000 yuan/mt at month-end, a monthly decline of approximately 15%. Meanwhile, the low-end refined cobalt price at Rotterdam warehouses in Europe only pulled back slightly from $23.9/lb to $22.5/lb, with ex-China prices falling significantly less than domestic prices, further widening the price spread between Chinese and overseas markets. As a result, the theoretical import loss for refined cobalt widened from approximately 120,000 yuan/mt at the beginning of the month to over 150,000 yuan/mt at month-end, with the import window deeply closed and market import volumes contracting significantly. Under these circumstances, September imports were still able to remain above 600 mt, mainly supported by two sources: first, some branded refined cobalt, constrained by long-term contracts or operational requirements, still needed to be shipped to China as planned; second, Indonesian cargoes continued to flow in through bonded channels.
Exports: Export Profits Remained Positive, US Returned as Top Single-Month Destination
By country, China's top three export destinations for unwrought cobalt in September 2026 were the US, the Netherlands, and India, with export volumes of 212 mt, 202 mt, and 41 mt respectively. Exports to the US increased 63% MoM, returning to the top single-month destination position. From a full-year perspective, the US absorbed approximately 1,640 mt of China's refined cobalt exports in January-September 2026, surpassing the Netherlands' approximately 977 mt and becoming the largest destination for China's refined cobalt exports this year, ranking first in single-month volumes in six of the nine months. Exports to the Netherlands increased 15% MoM; exports to India decreased 19% MoM. In addition, September saw exports of 21 mt to Japan, 20 mt to Taiwan, China, 14 mt to Pakistan, and 10 mt to Vietnam.
......
Market Outlook: Bonded "Reservoir" Two-Way Adjustment Function Highlighted, Watch Inventory Flow Direction
Looking ahead, the key to understanding the trend of refined cobalt imports and exports may lie in the direction of bonded inventory flows. September's refined cobalt trade in China presented a highly tension-filled structure: on the import side, 86% of arriving cargoes entered bonded areas for storage, while on the export side, over 95% of re-export cargoes originated precisely from bonded channels—bonded warehouses have become a "reservoir" connecting the domestic and overseas markets, capable of being converted into domestic sales or re-exported outward. This means the currently accumulated bonded inventory carries two-way elasticity: if the export profit window remains open, inventory will continue to flow overseas, providing support for export volumes; if the window closes, cargoes will settle in warehouses awaiting opportunities. From the profit trend perspective, theoretical export profits have narrowed rapidly since October to around 11,000 yuan/mt, and on 12 October briefly fell to only approximately 2,400 yuan/mt, approaching break-even. The momentum for bonded cargoes to be re-exported outward is weakening, and Q4 export volumes may pull back. On the import side, under the deeply loss-making landscape, market cargoes are unlikely to see growth, and port arrivals will continue to be dominated by structural inflows from long-term contracts and Indonesian bonded cargoes. Another trend worth noting is that with the continued release of cobalt by-product from Indonesia's nickel hydrometallurgy projects, low-cost Indonesian cargoes have been steadily flowing back to China through bonded channels, making Indonesia the largest source of China's refined cobalt imports for two consecutive years. This structural change in the import landscape is unlikely to reverse in the short term.