Origin sets the bill, not the product
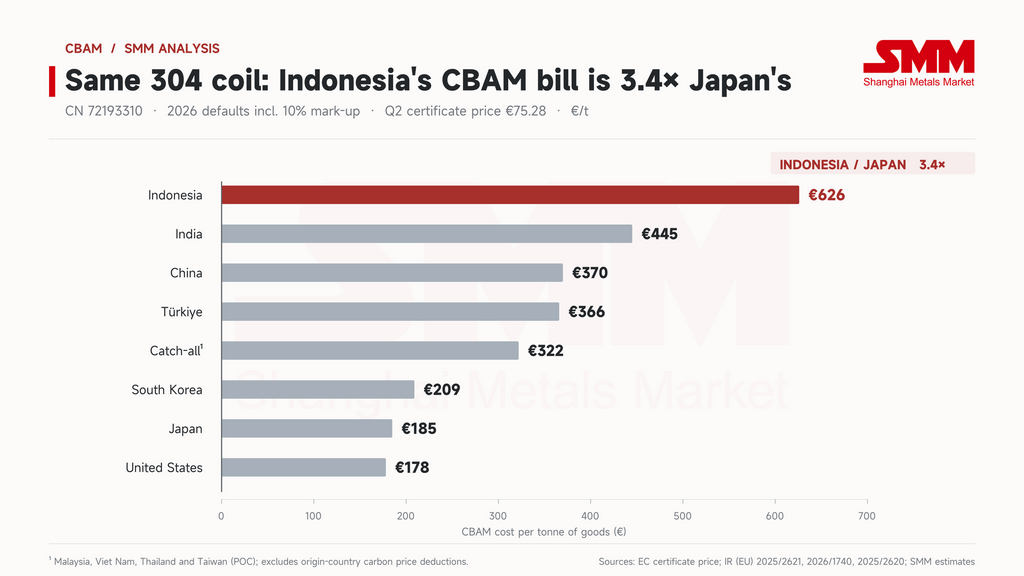
SMM used EU CN code 7219 3310, which covers the most common 304 CRC widths and thicknesses, with 2026 default values, the 10% mark-up and the Q2 price of EUR 75.28. On that basis, Indonesian material carries embedded emissions of 9.559 tCO2e/mt. After deducting an applicable benchmark of about 1.238 tCO2e, it needs roughly 8.32 certificates per tonne, or about EUR 626/mt.
Under the same code, India comes in at about EUR 445/mt, China EUR 370/mt, Turkiye EUR 366/mt, South Korea EUR 209/mt, Japan EUR 185/mt and the US EUR 178/mt. The Indonesia-China gap alone is about EUR 257/mt. These differences come from the country-specific default values set in EU law, not from the certificate price, which is the same for every origin.
Within a single origin, product form barely matters. Indonesia's raw default values for semi-finished products, hot-rolled coil (HRC) and CRC are about 8.67, 8.67 and 8.69 tCO2e/mt. China's sit between 5.58 and 5.59. When importers declare on default values, the emissions intensity of the melt shop, and the origin column it falls under, matters far more than any downstream rolling step.
Southeast Asia splits two ways
Indonesia has its own default values in the regulation's annex. Malaysia has no stainless steel entries at all, while the stainless codes for Vietnam, Thailand and Taiwan (Province of China) are shown as "–". All four therefore fall back to the "Other Countries & Territories" catch-all column.
Under the same assumptions, 304 CRC on the catch-all column costs about EUR 322/mt, roughly EUR 304/mt less than Indonesian material.
Taiwan (POC)'s treatment changed at the end of July. Implementing Regulation (EU) 2026/1740 corrected the default values for several Taiwan (POC) stainless codes to "–", moving them to the catch-all column, with retroactive effect from January 1, 2026. The same regulation also adjusted some catch-all values; for example, codes 7219 31 to 7219 90 and 7220 20/90 rose from 4.94 to 5.02 tCO2e/mt. For goods imported in 2026, checking codes and origins against the corrected tables matters more than relying on older data.
For default-value users, the steep climb ends in 2028
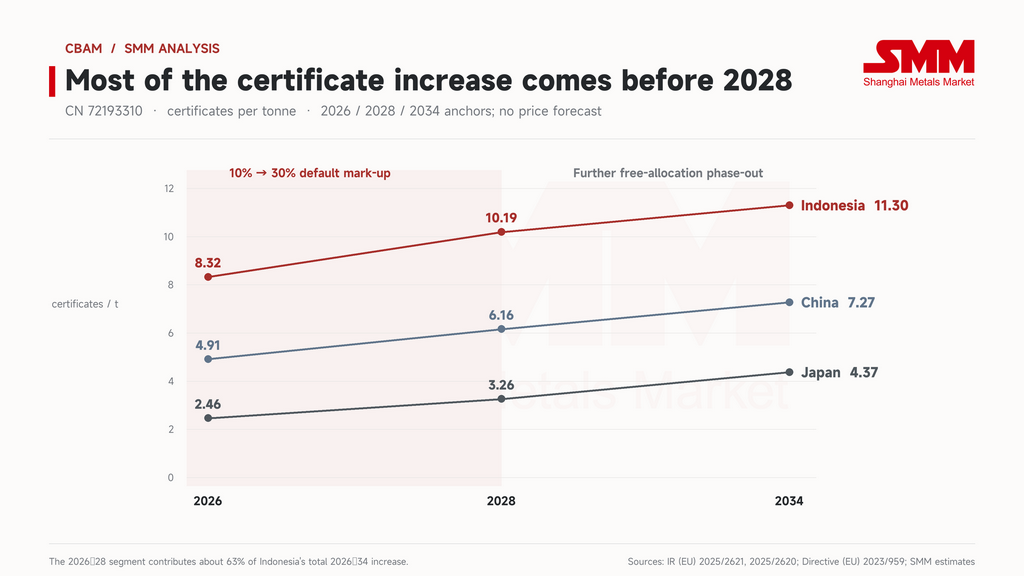
The market tends to see 2034, when free allocation is fully phased out, as the point where CBAM costs peak. For high-emission stainless steel declared on default values, the change in the mark-up over the next two years arrives much sooner.
The benchmark deduction is small. For 304 CRC in 2026, the default-value benchmark (Column B) is 1.270 tCO2e/mt. Multiplied by that year's CBAM factor of 97.5%, it removes about 1.238 tCO2e. That is only around 13% of Indonesia's marked-up embedded emissions of 9.559 tCO2e. The default-value mark-up for steel products, by contrast, steps up from 10% in 2026 to 20% in 2027 and 30% from 2028.
On current parameters, Indonesian material needs 8.32 certificates per tonne in 2026, rising to 10.19 by 2028, an increase of about 22% in two years. From 2028 to 2034 it climbs a further 11%, to 11.30. More than 60% of Indonesia's increase in certificates over 2026-2034 happens in the first two years. For China the path is roughly 4.91 to 6.16 to 7.27, with the first two years accounting for about 53% of the total rise. For Japan it is 2.46 to 3.26 to 4.37, and the first two years account for about 42%.
That does not make the free-allocation phase-out irrelevant. The lower an origin's emissions intensity, the larger the benchmark deduction is as a share of its bill, and the more the later decline in the CBAM factor will bite. For Indonesia and other high-default origins, though, the pricing pressure arrives early. Contracts for 2027 and 2028 need to account for it now.
Verified actuals can cut the bill, but check the break-even
Using verified actual emissions is the main way a producer can reduce its certificate count. The timeline matters. Under Commission rules, accredited verifiers must register in the CBAM Registry within two months of accreditation, and no earlier than September 1, 2026. The first verification reports can be issued from January 2027. That still leaves room for 2026 imports to use actual values in the first annual declaration in 2027. Whether a given plant makes that window depends on its monitoring, documentation and verification progress.
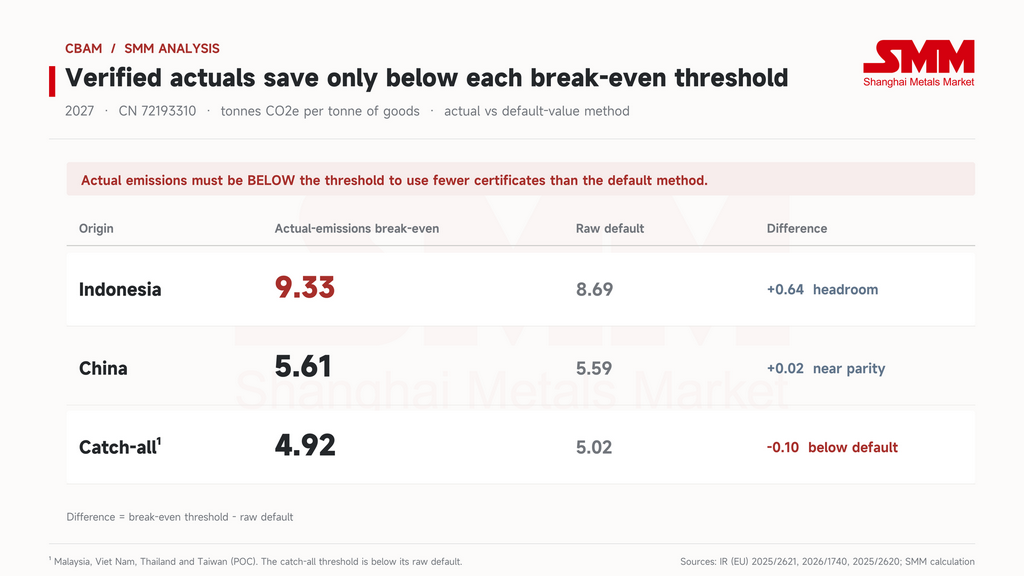
Actual values are not automatically cheaper. A declaration on actual emissions for 304 CRC uses benchmark Column A, which is only 0.109. A declaration on default values uses Column B, at 1.270. At the 2027 CBAM factor of 95%, that means deductions of about 0.104 and 1.207 tCO2e respectively. The default route gets the larger deduction, but only after its emissions have been marked up by 20%.
Netting the two out gives 2027 break-even intensities for 304 CRC of about 9.33 tCO2e/mt for Indonesia, 5.61 for China and 4.92 for the catch-all column. Below those levels, the actual-value route needs fewer certificates. Above them, default values may work out cheaper.
There is one exception that is easy to miss. Indonesia's break-even sits above its raw default of 8.69, and China's sits just above its raw default of 5.59. The catch-all column's break-even of 4.92, however, falls below its raw default of 5.02.
Producers cannot assume that any verified value at or below the raw default will pay off; the comparison has to be run code by code, origin by origin and year by year.
CBAM is one of four cost layers on EU-bound CRC
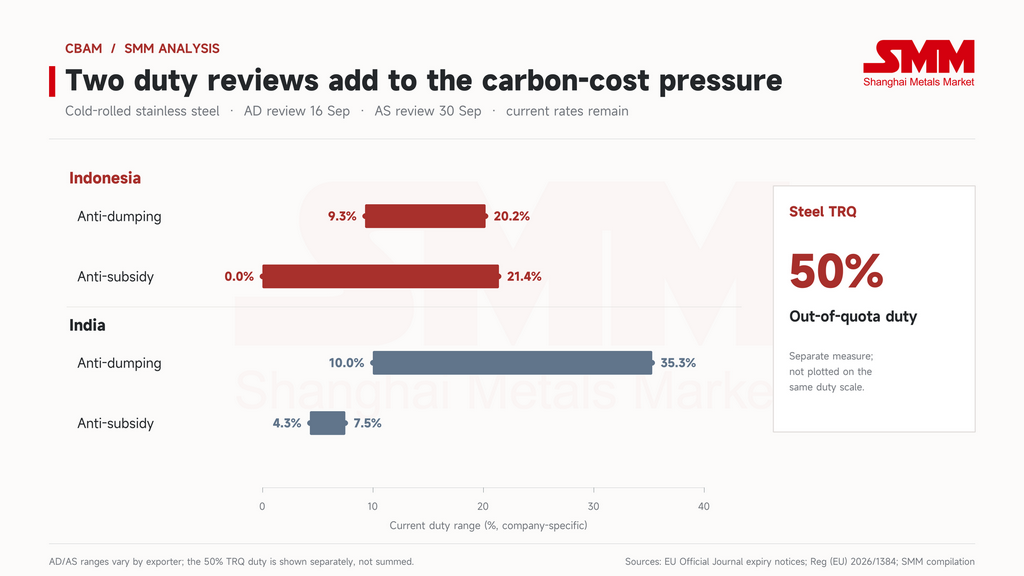
On September 15, the EU's Official Journal published notice of an expiry review of anti-dumping measures on cold-rolled stainless steel flat products from India and Indonesia. The European steel association EUROFER had filed the request on June 29. A parallel expiry review of the anti-subsidy measures on the same products was reported to have opened on September 30. Existing measures stay in force while the reviews run.
Current anti-dumping duties range from 9.3% to 20.2% for Indonesia and from 10.0% to 35.3% for India. Anti-subsidy duties range from 0% to 21.4% for Indonesia and from 4.3% to 7.5% for India. In the Q2 price scenario, Indonesian CRC also carries a CBAM certificate cost of about EUR 626/mt on top of any trade-remedy duties, and Indian CRC about EUR 445/mt. Because duty rates, covered companies and tax bases all differ, the percentages and the per-tonne euro figures cannot simply be added together.
The EU's new steel tariff-rate quota (TRQ) system, in force since July 1, sets a duty-free annual quota of about 18.346 million mt. Volumes above quota pay a 50% duty, and importers must now report where the steel was melted and poured. This is a separate set of rules from CBAM and the trade remedies.
A complete landed-cost calculation for any shipment has to check anti-dumping, anti-subsidy, quota and CBAM exposure one by one.
CBAM's product scope may also widen. On September 15, the European Parliament adopted its negotiating position on extending CBAM to more downstream steel and aluminium products, by 464 votes to 50 with 159 abstentions. The list covers fasteners, wire, springs and household articles, among others. This is Parliament's position, not law, and interinstitutional negotiations must still follow. The direction is clear, though: processing coil into finished goods before export may not keep carbon costs at bay for long.
How the SMM calculator works
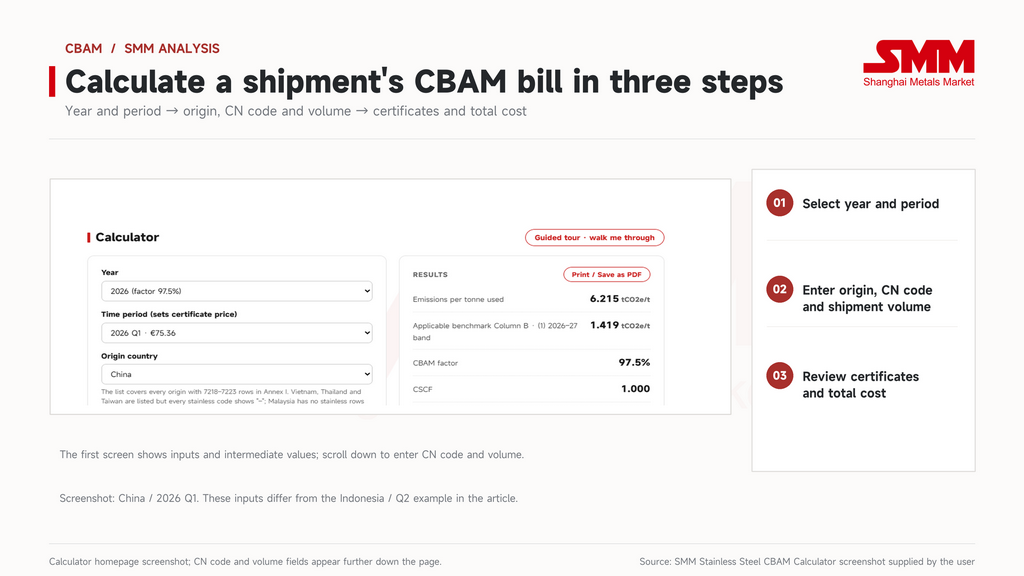
SMM's Stainless Steel CBAM Calculator covers all 67 eight-digit stainless steel CN codes under headings 7218 to 7223. It offers every origin listed in the annex plus the applicable catch-all column. Default values and benchmarks are entered code by code from the relevant EU implementing regulations, including the 2026 corrections. The tool uses only certificate prices the Commission has already published and does not forecast unpublished quarters.
Users select the import year and quarter, then enter the origin, CN code and tonnage. The results page shows the embedded emissions used, the applicable benchmark, the CBAM factor, certificates per tonne and total cost. Exporters, European buyers and customs agents can reconcile each figure line by line. The result can be printed or saved as a one-page PDF cost sheet.
As of October 1, the Commission had not yet published the Q3 2026 certificate price, which is scheduled for October 5. Selecting Q3 will return certificate volumes, with the cost to follow once the price is out. From 2027, certificate prices move to weekly publication, so the import date and its pricing period will matter more when quoting.
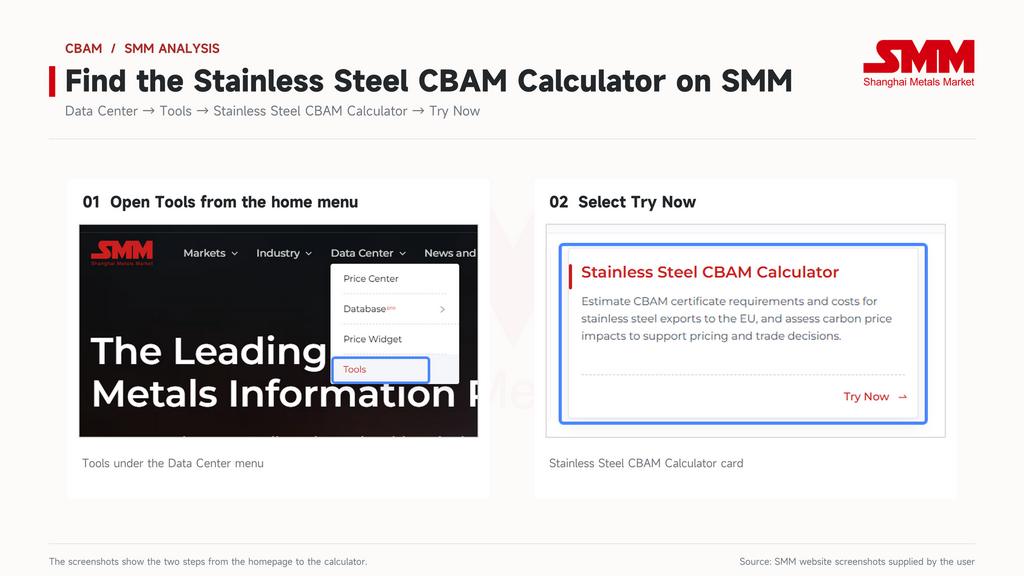
To access the calculator, log in to SMM, open "Industry Tools" from the top navigation (https://www.smm.cn/industry-tools?page=1), select "Stainless Steel CBAM Calculator" and click "Use now".
Outlook
The first annual CBAM bill for 2026 imports falls due on September 30, 2027, the deadline for the first declaration and certificate surrender. Certificates go on sale on the EU's common central platform from February 2027. The obligation is accruing now, but the cash goes out later. That gap is the window for exporters and European buyers to renegotiate prices and agree who bears the carbon cost.
For 304 CRC under a single CN code, origin alone moves the carbon cost between roughly EUR 185/mt and EUR 626/mt. How that spread is written into contracts will shape European sourcing decisions more directly than where the carbon price goes next.