I. Concentration Declines First, Then Rises: Three Years of Dilution, One Year of Recovery
From 2022 to 2025, the continued decline in secondary lead production concentration was misread as weakening competitiveness among top-tier players. Breaking down the numerator and denominator shows that this was not the case.
On the numerator side, top-tier players' production growth was relatively restrained: under the dual constraints of raw materials and processing fees, "produce based on sales and live within one's means" became the mainstream choice; well-managed large enterprises proactively scheduled maintenance and reduced operating rates; integrated enterprises mainly supplied their smelting output for internal use, with operating pace following battery production schedules and limited production flexibility.
On the denominator side, the high lead price boom of 2021–2023, coupled with local tax incentives for investment promotion, attracted many medium-sized enterprises and new entrants to build new capacity in Anhui, Jiangxi, Henan, Guangxi and other places; these projects ramped up production intensively in 2022–2024. Tail expansion significantly diluted the share of top-tier players.
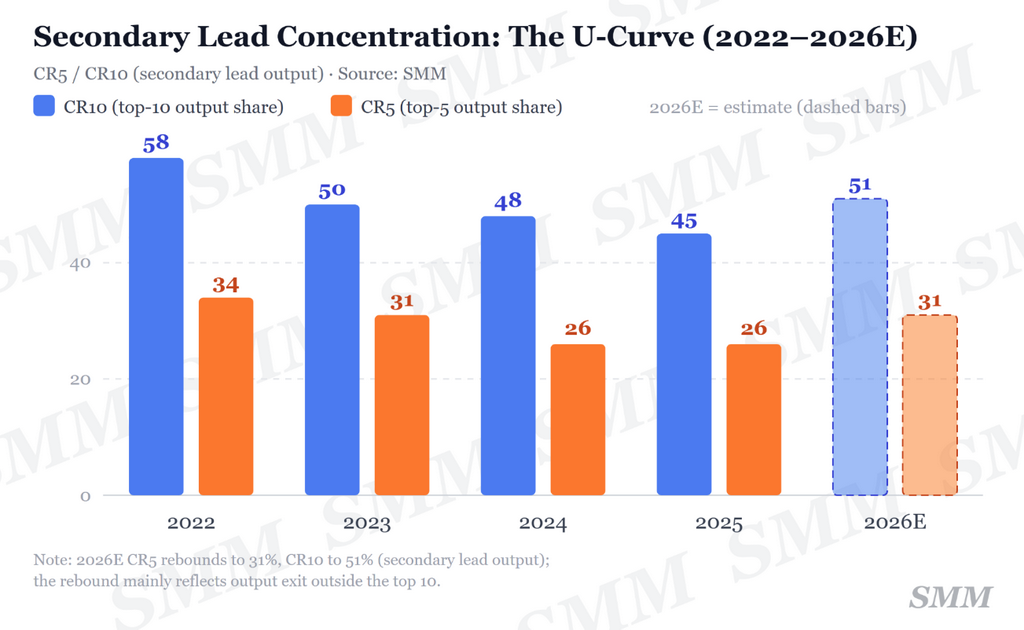
Entering 2026, the logic reverses: small secondary lead smelters' operating rates have been hovering at low levels of 5%–20%, and operating pressure has continued to accumulate; national secondary lead production is expected to decline by another 1.1% or so YoY, with the decline borne mainly by the long tail outside the top ten. One detail bears this out—CR10 rebounded by 6 percentage points, slightly higher than CR5's 5 percentage points, indicating that the incremental increase in concentration was not from "the top five swallowing the sixth through tenth," but from the wholesale exit of capacity outside the top ten from the statistical scope. With the denominator contracting faster than the numerator, concentration rose both passively and actively.
II. Why Only One Company Overlaps Between the Two “26%” Figures: CR10 Provides the Answer
Integrated smelting capacity accounts for 26% of the country’s total secondary lead capacity; this measure comprises enterprises with a complete “recycling–smelting–manufacturing” closed loop. The 26% production share represented by the CR5, by contrast, is accounted for by another group of enterprises, and only one company overlaps between the two lists.
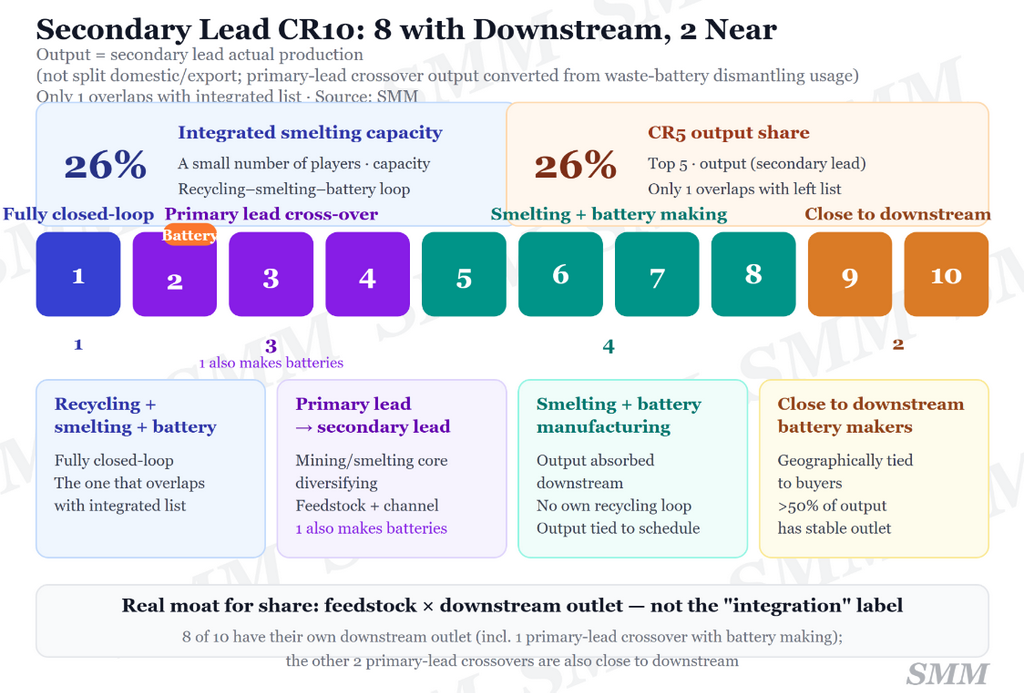
The composition of CR10 confirms this. Among the ten top-tier players, one is a fully closed-loop enterprise covering “recycling + smelting + battery manufacturing”—the very company that overlaps with the integrated list. Three are primary lead enterprises that have expanded into secondary lead, combining raw material synergies and downstream channels; one of them also has battery production. Four are “smelting + battery manufacturing” enterprises, whose output is absorbed by downstream production lines. Two are adjacent to downstream battery enterprises, with stable outlets for more than 50% of their production. Among the ten, eight have clear downstream outlets—the real threshold for the production ranking is “raw material access × downstream outlets,” not scale or identity.
III. Two Shapes of Operating Rates: Smelting “High in the Middle,” Battery “Dominated by Large Enterprises”
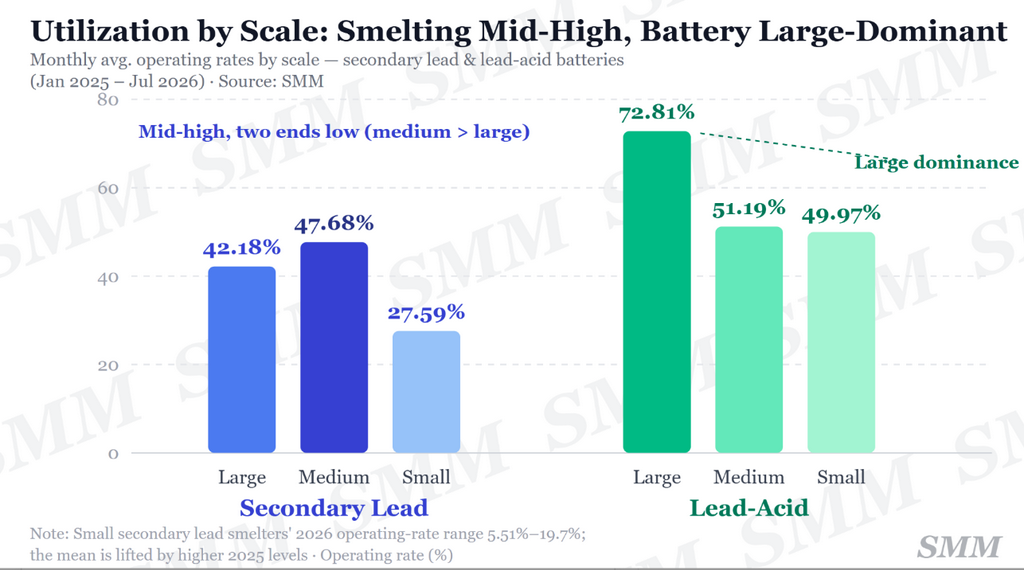
From January 2025 to July 2026, SMM’s size-segmented average monthly operating rate for secondary lead showed a counterintuitive shape: medium-sized enterprises ranked first at 47.68%, higher than the 42.18% of large enterprises, while small enterprises came in last at 27.59%—a spindle shape that was “high in the middle and low at both ends.” Behind medium-sized enterprises surpassing large ones were differences in operating strategies and raw material sourcing radius: large enterprises were more decisive in producing based on sales and proactively scheduling maintenance; integrated smelting also followed battery production schedules and did not target full-capacity operation. By contrast, medium-sized smelters, close to raw material supply sources and with flexible operating mechanisms, maintained higher operating loads. Beneath the 27.59% average for small enterprises, their operating rate in 2026 pulled back to the 5.51%–19.7% range, with operating pressure most concentrated among all types of capacity.
The battery segment showed a different shape: large enterprises were far ahead at 72.81%, while medium-sized enterprises at 51.19% and small enterprises at 49.97% were locked in a close race around the midpoint—“large enterprises dominate alone.” Comparing the two sides, the conclusion is clear: the smelting segment is about raw material access and operating flexibility, while the battery segment is about share and scale; the pressure of industry adjustment is falling on small smelting capacity and small battery capacity, and is being absorbed gradually.
IV. Integration Is a Structural Advantage, Not an Inevitable Winning Edge
What needs to be viewed objectively is the simple equating of "integration" with "risk resistance." In terms of the production ranking, only one enterprise in the integrated camp has entered the top ranks of the secondary lead production CR list; at the same time, operating conditions within the camp are also diverging — a closed loop is merely a structure, and whether structural advantages can be converted into operating returns depends on execution.
What determines whether a smelter can smoothly navigate this round of adjustment has never been its identity label, but three verifiable hard indicators: actual control over recycling channels (the actual level of raw material self-sufficiency, rather than a nominal closed loop), cost control and operating efficiency in the smelting segment, and the market share and absorption capacity of the core battery business (which determines the floor for smelting operating rates). This round of industry adjustment has mainly affected capacity with insufficient raw material security, limited downstream connections and weak cost competitiveness — and has no necessary relationship with whether an enterprise adopts an integrated layout: from 2022 to 2025, canceled or suspended new project capacity has already reached 1.7 million mt, and fully idle capacity exceeds 1 million mt; SMM expects China's secondary lead capacity to decline year by year to below 8.5 million mt by 2030.
For well-run integrated enterprises, the value logic still holds: smelting is a cost center and a resource safety cushion; its value lies in locking in recycling access and ensuring supply stability. It should be assessed according to its strategic resource attributes, rather than under the profit model of a standalone smelter. However, it should also be recognized that this logic belongs only to those enterprises that have truly made the closed loop work.
Risk warning: A rebound in concentration does not equal a rebound in prosperity. Refined lead supply has shifted to a slight surplus, and the import window has opened; a surge in imports of crude lead and lead alloys from outside China continues to suppress domestic prices. Excess profits accumulated during the previous boom cycle are being depleted, and the safety cushion of integrated enterprises is not enough to fully hedge systemic risks. Moreover, operating divergence also exists within the camp, and closed-loop assets do not automatically equal high-quality assets. The second half of the "survivor takes all" phase will still be accompanied by the pain of capacity exits and asset impairments.
Data and estimates: SMM (Shanghai Metals Market); 2026E is an estimate; production volumes are not split between domestic sales and exports (cross-sector primary lead production is converted based on waste battery dismantling volumes); operating rates are based on SMM survey methodology; the operating rate in Figure 3 is the monthly average from January 2025 to July 2026. This article is industry research analysis and does not constitute any investment advice.
![August Secondary Refined Lead Production Down 2.33% MoM, September Production Resumptions Expected to Rebound to 209,800 mt [SMM Analysis]](https://imgqn.smm.cn/usercenter/EhsCj20251217171721.jpeg)
![SHFE lead broke through the previous high and stood firm on the Bollinger upper band, short-term trend was strong, be alert to a pullback at high levels [SHFE lead brief review]](https://imgqn.smm.cn/usercenter/yqTpQ20251217171721.jpeg)