Around August 20, 2026, import and export data for cobalt and lithium battery industry chain products in July were released in a concentrated manner. The data showed that China’s spodumene imports in July 2026 were 739,300 mt in physical content, down about 3.8% MoM from 768,400 mt in June. The July import volume was equivalent to about 64,200 mt LCE, which, together with high-volume lithium sulfate imports, supported robust domestic demand for lithium-bearing materials. For lithium carbonate, according to customs data, China imported 26,752 mt of lithium carbonate in July, up 3% MoM and up 93% YoY...... SMM compiled the import and export situation of battery materials in H1, as follows:
Upstream
Lithium Concentrates
According to China Customs data, China’s spodumene imports in July 2026 were 739,300 mt in physical content, down about 3.8% MoM from 768,400 mt in June.
By source country, major suppliers diverged in performance: imports from Australia were 345,000 mt, down about 7% MoM, mainly because after the concentrated year-end shipments in June for Australia’s fiscal year, the shipping pace naturally pulled back in July. Previously, spodumene concentrates shipments from Australia to China hit a peak record of 530,000 mt in June. Imports from Brazil were 116,000 mt, surging about 78% MoM, becoming the largest source of growth this month, of which nearly 100,000 mt were low-grade ore fines. Imports from South Africa were 109,000 mt, maintaining a normal shipping pace. Imports from Mali were 38,300 mt, down about 36% MoM. Imports from Zimbabwe were 21,600 mt, down 48% MoM, marking the first batch of imports after the ban was introduced, with arrivals basically in line with expectations. Imports from Nigeria were 104,700 mt, down about 9.5% MoM, with concentrates accounting for over 75%.
Overall, the July import volume was equivalent to about 64,200 mt LCE, which, together with high-volume lithium sulfate imports, supported robust domestic demand for lithium-bearing materials.
For spot quotations of spodumene concentrates (CIF China), SMM spot quotations showed that spot quotations for spodumene concentrates (CIF China) in July rose first and then fell, with the monthly high reaching $2,335/mt before trending lower thereafter. As of July 31, spot quotations for spodumene concentrates (CIF China) fell to $2,090/mt, down $180/mt from $2,270/mt at the beginning of the month, a decline of 7.93%.
According to SMM, in July, lithium extraction enterprises using externally purchased spodumene fell back into losses at the beginning of the month, and the losses continued to widen. Although spodumene concentrates prices pulled back from the beginning of the month, the decline was smaller than that of lithium chemicals, and losses in the processing segment continued to deepen. In July, the domestically externally purchased lepidolite route maintained spot profitability, mainly benefiting from a synchronous pullback in domestic lepidolite concentrates prices in line with the decline in lithium carbonate, which eased cost-side pressure on raw materials to some extent. On the market side, on July 28, Yichun Mining auctioned 3,500 mt of 1.85% lepidolite concentrates, with a transaction price of 3,860 yuan/mt.
Lithium Carbonate
According to customs data, China imported 26,752 mt of lithium carbonate in July, up 3% MoM and up 93% YoY. Among them, lithium carbonate imports from Chile were 13,787 mt, accounting for 52% of total imports; imports from Argentina were 9,521 mt, accounting for 36%; and imports from Indonesia were 2,406 mt, accounting for 9%. From January to July, China’s cumulative lithium carbonate imports totaled 206,000 mt, up 57% YoY on a cumulative basis.
China exported 212 mt of lithium carbonate in July, down 19% MoM and down 42% YoY. From January to July, China’s cumulative lithium carbonate exports totaled 2,560 mt, down 10% YoY on a cumulative basis.
China imported 16,225 mt of lithium sulfate in July, up 20% MoM and up 48% YoY. From January to July, China’s cumulative lithium sulfate imports totaled 100,800 mt, up 86% YoY on a cumulative basis. Among them, lithium sulfate imports from Chile were 13,608 mt, and imports from Zimbabwe were 2,617 mt.
SMM spot quotations showed that spot lithium carbonate quotations in July also rose first and then fell. On July 3, spot lithium carbonate quotations peaked at 165,250 yuan/mt, after which spot lithium carbonate quotations continued to pull back. As of July 31, spot quotations for battery-grade lithium carbonate fell to 143,000 yuan/mt, down 22,250 yuan/mt, a decline of 13.46%.
According to SMM, domestic spot lithium carbonate prices in July drifted lower amid consolidation, with the monthly average price down about 6.7% MoM. Fundamentally, although the supply side saw multiple bullish factors—such as concentrated maintenance at multiple lithium chemical plants, tighter circulation of spodumene ore, and a phased pullback in imports—social inventory continued to destock at an accelerating pace. However, under the dominance of “weak expectations,” the market more often referenced looser long-term supply for advance pricing—expectations for Zimbabwe lithium concentrates arrivals, progress in the implementation of production resumptions at Jiangxi mines, and new capacity coming online one after another; news of long-term supply growth continued to weigh on market sentiment. Demand side, a stronger-than-usual off-season: production schedules for batteries and cathode materials stayed high. Downstream showed strong willingness to buy the dip below 150,000 yuan/mt, providing bottom support for prices, but large-scale concentrated stockpiling had not yet emerged, and momentum to chase higher prices was insufficient. Psychological price spreads between upstream and downstream persisted: upstream lithium chemical plants held prices firm and held back from selling, with spot order willingness to sell anchored above 160,000 yuan/mt; downstream mainly made just-in-time procurement, with limited acceptance of high prices. Actual transactions were relatively active but were dominated by low-price just-in-time demand.
As of August 24, spot quotations for battery-grade lithium carbonate rose to 158,000-163,000 yuan/mt, with the average price at 160,500 yuan/mt, and the average price once again firmly stood above the 160,000 yuan/mt round-number threshold.
Lithium Hydroxide
According to China Customs data, China’s lithium hydroxide imports in July 2026 were 8,322.16 mt, up 89.1% MoM from 4,400.35 mt in June; exports were 6,419.51 mt, up 6.7% MoM from 6,018 mt in June. Lithium hydroxide turned into a net import in the month.
On the import side, the main source in July was Indonesia. China imported 4,444.37 mt from the country, accounting for 53.4% of total imports, mainly due to the concentrated arrival of previously accumulated cargoes; imports from South Korea were 1,361.97 mt; imports from China’s domestic bonded supervision sites were 1,130.11 mt; imports from Australia were 690.89 mt; imports from Argentina were 399.74 mt; and imports from Germany were 295 mt. Indonesia-origin volumes in July increased nearly fivefold MoM, becoming the largest source of growth.
Battery Materials
LFP
Export data for China’s LFP cathode materials in July 2026 were released. Customs data showed that July exports were 13,153.3 mt, down 14.5% MoM from the record high in June, while still surging about 380% YoY, with export prosperity staying high.
In terms of prices, the average export price in July was $9,107.45/mt, edging down about $17.6/mt MoM, a decline of only 0.2%, with prices remaining broadly stable overall.
By region:
North America,the US remained the main pillar of demand outside China. Exports to the US in July were 5,972.5 mt, up 10.4% MoM. Despite policy uncertainty, US domestic battery capacity continued to ramp up, and actual import demand remained rigid. Canada’s export volume pulled back from 2,464.5 mt in June to 1,443.4 mt, down 41.4% MoM, mainly due to a normal correction after concentrated stockpiling in June by top-tier players such as LG Energy Solution.
Europe,the recovery trend was further confirmed. Exports to Poland were 889.5 mt, up 38.1% MoM, rebounding for the second consecutive month. Higher operating rates at LG’s Poland plant and production lines such as Northvolt continued to drive import demand for China’s LFP materials. Hungary recorded exports of 16 mt for the first time in the month, indicating that CATL’s Hungary plant had entered the small-batch stockpiling stage, laying the groundwork for subsequent volume ramp-up in Europe.
Asia,exports to South Korea rebounded to 137 mt, up 70% MoM, reflecting that under cost reduction pressure, battery enterprises in Japan and South Korea still had rigid demand for cost-effective LFP materials. Thailand and Vietnam exported 2,089.6 mt and 660 mt, respectively, up 4.5% and 6.5% MoM, maintaining a steady upward trend and forming stable support for the Southeast Asian market.
Overall, although July exports pulled back MoM, the absolute level remained at a historical high, and the core logic of robust overseas demand for LFP remained unchanged. (Data sources: SMM and customs import and export statistics)
LiPF6
According to China Customs data, in July 2026, China’s cumulative LiPF6 exports were about 1,324.4 mt, up about 19.9% MoM, and China’s cumulative LiPF6 imports were about 18.1 mt.
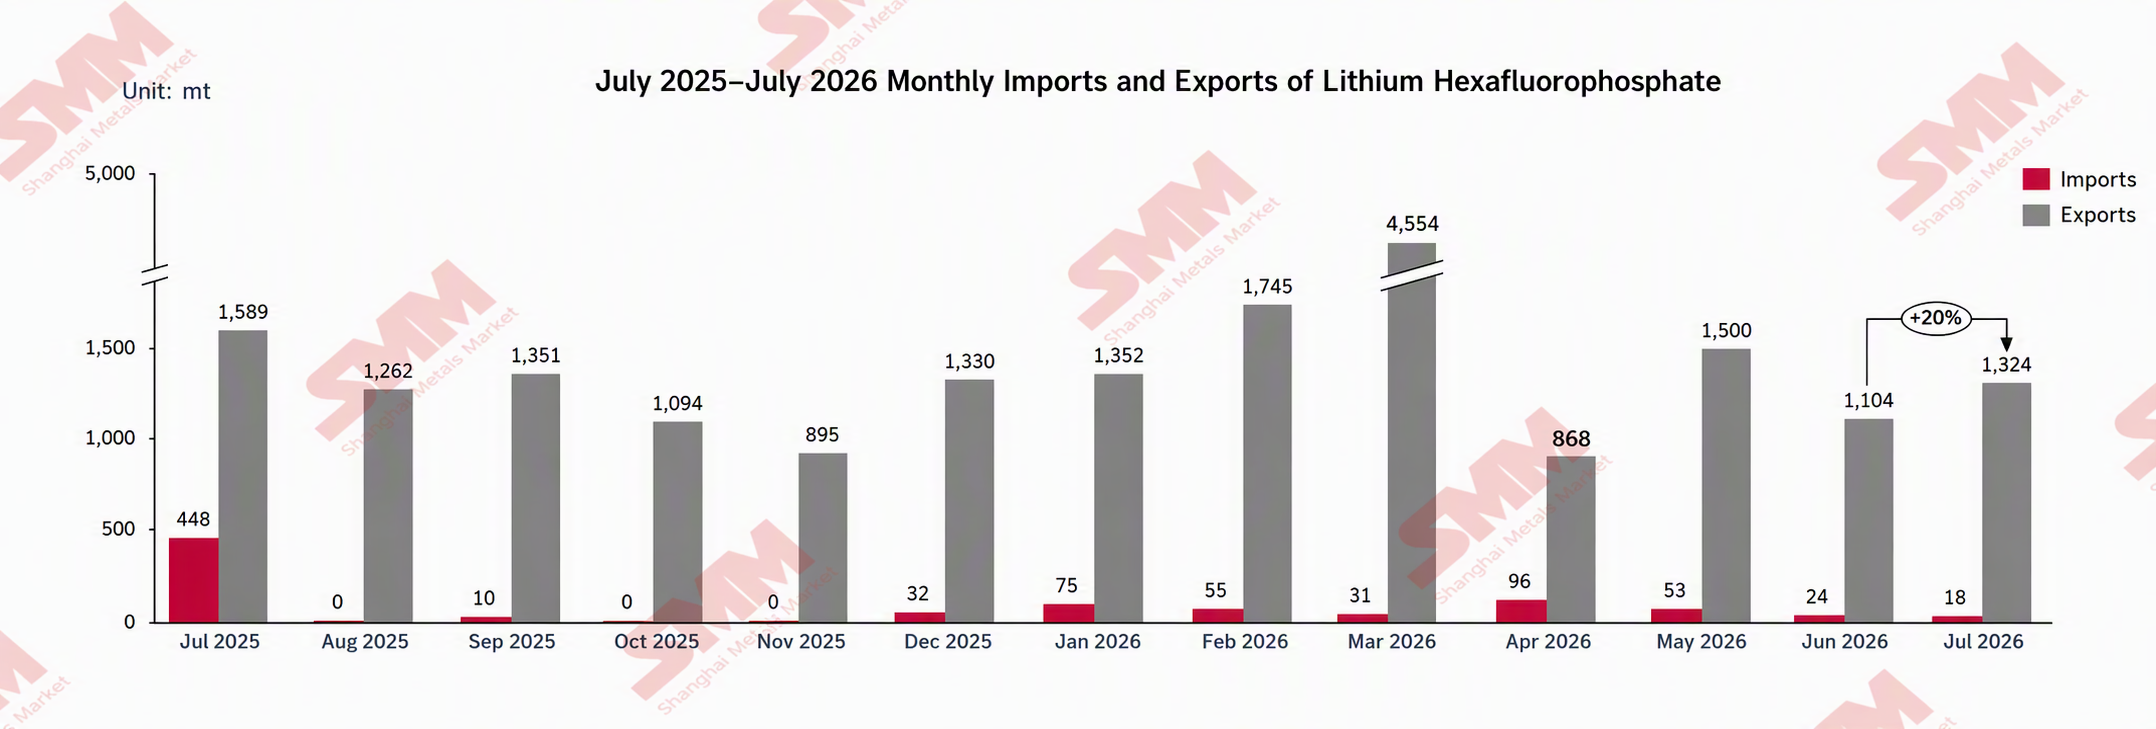
On the export side, China’s LiPF6 exports in July 2026 were about 1,324.4 mt, up about 19.9% MoM from June and down about 16.6% YoY. Specifically, LiPF6 was mainly exported this month to South Korea, Poland, Hungary, Japan, and other countries, including 307.41 mt to Poland, down about 8.7% MoM; 120.431 mt to the US, down about 23.58% MoM; 428.441 mt to South Korea, up about 34% MoM; 165 mt to Hungary, up about 175% MoM; and 189 mt to Japan, up about 63.55% MoM.
Flake Graphite
In July 2026, China’s flake graphite imports were 5,782 mt, up 39% MoM and up 32% YoY.

Data sources: China Customs, SMM
In July 2026, China’s flake graphite exports reached 7,435 mt, up 46% MoM, while still down 63% YoY. By export destination, the US, Germany, and South Korea were the main markets. Among them, exports to the US were 2,175 mt, becoming the main contributor to MoM growth this month; exports to Germany were 1,583 mt, up 83% MoM; exports to the Czech Republic were 24 mt—although the base was relatively small, the MoM increase was as high as 118%. Overall, the export structure showed a multi-point growth trend.
Phosphate Ore
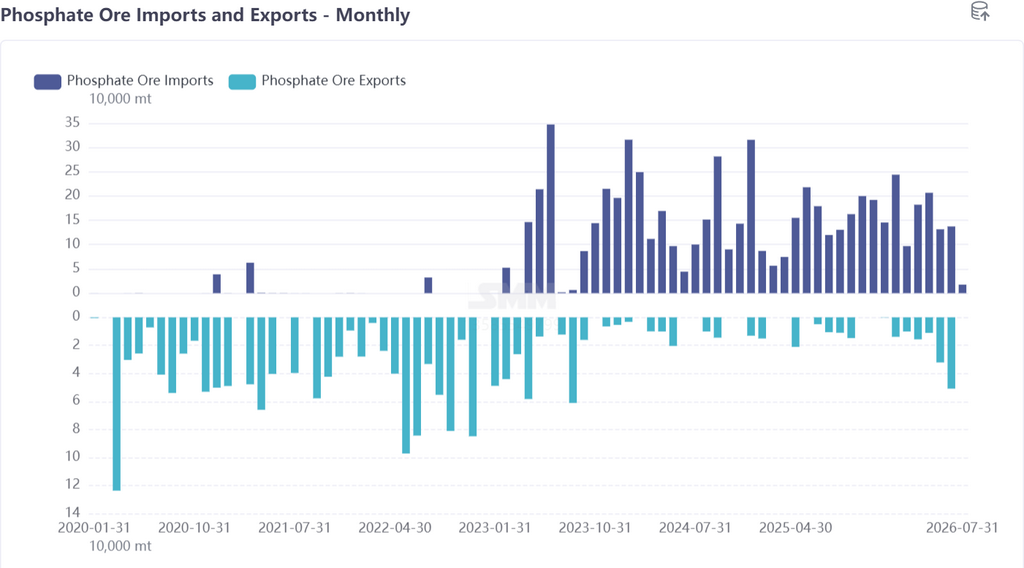
In July 2026, China’s phosphate ore imports were only 17,000 mt, plunging 87.3% MoM to a nearly three-year low; exports fell to zero. The average import price was $84.5/mt, down 7.6% MoM. Among importing provinces, only Guangxi maintained 14,000 mt, while all others fell to zero; by source country, Egypt’s volume shrank sharply by 81%, while Kazakhstan saw a marginal increase. After a pulse-like surge in exports in June, exports fell to zero in July, mainly due to order deliveries being completed, the off-season in demand, and control policies. Imports are unlikely to rebound in the short term; watch winter stockpiling and changes in export policies.
In July 2026, China’s phosphate ore imports were only 17,000 mt, plunging 87.3% MoM from 137,000 mt in June. From the monthly trend, imports showed a “cliff-like” drop. In January 2026, the single-month volume of 243,900 mt was the H1 peak; April’s 206,600 mt and March’s 182,100 mt stayed high; in May, imports plunged to 131,000 mt due to policy shocks from Egypt; in June, they rebounded slightly to 137,000 mt; and in July, they further collapsed to 17,000 mt, setting the lowest single-month import volume in nearly three years.
The core constraints behind this plunge included sulphuric acid prices staying high, weak demand from phosphate fertiliser producers, and a slowdown in domestic procurement during the seasonal off-season. In July, upstream domestic phosphate ore was disrupted by environmental protection, production safety inspections, and mining license renewal, and the supply side continued to face expectations of contraction, but downstream traditional phosphate fertiliser demand was in the seasonal off-season, leaving overall transactions in stalemate.
Summary:
Import side:Total volume of 17,000 mt plunged 87.3% MoM, hitting a phased low; the average import price of $84.5/mt fell 7.6% MoM; the provincial pattern shifted abruptly from broad-based activity in June to “Guangxi alone,” with Hubei, Zhejiang, Beijing, and others all falling to zero; source countries also contracted in tandem—Egypt remained dominant, but its absolute volume shrank sharply by 81%.
Export side:After the pulse-like surge of 51,000 mt in June, exports fell directly to zero in July, driven jointly by multiple factors including completion of earlier order deliveries, domestic supply contraction, the off-season in demand, and export controls.
Market Outlook: Imports were unlikely to see a notable rebound in the short term, while persistently low operating rates in downstream phosphate fertiliser continued to suppress procurement demand; on the export side, close attention should be paid to marginal demand changes driven by the implementation of August export policies for heavy calcium and SSP, as well as the pace of winter stockpiling procurement launches in H2. For the full year, imports in H1 already reached 998,200 mt; even if the pace slows down in H2, total annual imports are still expected to remain at a relatively high level. On the export side, cumulative exports in H1 totalled 133,900 mt, surging 226% YoY; whether exports can resume volume growth in H2 will depend on China’s supply-demand balance and the policy direction.
Sulphur
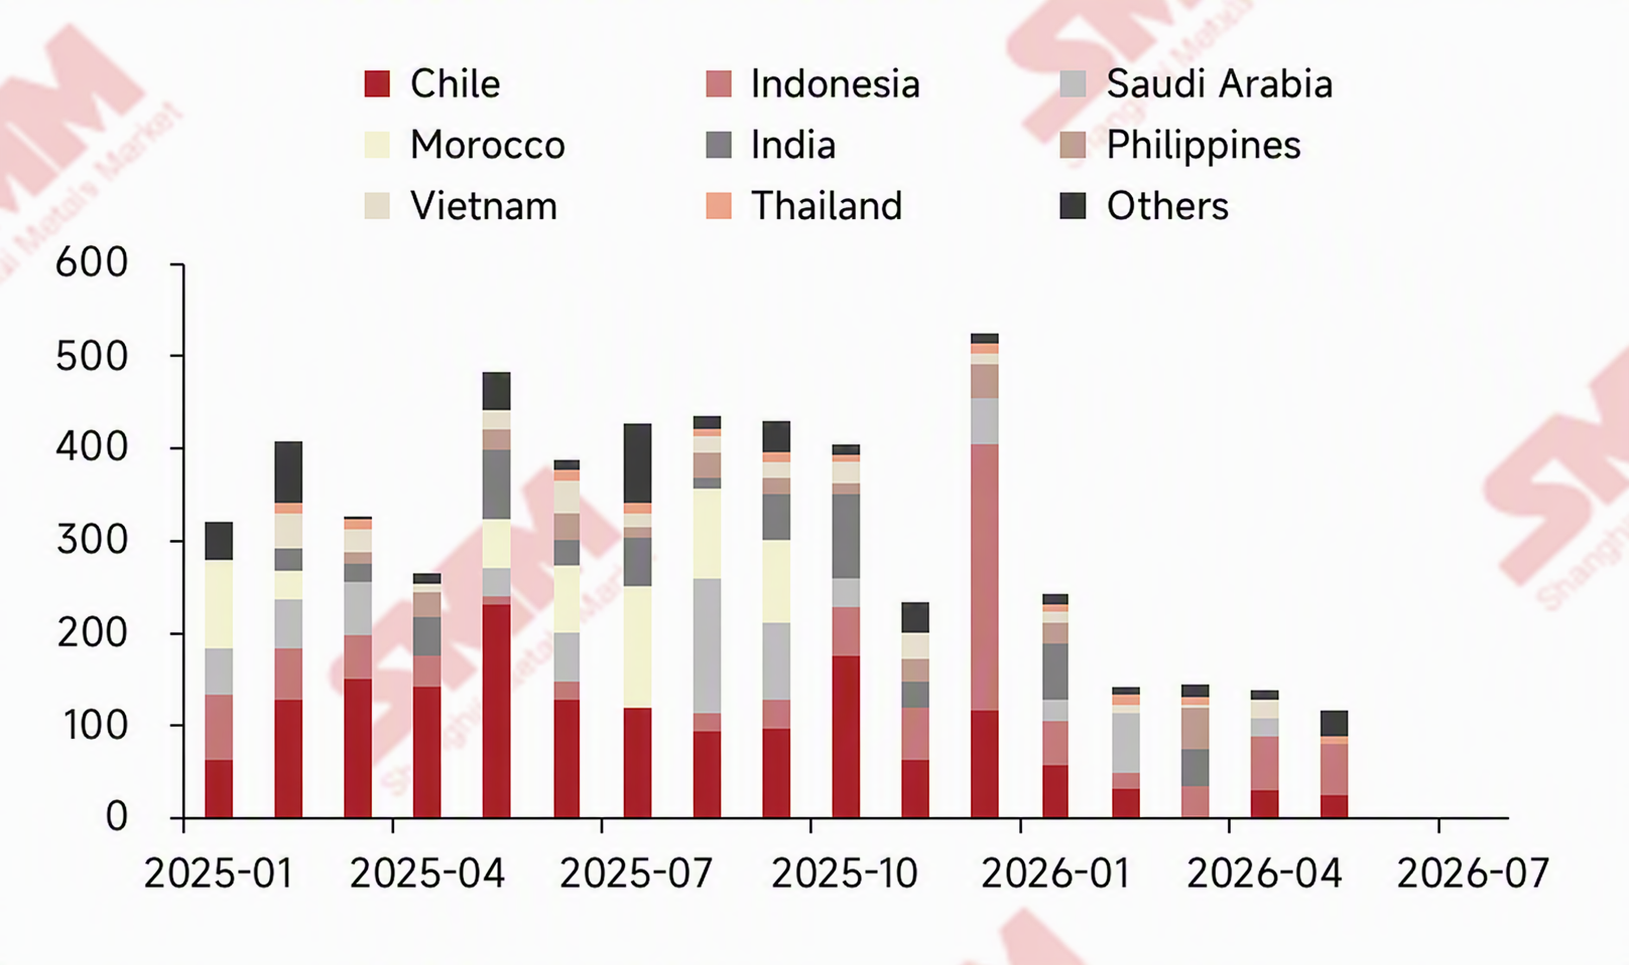
In July 2026, China’s monthly sulphur imports totalled 385,403.834 mt in physical content, up 161.99% MoM and down 64.76% YoY, with the main source countries including the UAE, Oman, Kuwait, Japan, and Taiwan, China;
China’s monthly sulphur exports totalled 1,311.35 mt in physical content, down 96.35% MoM and up 47.87% YoY, with the main destination countries including Indonesia, Myanmar, Vietnam, South Korea, and Cambodia;
China’s monthly sulphuric acid imports totalled 1,066.527 mt in physical content, down 94.56% MoM and down 88.11% YoY, with the main source countries including Taiwan, China, South Korea, Germany, the US, and Japan;
China’s monthly sulphuric acid exports totalled 976.24 mt in physical content, up 8.82% MoM and down 99.75% YoY, with the main destination countries including Hong Kong, China, Vietnam, Angola, Cambodia, and Singapore.
China’s sulphuric acid export data
Cobalt
Cobalt hydrometallurgy intermediate products
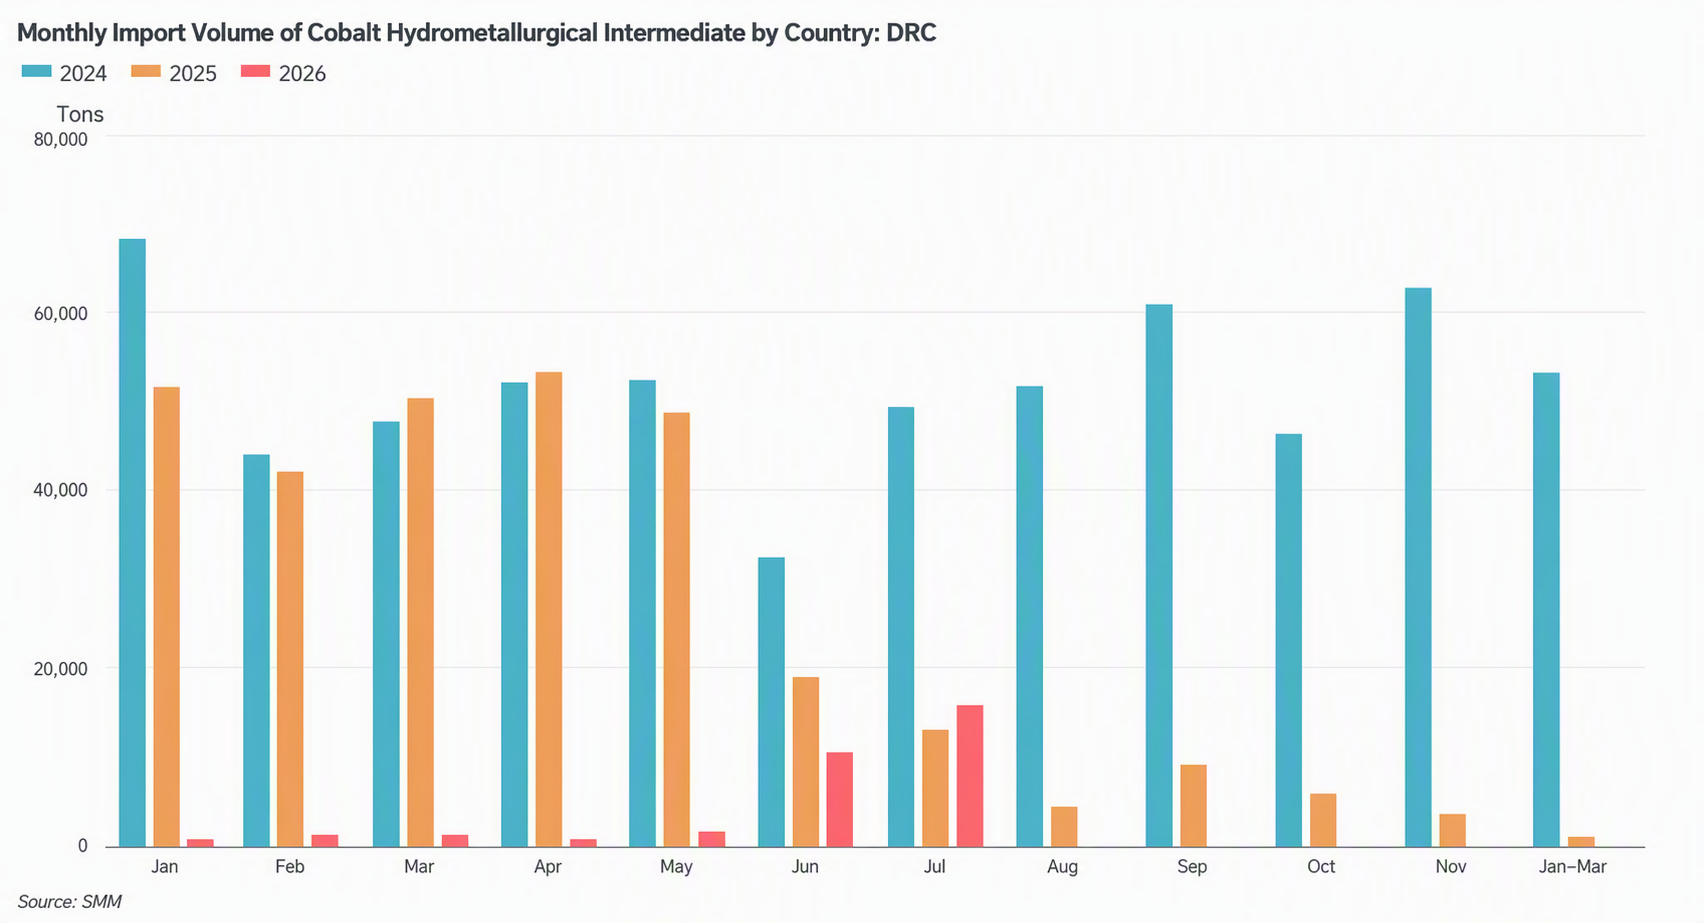
In July 2026, China’s imports of cobalt hydrometallurgy intermediate products were approximately 16,174 mt in physical content, up 48% MoM and up 17% YoY, of which imports from the DRC were approximately 15,970 mt in physical content, up 48% MoM and up 21% YoY. In July 2026, the average import price of China’s cobalt hydrometallurgy intermediate products was $17,915/mt in physical content, up 9.56% MoM. This month, about 10,046 mt in physical content of intermediate products imported by China from the DRC entered Zhejiang Province and Guangdong Province via Entrepot Trade by Customs Special Control Area, accounting for 62.9% of total imports; Ordinary Trade was about 4,243 mt in physical content, accounting for 26.6%; processing trade with imported materials was about 1,681 mt in physical content, accounting for 10.5%. In addition, this month China imported a total of 204 mt in physical content of intermediate products from Russia and Zambia via Ordinary Trade.
Unwrought cobalt
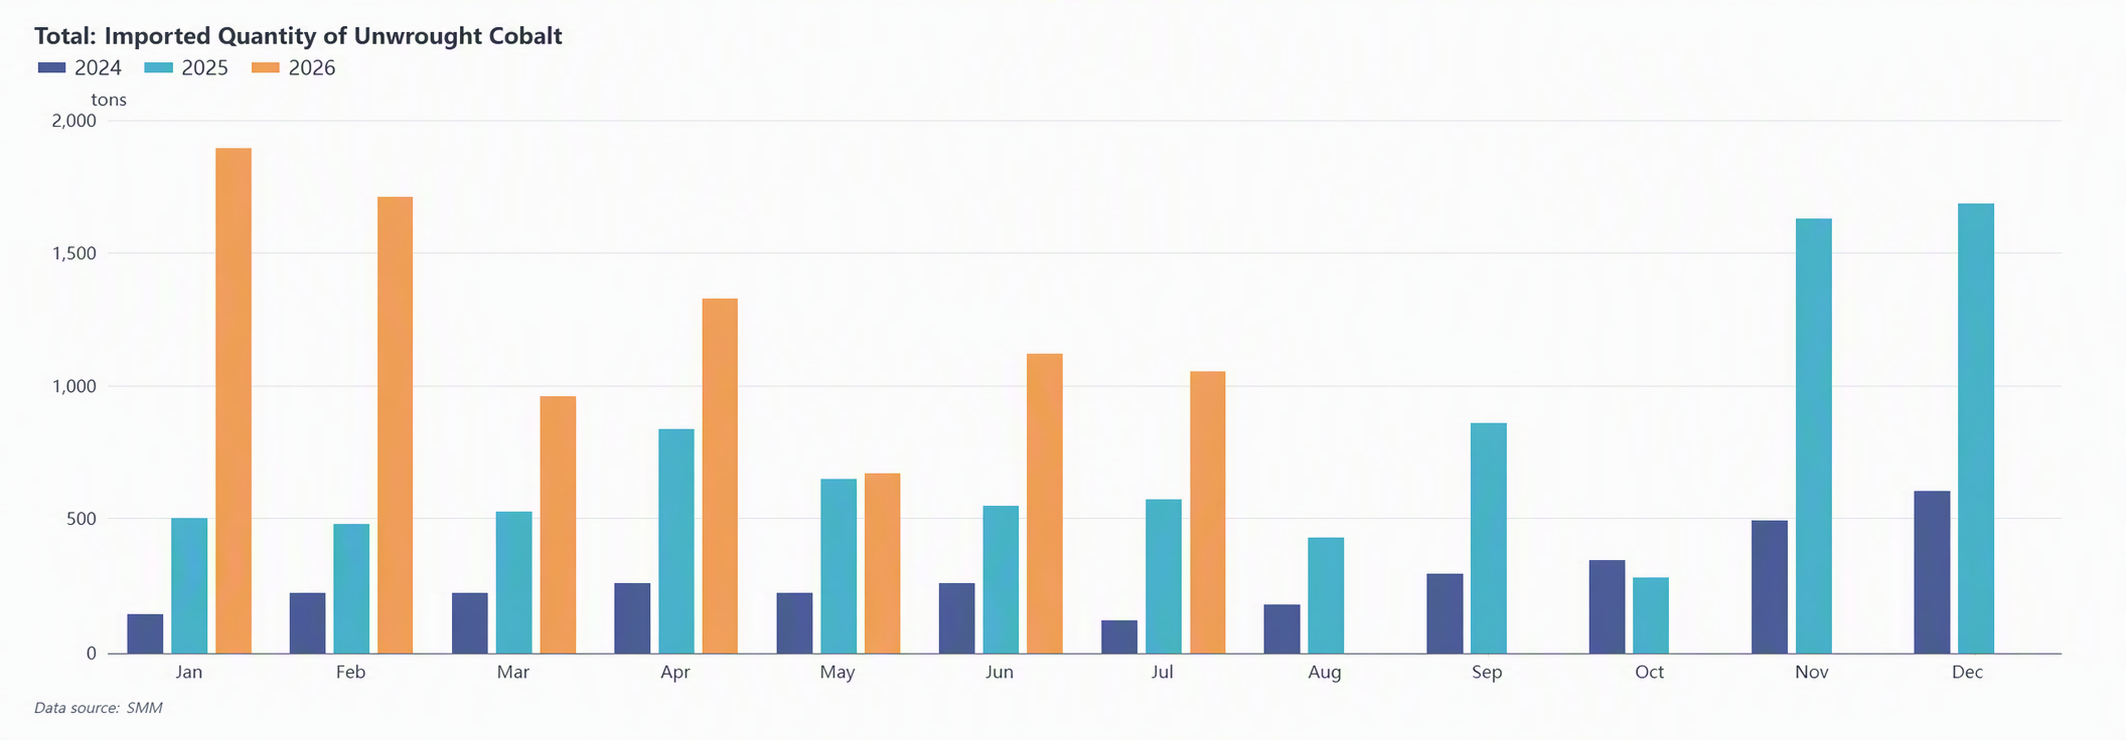
In July 2026, China’s imports of unwrought cobalt were approximately 1,055 mt, down 6% MoM and up 83% YoY. By country, the top three origins for July refined cobalt imports were Indonesia, Russia, and Canada, with imports of 403 mt, 271 mt, and 175 mt, respectively.
In July, China's refined cobalt prices continued to pull back sharply. The low-end price of SMM refined cobalt fell from 378,000 yuan/mt at the beginning of the month to 338,000 yuan/mt at month-end, a decline of about 10.6% MoM. Meanwhile, the low-end price of refined cobalt in overseas Rotterdam warehouses held steady and edged up slightly from $25.00/lb to $25.35/lb. As the price spread between Chinese and overseas markets widened, the theoretical loss on refined cobalt imports expanded from about 65,000 yuan/mt at the start of the month to about 98,000 yuan/mt at month-end, keeping the import window deeply closed. However, due to long-term contracts or operational requirements for certain brands, refined cobalt still needed to be shipped to China, so China's imports remained stable without a significant decline.
By trade mode, about 795 mt of July imports were Entrepot Trade by Customs Special Control Area, accounting for about 75% of the total, with cargo mainly flowing into bonded warehouses in Zhejiang and Shanghai. Only about 259 mt entered China's consumption through Ordinary Trade. The bonded warehouses acted as a "reservoir," showing a certain divergence between import data and actual domestic demand.
In terms of average import price, China's average import price of unwrought cobalt in July 2026 was $59,296/mt, up 13.53% MoM. Cumulative imports from January to July 2026 totaled 8,763 mt, up 113% YoY.
On the export side, China's unwrought cobalt exports in July 2026 were about 313 mt, down 38% MoM and 68% YoY. By country, the top three destinations were the Netherlands, the US, and Japan, with exports of 83 mt, 71 mt, and 49 mt, respectively. The sharp drop in July exports was mainly due to the theoretical profit on refined cobalt exports remaining in a loss range during the first half of July, with a loss of about 0.8 to 10,000 yuan/mt, and the export window being closed, suppressing traders' willingness to export.
Entering August, domestic refined cobalt prices continued to decline. By August 21, the low-end price of SMM refined cobalt had fallen to 300,000 yuan/mt, while the overseas Rotterdam low-end price only pulled back slightly to $24.50/lb. The price spread between Chinese and overseas markets widened further: the theoretical loss on imports expanded to over 130,000 yuan/mt, with no signs of the import window opening in the near term. Meanwhile, the theoretical profit on exports turned positive from late July and continued to widen, reaching about 28,000 yuan/mt by mid-August, reopening the export window. It is expected that China's refined cobalt imports in August will remain at a relatively high level, supported by long-term contract supplies, while exports may rebound after the export window opens and the lag in transportation materializes.