SMM News, August 21:
Recently, the London Metal Exchange (LME) copper market saw a sudden short squeeze. Copper prices shot up, nearing record highs, and the premium (Back) of LME spot prices against the 3M contract once widened to the highest level in nearly five years. On the surface, this rally looked fierce; however, tracing the full sequence of events shows it was not without warning—from rising tariff expectations in late May, to abnormal shifts in inventories and the warrant structure in July, and then to concentrated deliveries and normalization in August. This short squeeze was in fact the result of resonance within a specific time window among tariff expectations, production cuts in Africa, insufficient port arrivals of imported copper, and the delivery-date effect.
1. Tariff Expectations Heated Up, Strengthening the North American Siphon Effect (Late May to July)
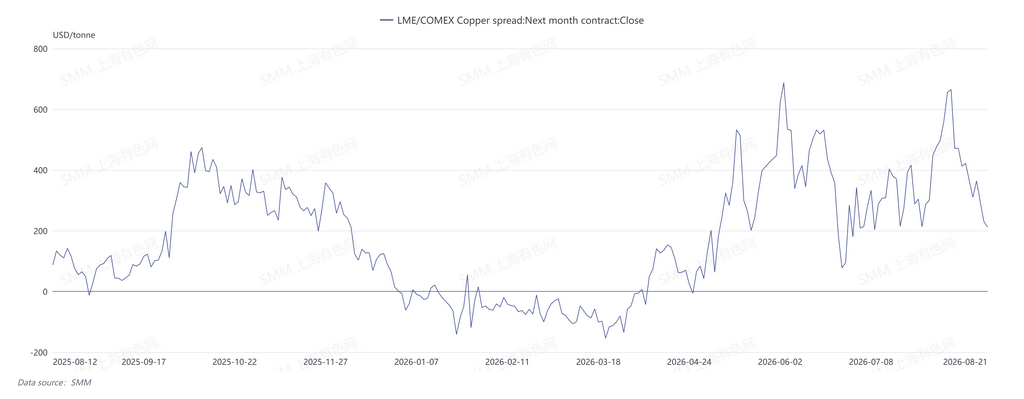
In late May, as the US copper tariff policy was slow to materialize, the price spread between the LME and COMEX widened again. The North American market’s siphon effect on globally available copper resources strengthened accordingly. Some deliverable copper was drawn into US warehouses and end-use consumption, tightening deliverable supply in LME warehouses in Asia and Europe. Although this structural change did not immediately trigger price moves, it had already set the stage.
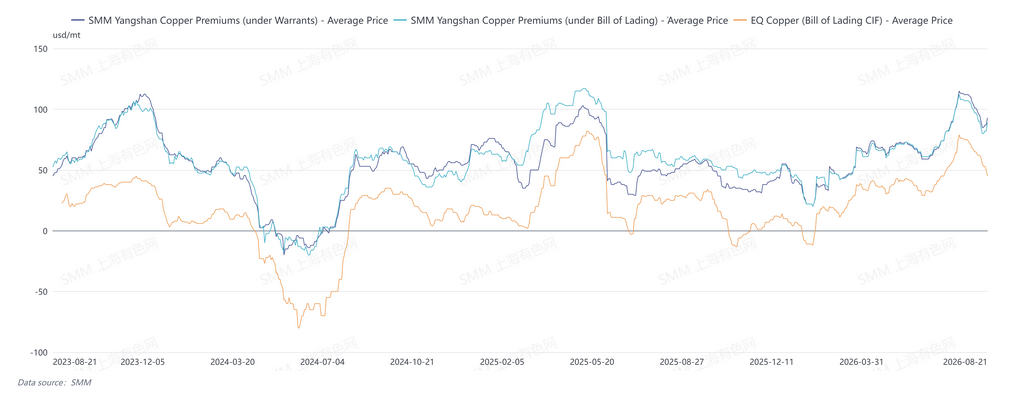
Meanwhile, amid ongoing geopolitical conflicts, costs such as sulphuric acid and energy remained elevated, leading to production cuts in SX-EW copper in Africa. Expectations in the Chinese market for tight available supply of imported copper arriving from July to August began to be gradually realized, with the import arbitrage ratio strengthening at that time. After entering July, China’s imported copper warrant premiums and B/L premiums rose in tandem.
2. Signals Emerged: Abnormal Shifts in Inventories and the Warrant Structure (Mid-to-Late July)
In mid-to-late July, the market continuously released multiple key signals pointing to the brewing of a short squeeze.
On July 16, LME copper inventories fell to 296,600 mt, breaking below the 300,000 mt threshold; over the same period, China’s copper cathode social inventory fell to 123,400 mt. Inventories in both major markets declined simultaneously, indicating that global available copper supply was already tight.
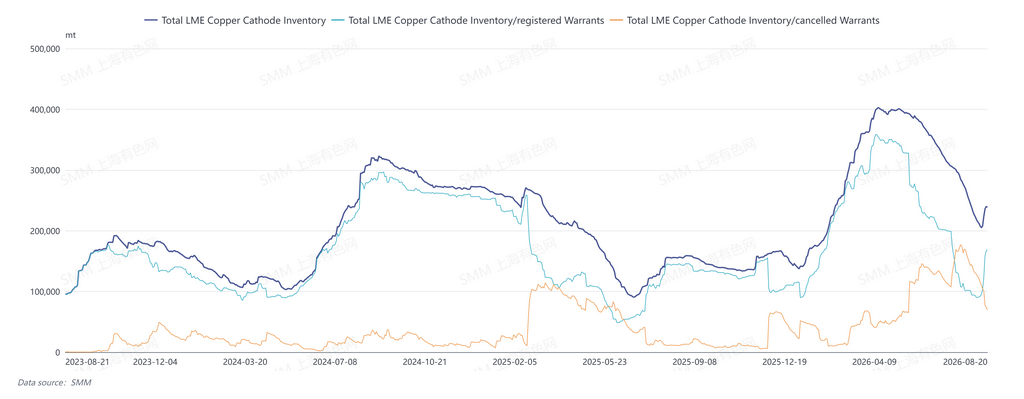
On July 21, LME copper inventories further fell to 284,200 mt, of which registered warrants were only 107,200 mt, while cancelled warrants were as high as 177,000 mt, pushing the ratio of cancelled warrants up to 62.29%. Aside from US warehouses, cancelled warrants were mainly concentrated in warehouses in Asia. Although some cargo was drawn into the Chinese market, actual port arrivals were limited—according to the latest customs data, China imported 245,000 mt of copper cathode in July 2026, down 13.77% MoM and down 2.27% YoY.
On July 22, the average SMM Yangshan copper warrant premium was $115/mt, the average Yangshan copper B/L premium was $112/mt, and the average CIF China EQ copper premium was $79/mt, with all three indicators hitting new highs for the year. The broad-based climb in premiums showed that expectations of tight supply and demand in China’s imported copper market had been fully reflected at the spot level.
3. Inventories Hit Bottom and the Export Window Briefly Opened
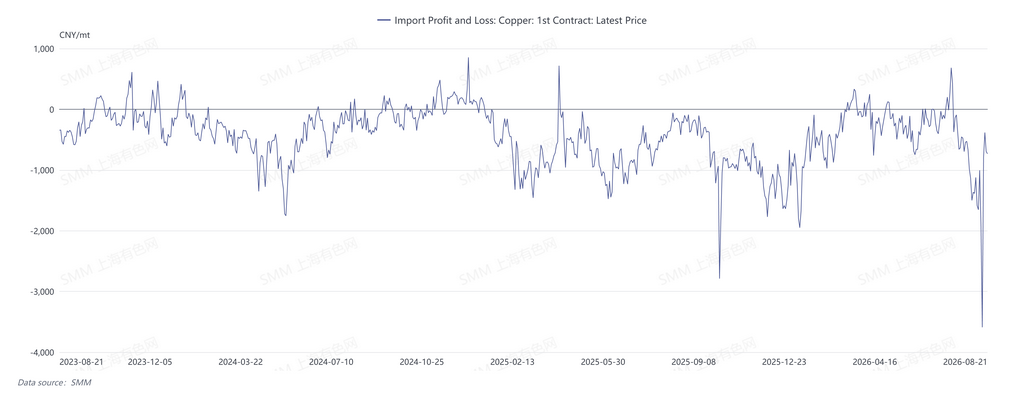
From late July to early August, LME copper inventories fell further, the backwardation structure in nearby contracts gradually widened, and China’s copper cathode import arbitrage ratio continued to deteriorate, briefly opening the export window. However, this coincided with the maintenance period at domestic smelters, and the August contract was approaching delivery. In practice, only a small volume of copper cathode exports flowed into China’s bonded zones—while the export window opened, exportable supply was severely insufficient, making it difficult to offset the shortage of deliverable supply on the LME side.
4. Short Squeeze Erupted: Tight Deliverable Supply Triggered a Sharp Widening of the Back (Mid-August)
On August 13, LME inventories fell to a period low of 205,000 mt. On the delivery date of August 17, due to a severe shortage of deliverable warrants, a short squeeze emerged in the market, and the Back structure of the LME Cash contract against 3M suddenly widened to as high as $553/mt. On the same day, the LME 3M futures contract once shot up to $14,396/mt, nearing record highs.
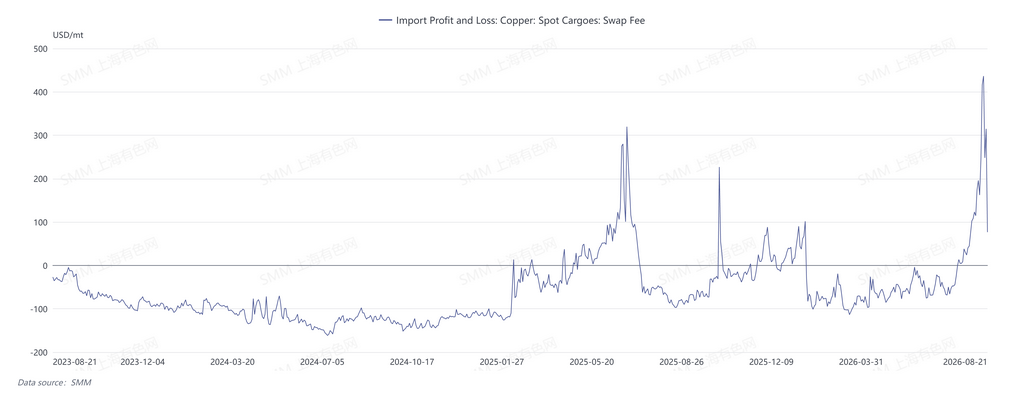
Multiple contradictions accumulated earlier were released in a concentrated manner on the key period of the delivery date, forming the climax of this round of moves. This also indicates from another angle that the widening of the Back was not a curve-structure backwardation, but rather a nearby squeeze triggered by the approaching delivery date and a shortage of deliverable supply.
5. Concentrated Shipments to Delivery Warehouses and Market Normalization (August 17 to 20)
The high backwardation structure immediately triggered a chain reaction of arbitrage shipments to delivery warehouses. From August 17 to 19, in just three trading days, LME inventories increased by a cumulative 32,000 mt, and the ratio of cancelled warrants quickly pulled back from the high of 62.29%—meaning that a large number of previously cancelled warrants were re-registered as deliverable warrants, and copper prices subsequently pulled back from elevated levels.
As of August 20, the premium of the LME spot contract against 3M had pulled back significantly. On that day, total LME inventories rebounded to 238,600 mt, including 168,600 mt of registered warrants and 70,000 mt of cancelled warrants, with the ratio of cancelled warrants falling to 29.33%. By region, inventories were 114,100 mt in Asia, 18,300 mt in Europe, and 106,200 mt in North America. The market seems to be gradually returning to "normal": import parity is recovering, the LME backwardation structure has narrowed, and fluctuations in China's imported copper premium are relatively stable. However, this return is more due to the return of warrants brought about by concentrated deliveries to warehouses, rather than a fundamental improvement in supply-demand fundamentals.
6. Outlook: Temporary Return and Potential Risks Coexist
The current LME copper market has experienced a complete cycle of "squeeze → delivery to warehouse → return." On the surface, the high backwardation structure has been alleviated, inventory has rebounded, and market sentiment has stabilized. However, it is necessary to be cautious that the following factors may still trigger subsequent fluctuations:
First, inventory remains at low levels, with regional inventory extremely unbalanced. Although LME and SHFE inventories have rebounded, they are still at historically low levels, leaving limited buffer space for deliverable supply. LME inventory is now heavily concentrated in North America and Asia, while deliverable inventory in Europe is extremely low. Any demand or supply shock that exceeds expectations could trigger structural market moves again.
Second, US copper tariffs are still pending. This was the initial trigger of the current market move and is also the most uncertain variable. Once the tariff policy is implemented, it will directly affect the global flow of copper logistics and the regional distribution of LME inventory, potentially triggering cross-market arbitrage and structural anomalies again.
Third, the sustainability of the backwardation narrowing is questionable. The current pullback in backwardation is mainly due to the return of warrants from concentrated deliveries to warehouses, rather than a fundamental improvement in supply-demand fundamentals.
In summary, the current round of LME copper squeeze scenario is a typical event triggered by the resonance of tariff expectations, production cuts in Africa, insufficient import arrivals, and the delivery date effect within a specific time window. Although the market has temporarily returned to normal, the underlying contradictions have not been fully resolved. The outlook still requires continuous monitoring of the two main themes: inventory structure and tariff policy.
![July 2026 Copper Anode Imports Hit Year High, Cumulative Imports Edge Up YoY [SMM Analysis]](https://imgqn.smm.cn/usercenter/aMTzL20251217171710.jpg)