Data Notes
-
Sulphur : HS codes 25030000 (various sulphur, excluding sublimed/precipitated/colloidal sulphur) + 28020000 (sublimed/precipitated/colloidal sulphur)
-
Sulphuric Acid : HS code 28070010 (sulphuric acid, H₂SO₄ content >80%)
-
Total Volume : H1 2026 sulphur 1.8481 million mt (1,848,104,145 kg), down 29.4% compared with H1 2025 (2.6191 million mt) ; sulphuric acid 560,600 mt (560,640,243.7 kg)
-
Value : total sulphur imports approx. $1.421 billion , overall average price $769/mt ; total sulphuric acid imports approx. $111.47 million , overall average price $199/mt
-
Price Treatment : monthly average prices exclude sample/non-commercial trade outliers of single batches <100 kg, retaining large-scale commercial batches
1. Sulphur: Volume contracted nearly 30%, prices followed an “N-shaped” trajectory before surging in June
1.1 Monthly import volume and price trends

Trend Interpretation :
-
January-February : market stable, average price held at $685-693/mt, imports pulled back 30% MoM in February due to Chinese New Year factors.
-
March-April : imports shot up then pulled back (reaching a H1 peak of 412,800 mt in March), yet prices fell for three consecutive months to $599/mt, a H1 low. The main reason was a temporary global sulphur supply surplus, with intense competition among Middle Eastern cargoes.
-
May-June : prices reversed sharply higher, with the June average spiking to $885/mt , an increase of $286/mt (+47.8%) from the April low. Concentrated stockpiling for HPAL projects at Indonesian nickel smelters, a recovery in international phosphate fertiliser demand, and suppliers holding prices firm jointly drove this rally. Notably, June imports did not rise alongside prices but rather fell 11.2% MoM, presenting a “volume down, price up” pattern, reflecting that high prices dampened purchase willingness.
1.2 Key source countries: Saudi Arabia led, Canada emerged
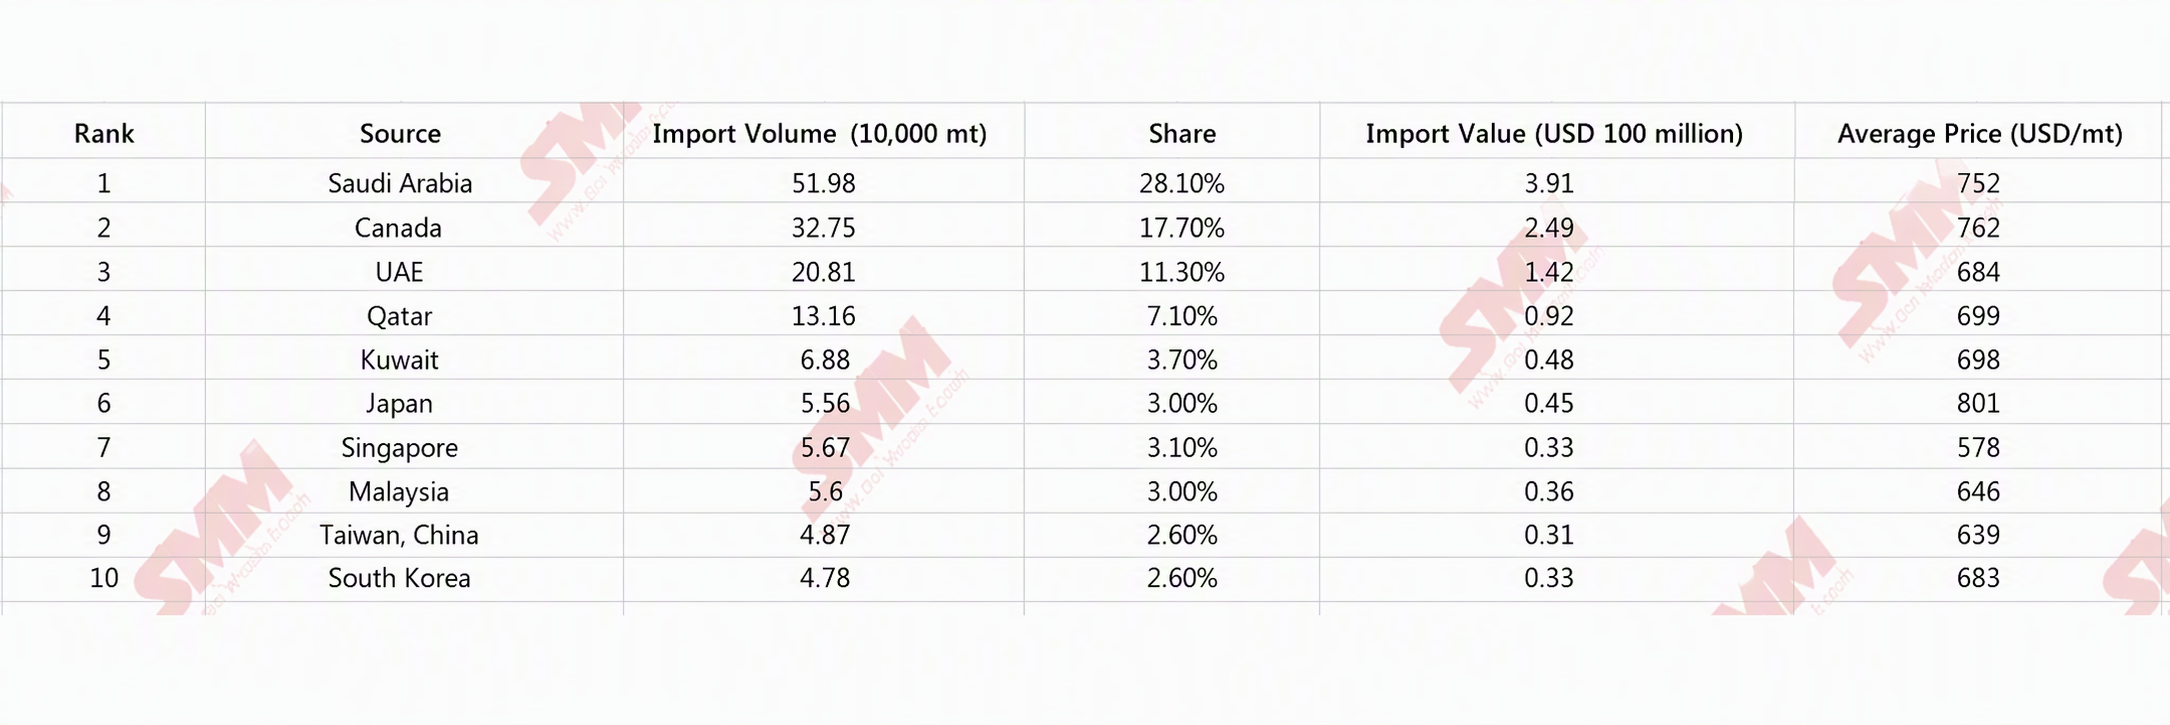
Key Observations :
-
Five Middle Eastern countries (Saudi Arabia + UAE + Qatar + Kuwait + Bahrain + Oman) together supplied approx. 1.033 million mt, accounting for 55.9% , remaining the largest supply bloc, though down notably from around 62% in H1 2025.
-
Canada’s share jumped from about 6.6% in H1 2025 to 17.7%, with imports up 90.4% YoY (from 172,000 mt to 328,000 mt), making it the second-largest source. Canadian high-purity solid sulphur adapts well to nickel smelting applications, and its shipping routes from West Coast ports to Indonesia are more competitive than those from the Middle East (despite the greater distance, Panamax freight advantages emerged amid rate fluctuations).
-
Japan recorded the highest average price ($801/mt) , mainly because its exports are mostly high-grade liquid sulphur with significant loading and purity premiums; Singapore had the lowest average price ($578/mt) , as some volumes are re-export trade blended with low-grade or by-product sulphur.
1.3 Key destination ports: three major nickel parks absorbed over half

The three major nickel smelting parks—WEDA, MOROWALI, and OBI ISLAND—together imported 1.0289 million mt, accounting for 55.7% of Indonesia’s total sulphur imports. These three parks are the core hubs for downstream nickel ore processing (including HPAL and RKEF-linked sulphuric acid/fertiliser plants), and their sulphur import demand is entirely driven by the nickel industry. Tanjung Priok, the outer port of Jakarta, mainly serves traditional chemical and fertiliser industries on Java.
1.4 YoY volume decline breakdown: Middle East four countries cut 1.52 million mt

Main Reasons for the Decline : ① International sulphur prices strengthened continuously from end-2025 to June 2026, leading Middle Eastern suppliers to divert more cargoes to higher-price markets such as India, China and North Africa; ② Some newly built sulphur-based acid plants in Indonesia came onstream, partly displacing imported sulphur. Incremental volumes from Canada (+155,500 mt) and the Philippines (+20,000 mt) only offset about 12% of the reduction, far from enough to compensate.
2. Sulphuric Acid: Imports grew against the tide, price elasticity far exceeding that of sulphur
2.1 Monthly import volume and price trends

Trend Interpretation :
-
January : import volume very low (8,300 mt), due to mismatched contract execution around Chinese New Year and smelter maintenance.
-
February-April : imports climbed month by month, hitting a H1 peak of 179,500 mt in April, with the average price rising from $145/mt to $182/mt over the same period. Concentrated commissioning of downstream HPAL projects released rigid demand.
-
May : imports plunged 68% MoM (to 57,200 mt), but the average price jumped to $241/mt. The main reasons were annual maintenance at several smelters in Japan and South Korea, which tightened sulphuric acid export availability, shrinking supply and causing prices to leap.
-
June : imports rebounded to 115,100 mt, with the average price surging to $309/mt , up 119% from January. A triple combination of cost pass-through from the $885/mt sulphur price in June, ongoing maintenance in Japan and South Korea, and panic restocking by Indonesian local smelters drove this surge, recording the highest monthly average price for Indonesia’s sulphuric acid imports in recent years.
2.2 Key source countries: East Asia’s top three accounted for nearly 90%
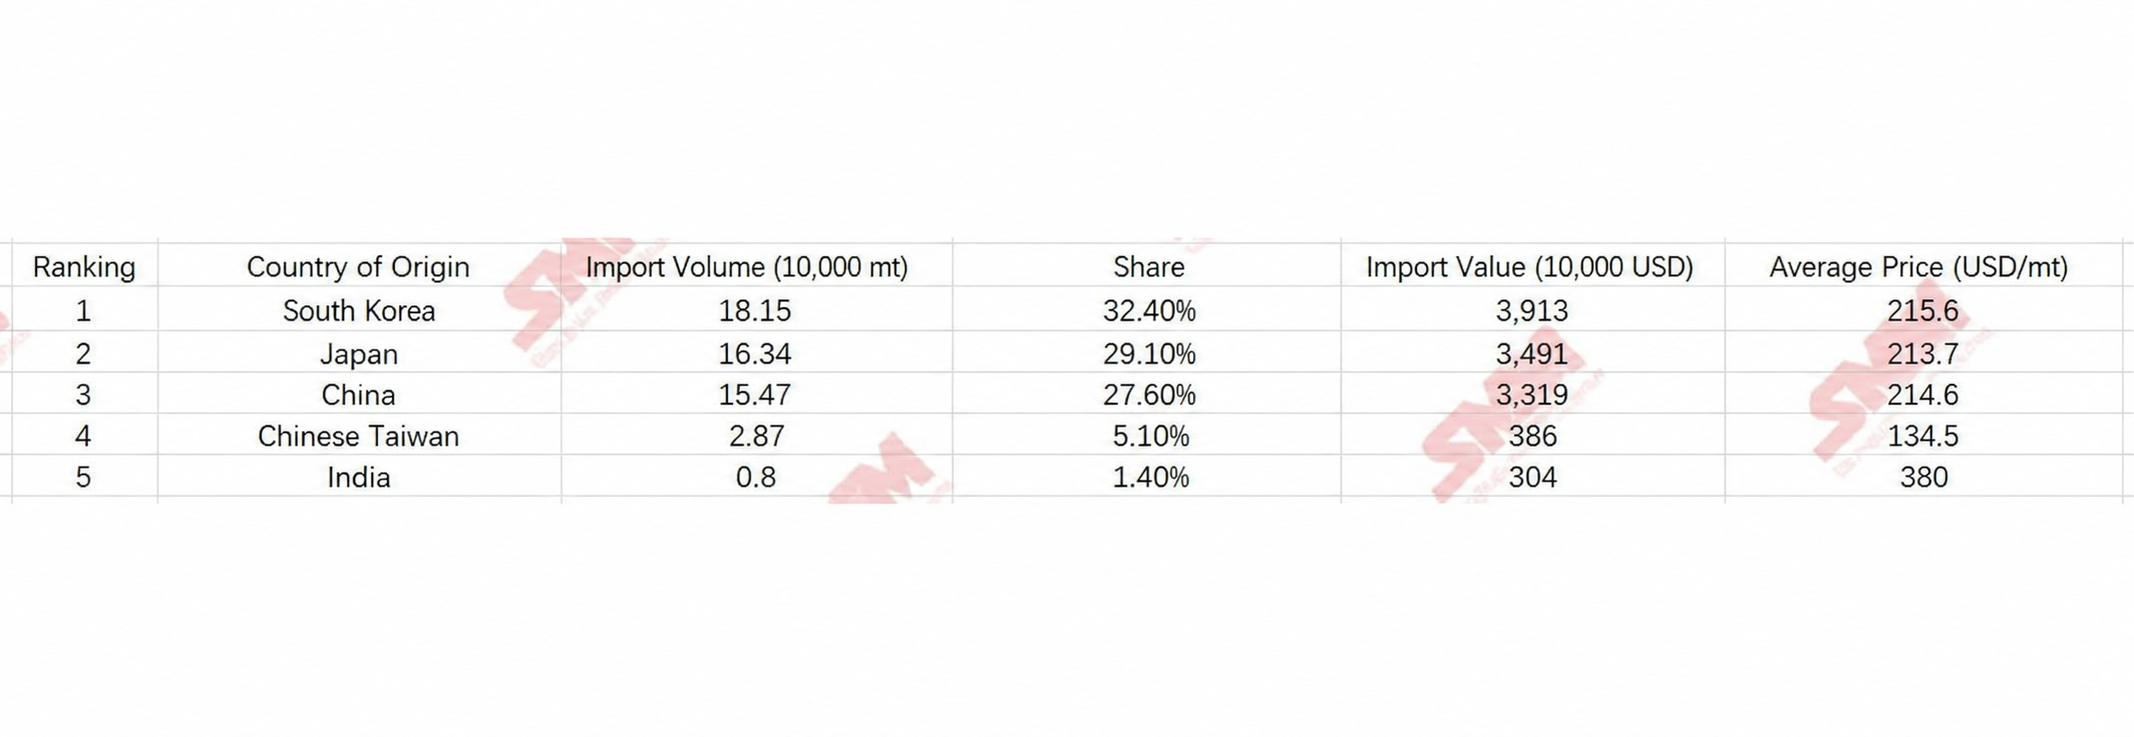
South Korea, Japan, and China together supplied 500,000 mt, making up 89.1% of national sulphuric acid imports. Sulphuric acid is highly corrosive with a limited shipping radius (usually no more than 3,000 nautical miles), so regional proximity gives East Asian countries their dominant position. India’s average price reached as high as $380/mt, attributable to special high-purity/oleum specifications—small volume with a high price. Taiwan’s average price was only $134.5/mt, a price lowland, benefiting mainly from its developed refinery by-product acid and short-sea freight cost advantages.
2.3 Key destination ports: OBI ISLAND took one-third
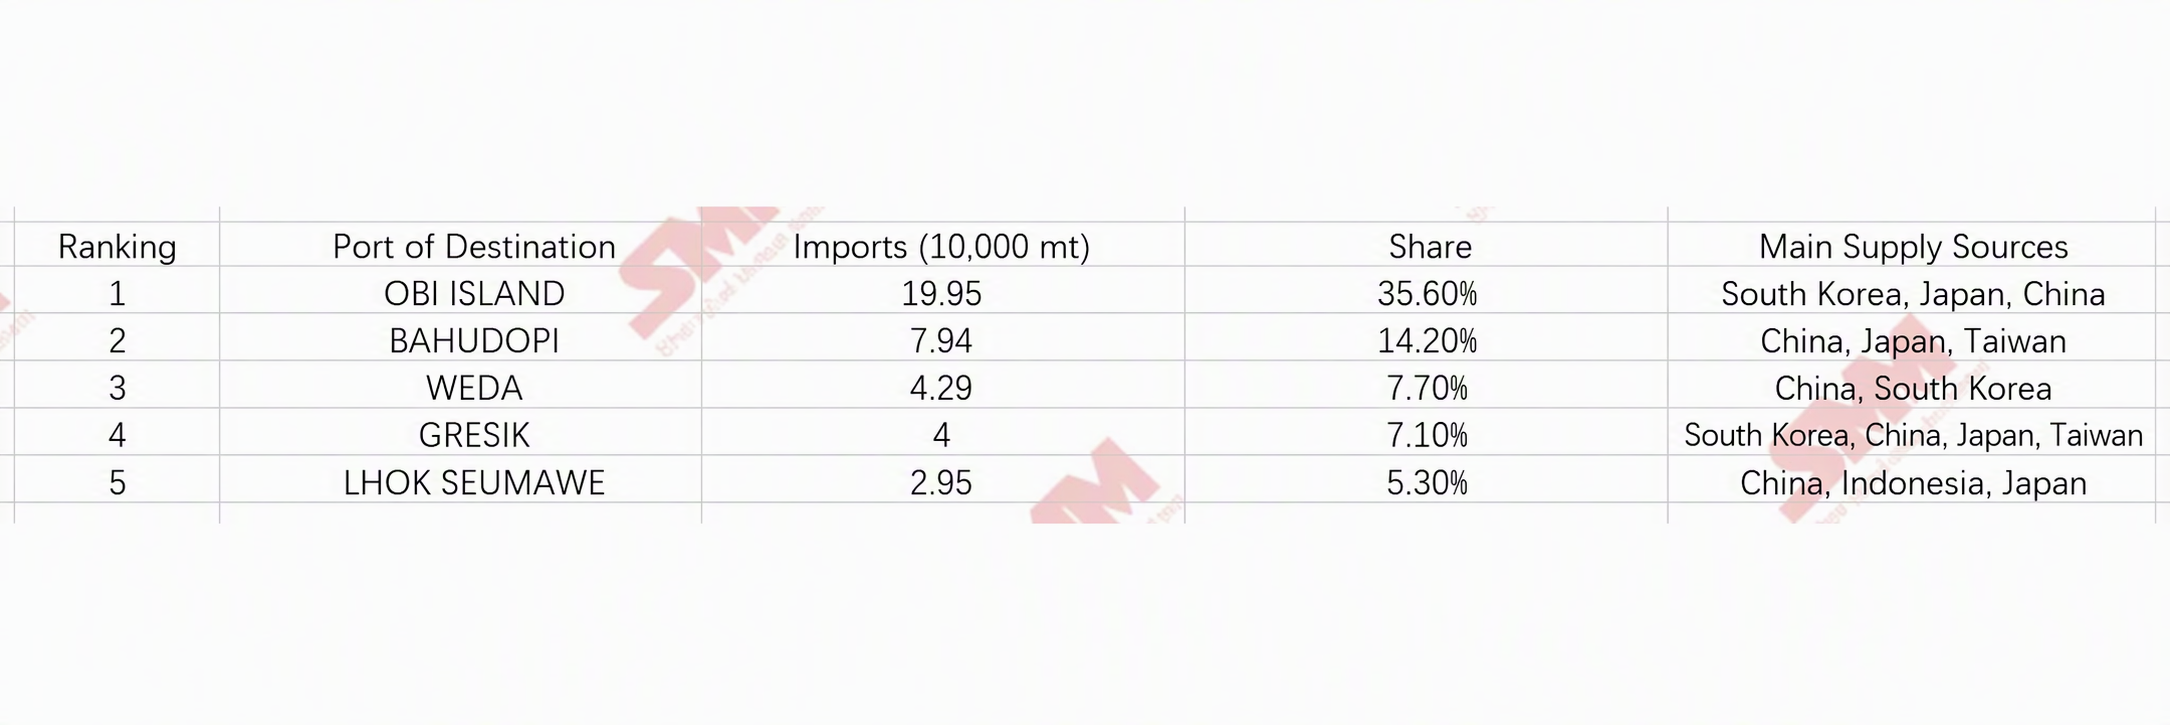
OBI ISLAND alone accounted for 35.6% ; this island hosts multiple nickel-cobalt hydrometallurgy (HPAL) projects led by Chinese and South Korean capital and has enormous demand for finished sulphuric acid. The top three ports (OBI + BAHUDOPI + WEDA) together represented 57.5% , closely matching the concentration of the top three sulphur ports (55.7%), once again confirming the heavy overlap in demand between the two commodities.
3. Combined Sulphur and Sulphuric Acid Analysis: Volume-price linkages and landscape differentiation
3.1 Volume and price elasticity comparison

Price Transmission and Elasticity Differential :
-
The June average sulphuric acid price ($309/mt) rose $168/mt from January ($141/mt), a gain of 119% ; over the same period, sulphur prices rose only 29.2%. Sulphuric acid’s price elasticity far exceeded that of sulphur because its own supply-demand fundamentals are tighter (maintenance in Japan and South Korea, rigid demand in Indonesia) and the spot market is small, making it highly susceptible to marginal supply-demand changes.
-
The sulphur-to-sulphuric acid import volume ratio shifted from 35:1 in January (as acid imports were extremely low) to 2.0–4.2:1 from February to June, reflecting Indonesia’s dynamic balance between “importing sulphur for self-production of acid” and “directly importing finished acid”. When sulphur prices are elevated (e.g., $885/mt in June), some smelters prefer to directly purchase finished acid to avoid operating costs of acid plants, supporting the June rebound in acid imports.
3.2 Supply landscape comparison

Sulphur sources have become more diversified (large shares from the Middle East, North America, and Southeast Asia), while sulphuric acid supply is highly concentrated among near-neighbour East Asian countries. This is determined by the global trade characteristics of the two commodities: sulphur can be shipped over long distances by sea (Capesize/Panamax vessels), whereas sulphuric acid is constrained by corrosiveness and transportation costs, resulting in a shorter trading radius.
3.3 2025→2026 structural change summary

Core Conclusion : Indonesia’s sulphur imports experienced “volume down, price up”, with Middle Eastern supply sharply retreating and Canada rapidly filling the gap; sulphuric acid imports saw “volume and price both up”, with direct imports of finished acid becoming an important way to compensate for acid production shortfalls, and their price increase significantly outpacing that of sulphur.
3.4 H2 outlook
-
Sulphur : The June price of $885/mt is already curbing procurement; prices are expected to remain consolidating at highs in H2, with geopolitical conflict developments to monitor. Indonesia’s full-year imports are projected at 3.6–3.8 million mt, down about 20% YoY.
-
Sulphuric Acid : Supply may recover after the maintenance season at Japanese and South Korean smelters, but multiple HPAL projects in the OBI Island and WEDA areas are still in the capacity ramp-up phase; H2 monthly average imports are likely to hold at 100,000–120,000 mt, with the average price likely consolidating at highs in the $260–330/mt range.
-
Landscape Evolution : Canada’s sulphur exports to Indonesia are expected to surpass Saudi Arabia as the top supplier by 2027; there is still room for growth in Chinese sulphuric acid exports to Indonesia, especially by-product acid from integrated refinery-chemical enterprises along the east and south coasts of China.
Data Sources : Indonesia Customs import and export statistics under HS codes 25030000, 28020000, 28070010 for January-June 2025 and January-June 2026, verified item-by-item, month-by-month, and by country/port. Total volume data has been cross-checked with users; monthly data are commercial batch aggregates based on original detailed records (calibrated proportionally after excluding <100 kg samples), and values and average prices correspond to actual commercial imports.
![[SMM Manganese Ore Weekly Review] Spot Market Recovers, Traders Increasingly Hold Back from Selling](https://imgqn.smm.cn/usercenter/rUQIB20251217171723.jpeg)
![[Changan Automobile: August sales 196,800 units, NEV sales up 12.98% YoY]](https://imgqn.smm.cn/usercenter/QBuyW20251217171726.jpg)