According to customs statistics, in the first seven months of 2026, the total import and export value of China's goods trade reached 30.13 trillion yuan, a YoY (the same hereinafter) increase of 17.3%. Exports were 17.44 trillion yuan, up 14%; imports were 12.69 trillion yuan, up 22%. In July, the total import and export value of China's goods trade was 4.66 trillion yuan, up 19.2%. Exports were 2.71 trillion yuan, up 17.8%; imports were 1.95 trillion yuan, up 21.2%.
By trade mode, in the first seven months, China's ordinary trade imports and exports reached 18.13 trillion yuan, up 10.2%; processing trade imports and exports stood at 5.81 trillion yuan, up 26.3%; bonded logistics imports and exports were 5.18 trillion yuan, up 40.8%.
By trading partner, in the first seven months, China's trade with ASEAN totaled 5.14 trillion yuan, up 20%; with the EU, it was 3.67 trillion yuan, up 9.5%; with the US, it was 2.38 trillion yuan, down 1.6%. Over the same period, China's combined imports and exports with Belt and Road partner countries amounted to 15.36 trillion yuan, up 15.5%.
By type of enterprise, in the first seven months, private enterprises' imports and exports stood at 17.16 trillion yuan, up 17.2%; foreign-invested enterprises' imports and exports were 8.78 trillion yuan, up 17.6%; state-owned enterprises' imports and exports reached 4.14 trillion yuan, up 17.3%.
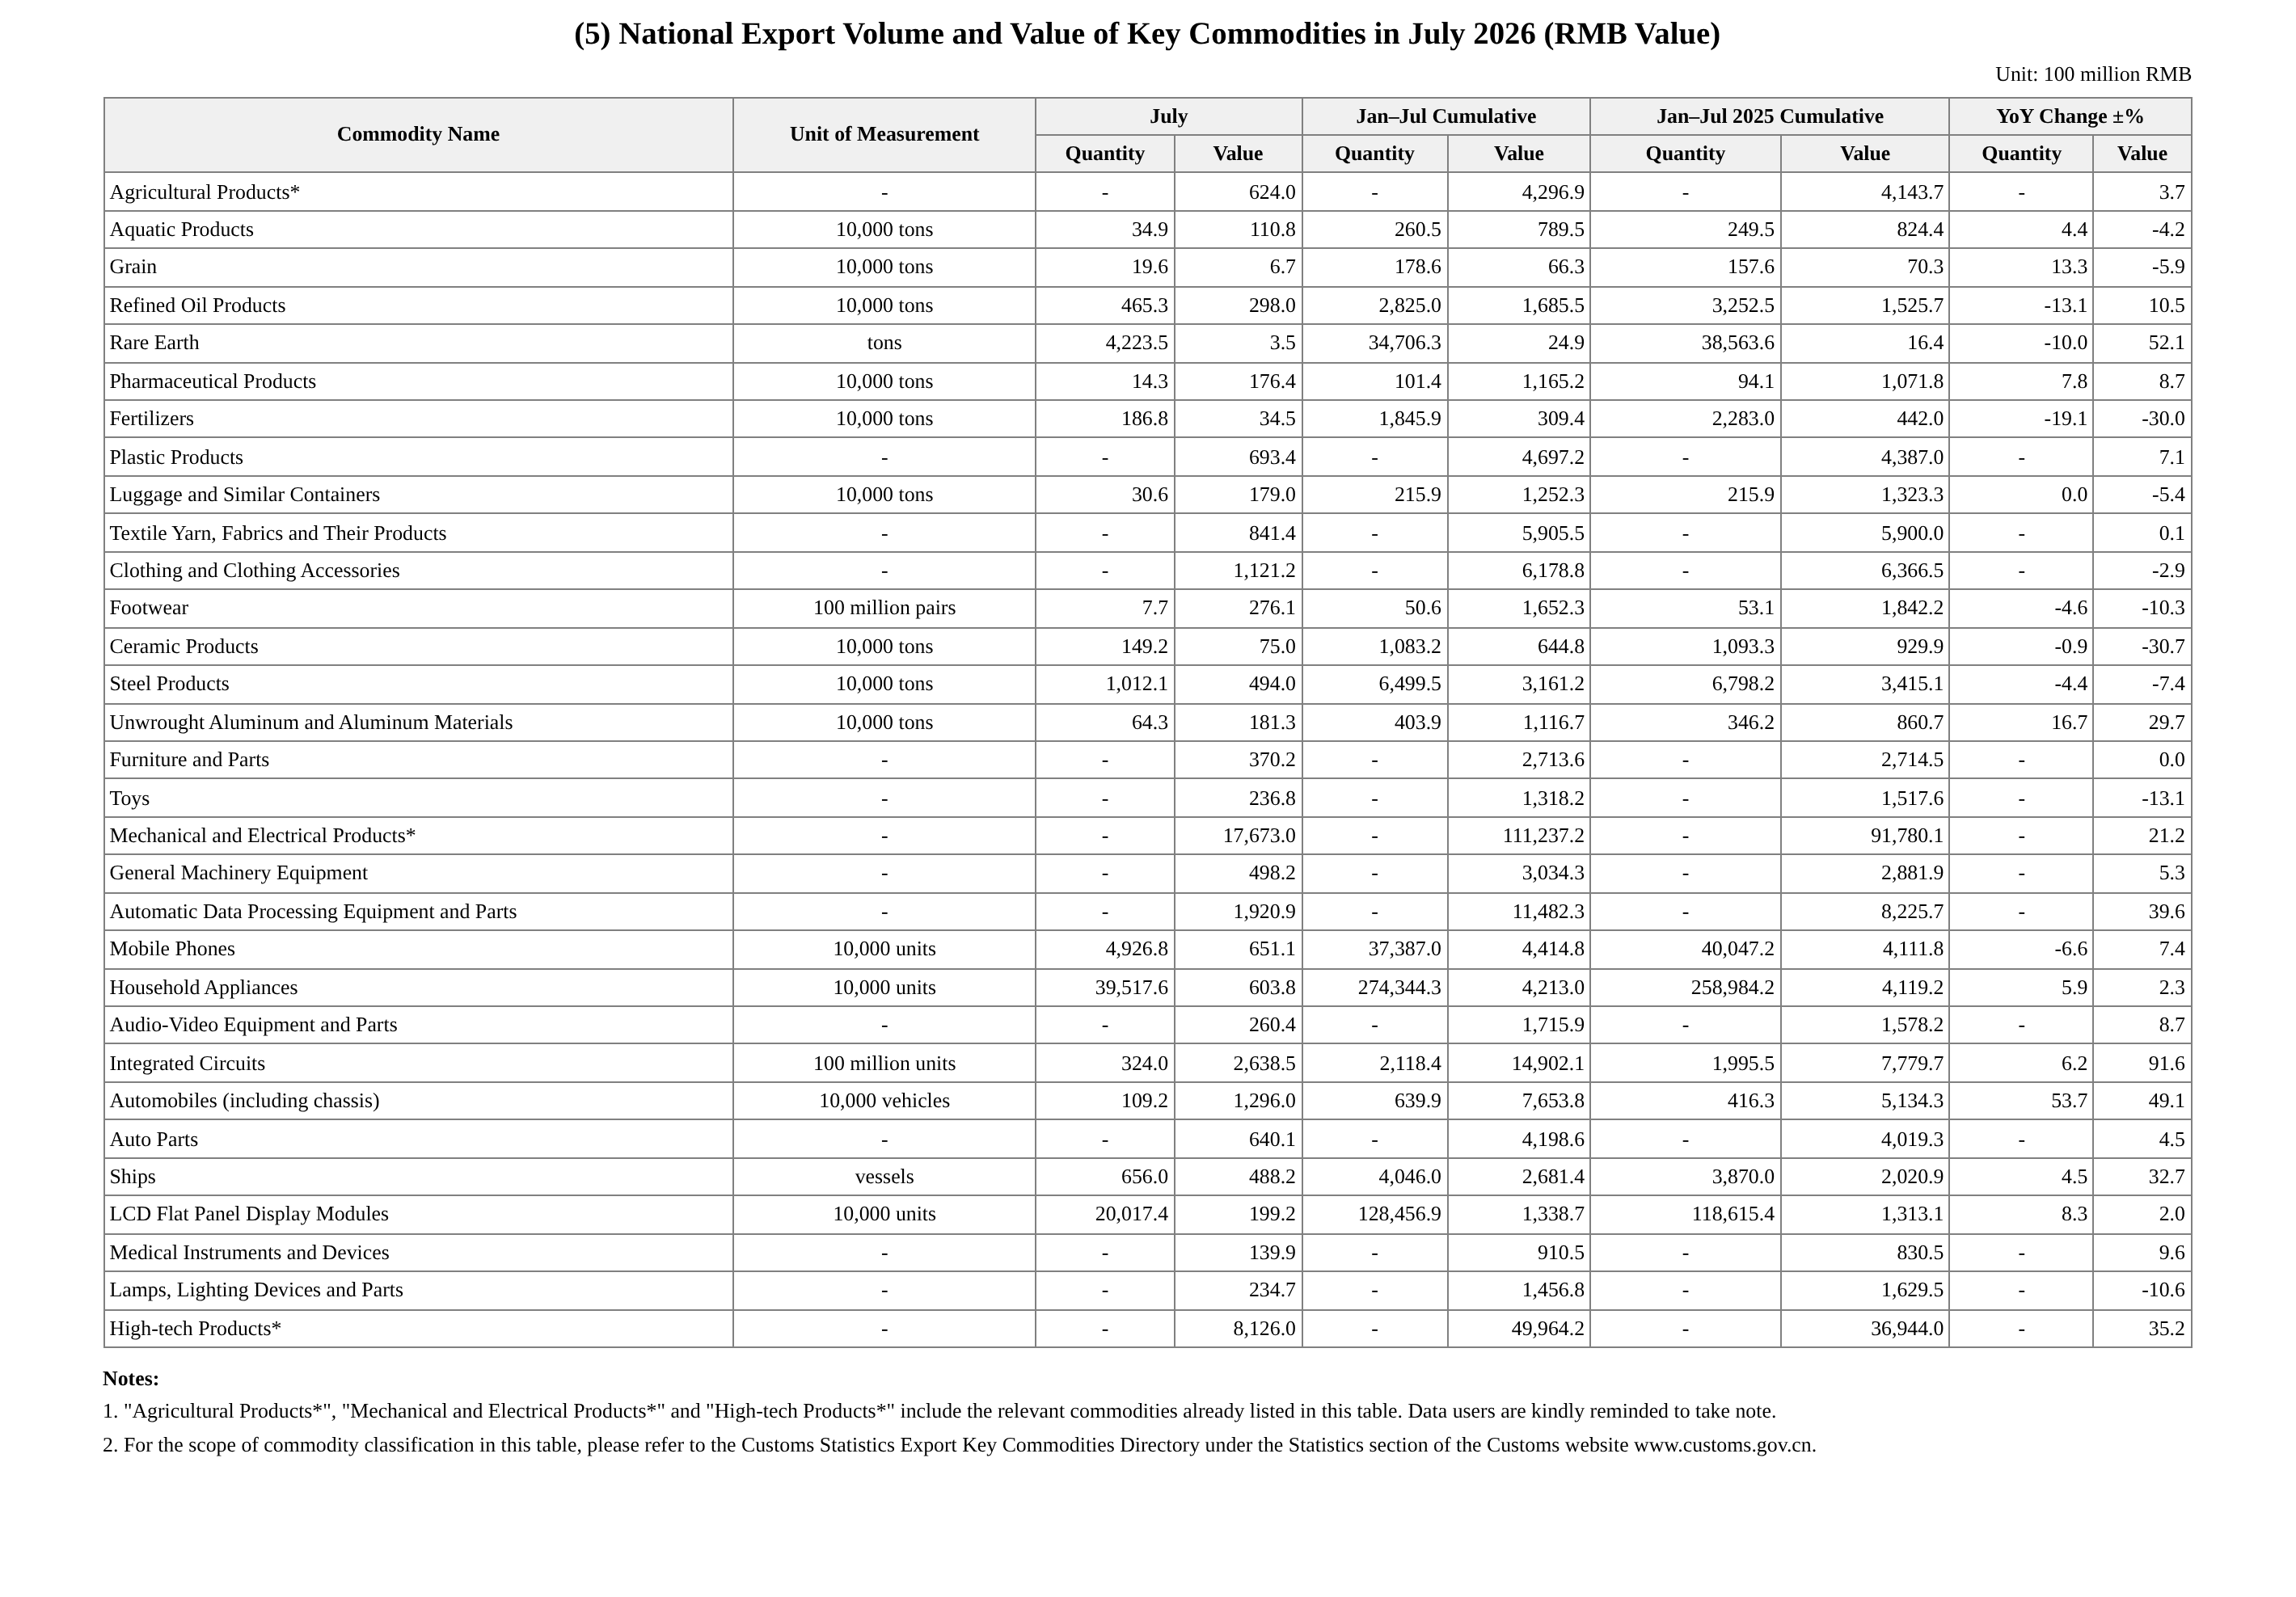
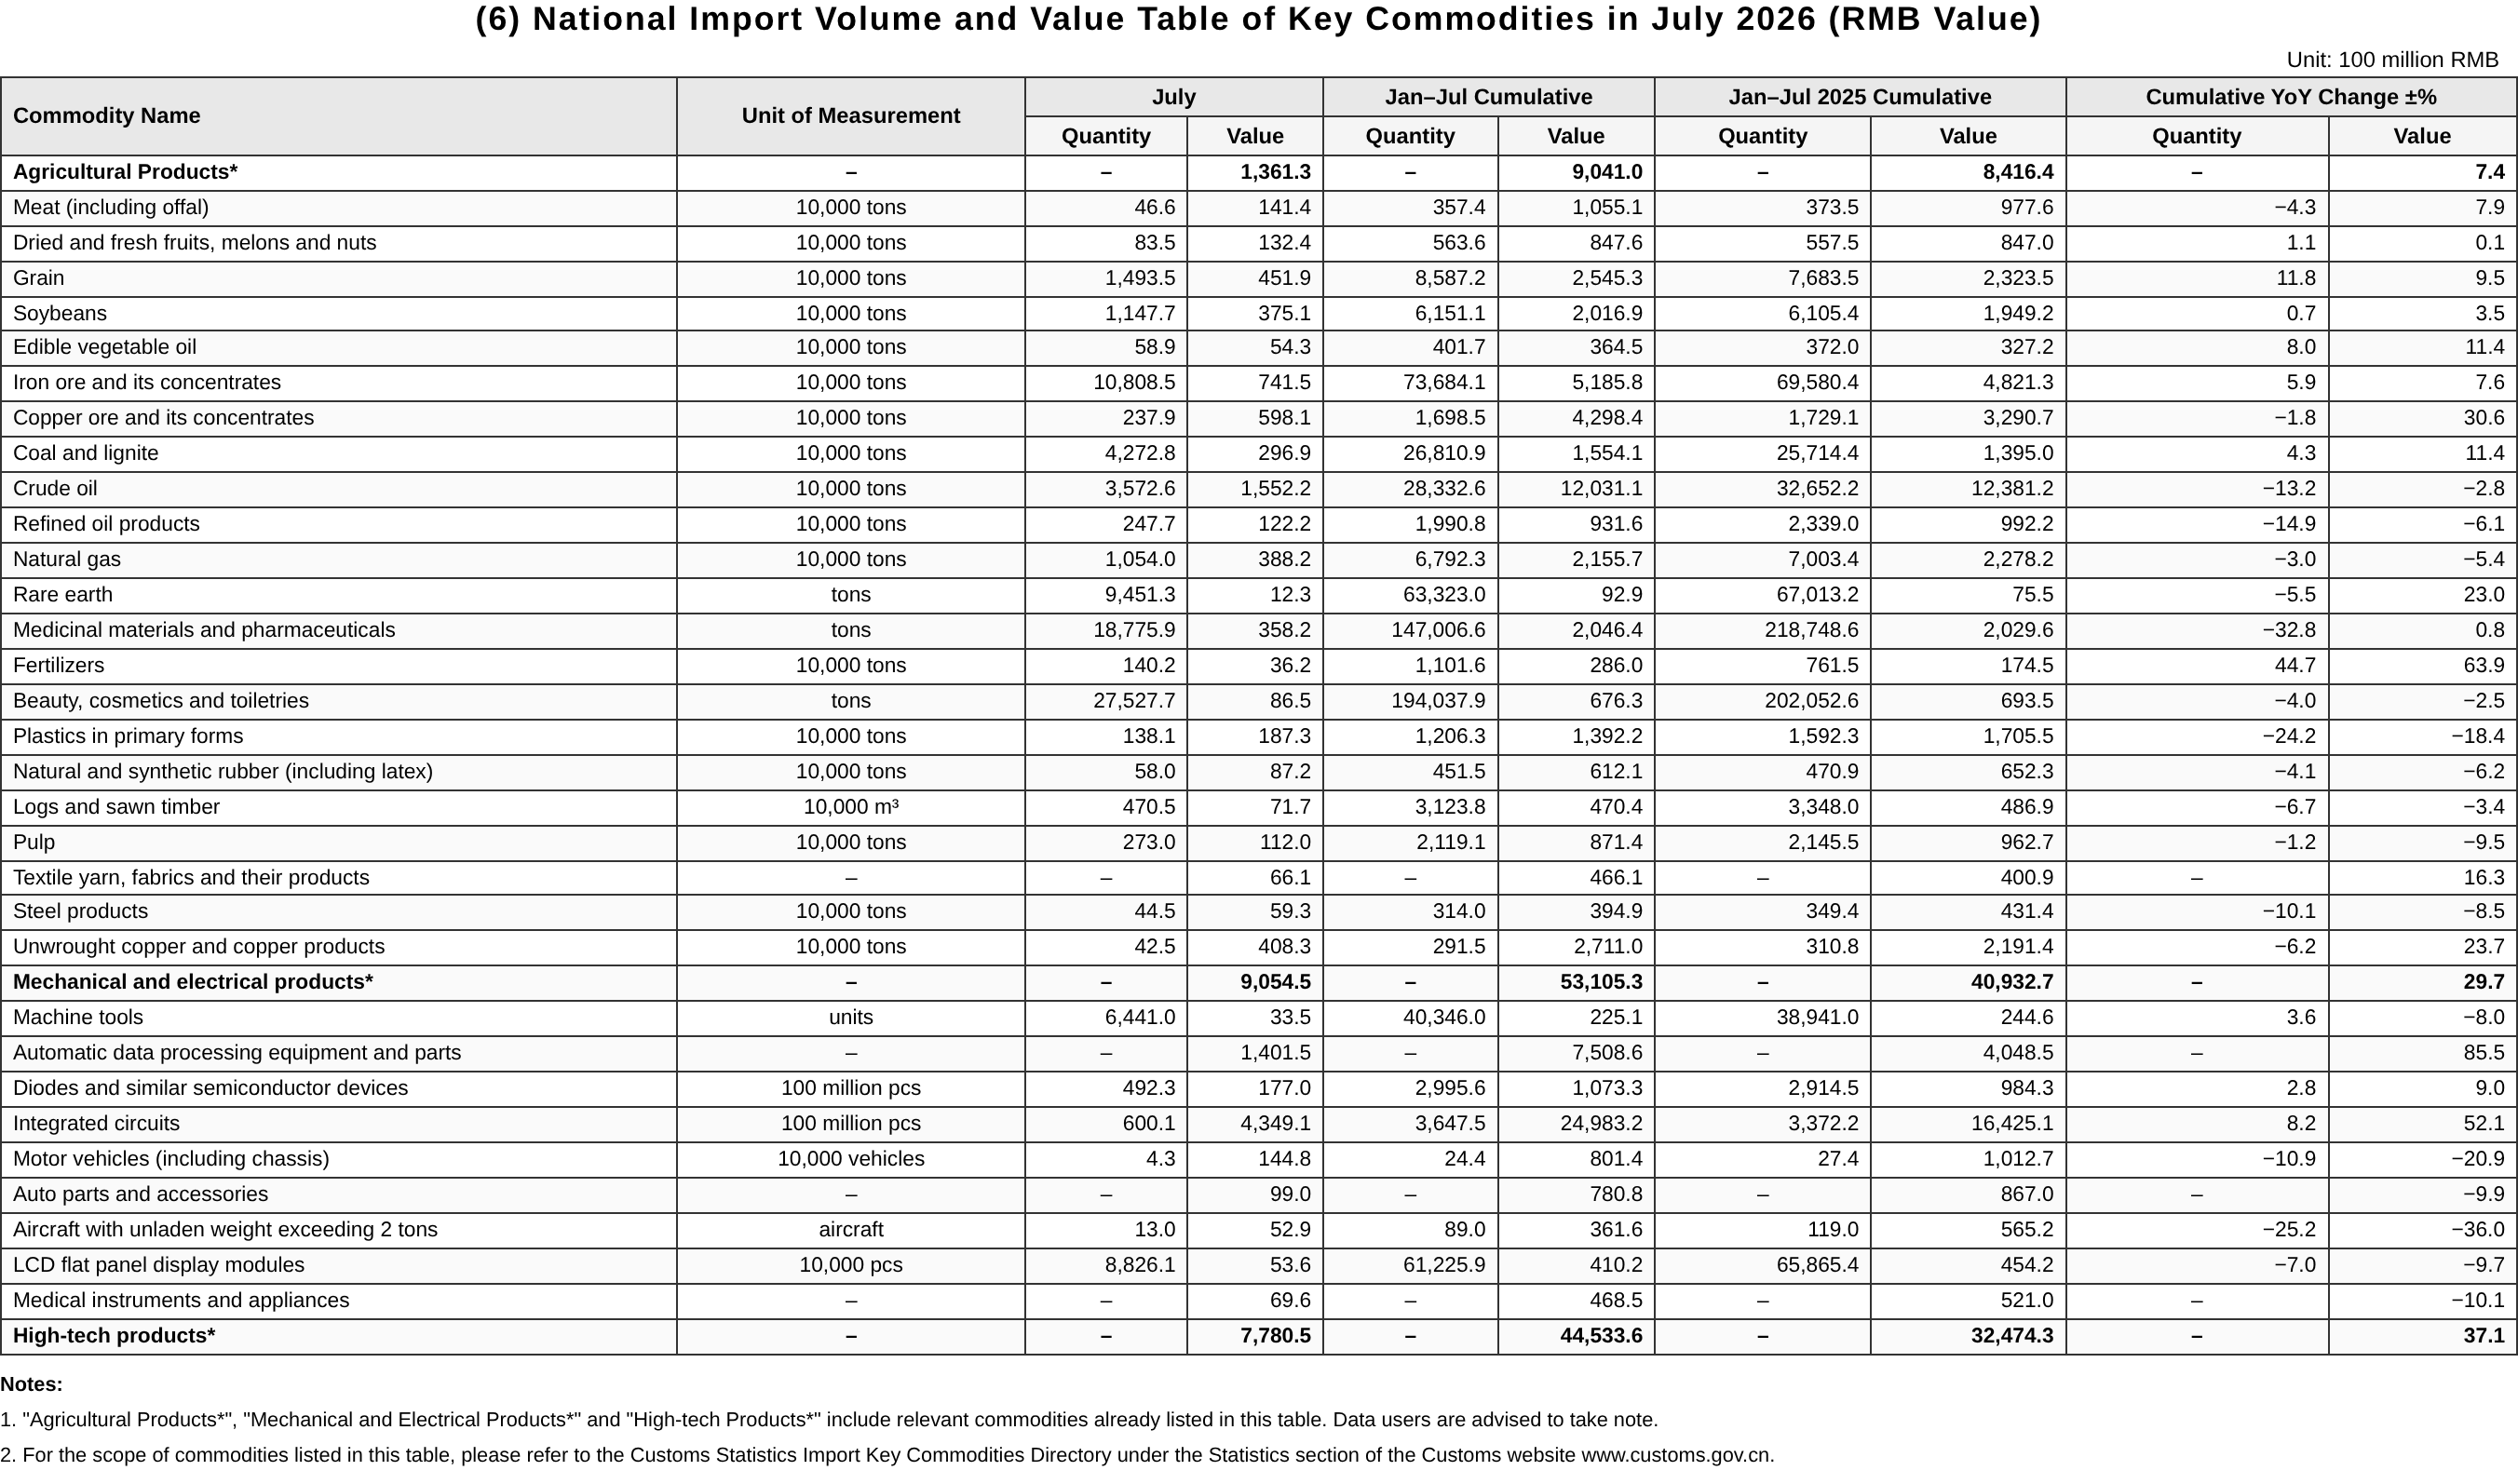
By key commodities,On the export side, in the first seven months, China exported 11.12 trillion yuan of mechanical and electrical products, up 21.2%;labor-intensive products 2.37 trillion yuan, down 1.4%; agricultural products 429.69 billion yuan, up 3.7%.On the import side, in the first seven months, China imported 5.31 trillion yuan of mechanical and electrical products, up 29.7%;283 million mt of crude oil, down 13.2%; and 904.1 billion yuan of agricultural products, up 7.4%.
Based on data released by the General Administration of Customs, SMM has compiled the import and export situation of some metal industry products as follows:
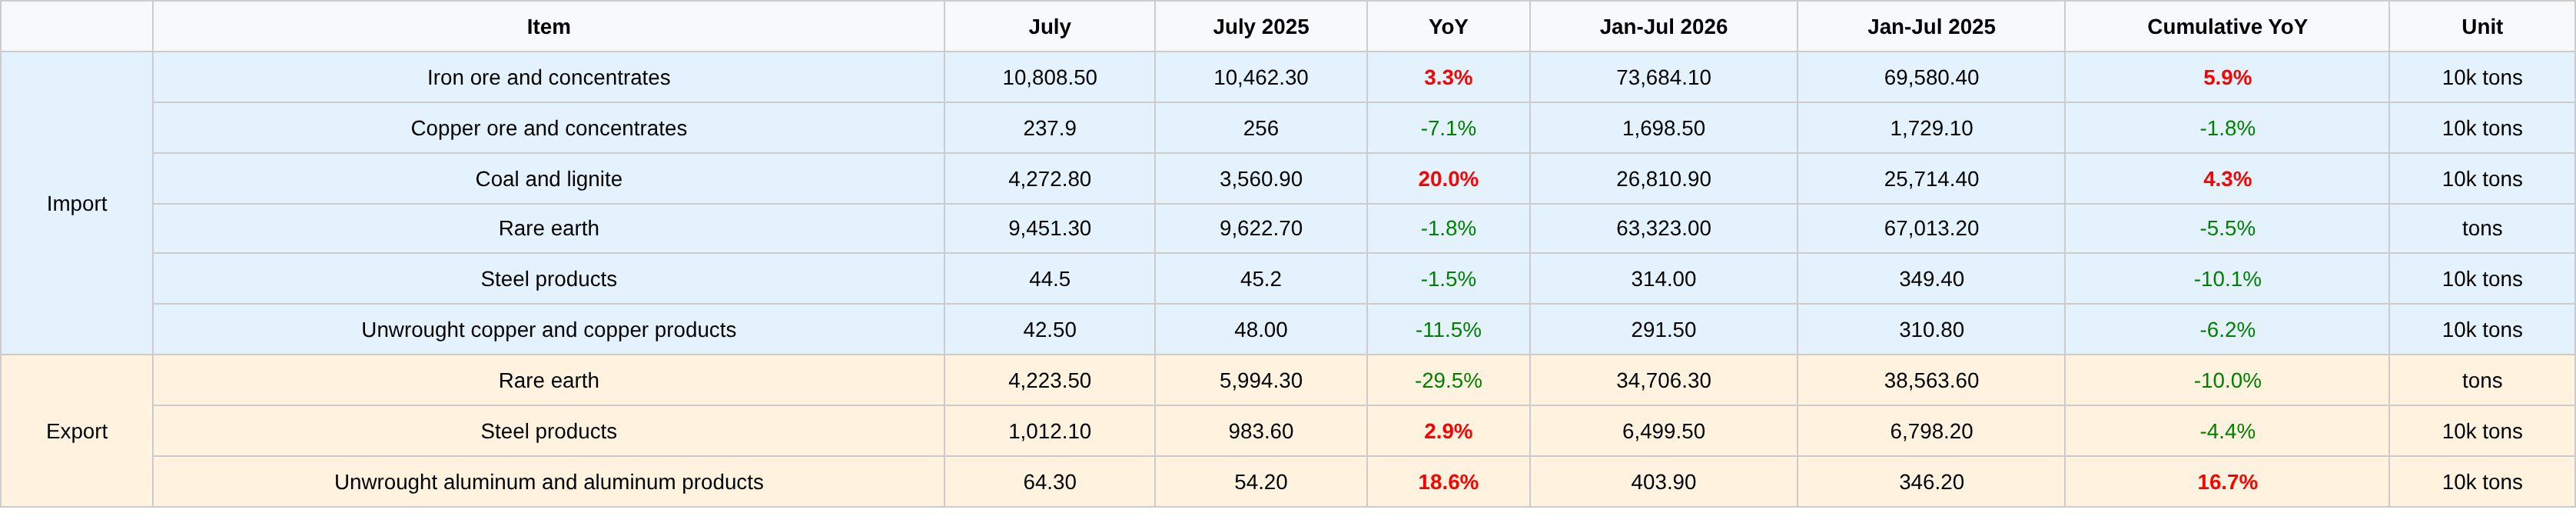
Exports:
In July 2026, rare earth exports were 4,223.5 mt, a YoY decrease of 29.5% from July 2025. Cumulative exports for January-July 2026 were 34,706.3 mt, a YoY decrease of 10% from January-July 2025.
In July 2026, steel exports were 10.121 million mt, a YoY increase of 2.9% from July 2025. Cumulative exports for January-July 2026 were 6,499.5mt, a YoY decrease of 4.4% from January-July 2025.
In July 2026, exports of unwrought aluminum and aluminum semis were 643,000 mt, a YoY increase of 18.6% from July 2025. In January-July 2026, cumulative exports were 4.039 million mt, a YoY increase of 16.7% from January-July 2025.
Imports:
In July 2026, iron ore and concentrates imports were 108.085 million mt, a YoY increase of 3.3% from July 2025. In January-July 2026, cumulative imports were 736.841 million mt, a YoY increase of 5.9% from January-July 2025
. In July 2026, copper ore and concentrates imports were 2.379 million mt, a YoY decrease of 7.1% from July 2025. In January-July 2026, cumulative imports were 16.985 million mt, a YoY decrease of 1.8% from January-July 2025.
In July 2026, coal and lignite imports were 42.728 million mt, a YoY increase of 20% from July 2025. In January-July 2026, cumulative imports were 268.109 million mt, a YoY increase of 4.3% from January-July 2025.
In July 2026, rare earth imports reached 9,451.3 mt, a YoY decrease of 1.8% from July 2025. In January-July 2026, cumulative imports reached 63,323.0 mt, a YoY decrease of 65.5% from January-July 2025
. In July 2026, steel imports reached 445,000 mt, a YoY decrease of 1.5% from July 2025. In January-July 2026, cumulative imports reached 3.14 million mt, a YoY decrease of 10.1% from January-July 2025
. In July 2026, imports of unwrought copper and copper semis were 425,000 mt, a YoY decrease of 11.5% from July 2025. In January-July 2026, cumulative imports were 2.915 million mt, a YoY decrease of 6.2%.
![Nonfarm payrolls surge boosts rate hike expectations; metals show mixed performance, LME zinc rises over 1%, crude oil posts weekly gain of over 8% [Overnight Market]](https://imgqn.smm.cn/usercenter/BVoXk20251217171736.jpg)

![Arbitrage flows between Shanghai and Guangdong continue, lifting SHFE aluminum premiums [SMM Spot Aluminum Midday Review]](https://imgqn.smm.cn/usercenter/gdRUL20251217171651.jpg)