
European stainless scrap prices have fallen noticeably in recent weeks, though they remain above year-earlier levels. The trade press offers a tidy explanation: summer shutdowns at several stainless producers slowed buying, and scrap softened accordingly.
That explanation holds. It is also incomplete. Over the same window, Asian scrap moved the other way.
I. The divergence rules out the usual suspects
SMM data shows Malaysian 304 stainless scrap recovering from a mid-July low of USD1,280/mt to USD1,335/mt on 3rd August, a gain of USD55/mt (4.3%). China Mainland 304 scrap trim rose over the same period from RMB10,150/mt (about USD1,504/mt) to RMB10,450/mt (about USD1,548/mt), an increse of RMB300/mt.
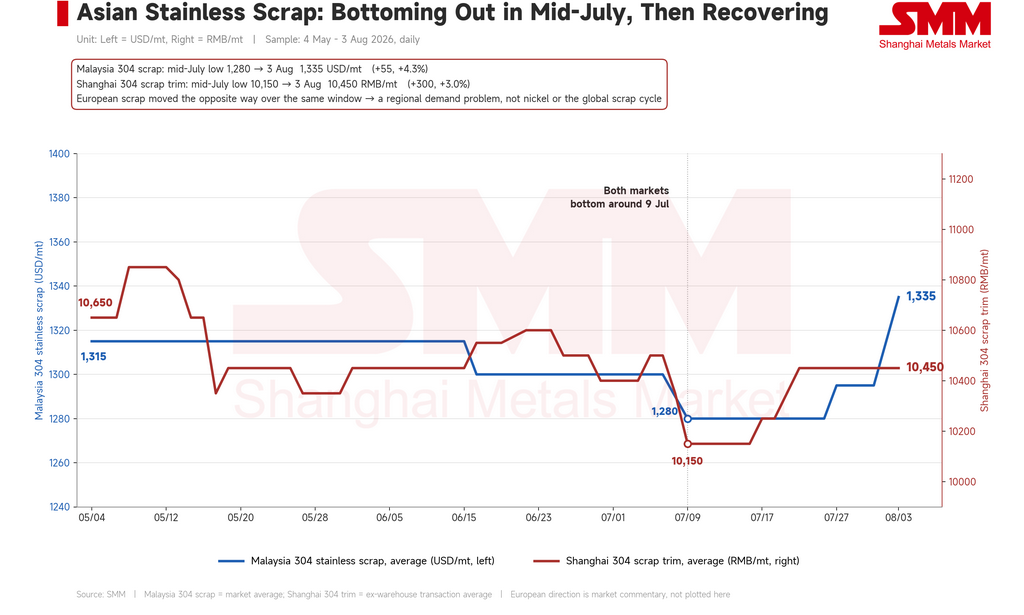
If Europe's decline were driven by nickel, by the global stainless scrap cycle, or by broad macro demand, Asia should not be moving in the opposite direction.
A divergence with that shape points to something local, demand-side and structural. And in Europe, only one input can displace stainless scrap at scale: imported stainless steel slab.
II. Stainless Steel Slab travels through a gap the trade measures never closed
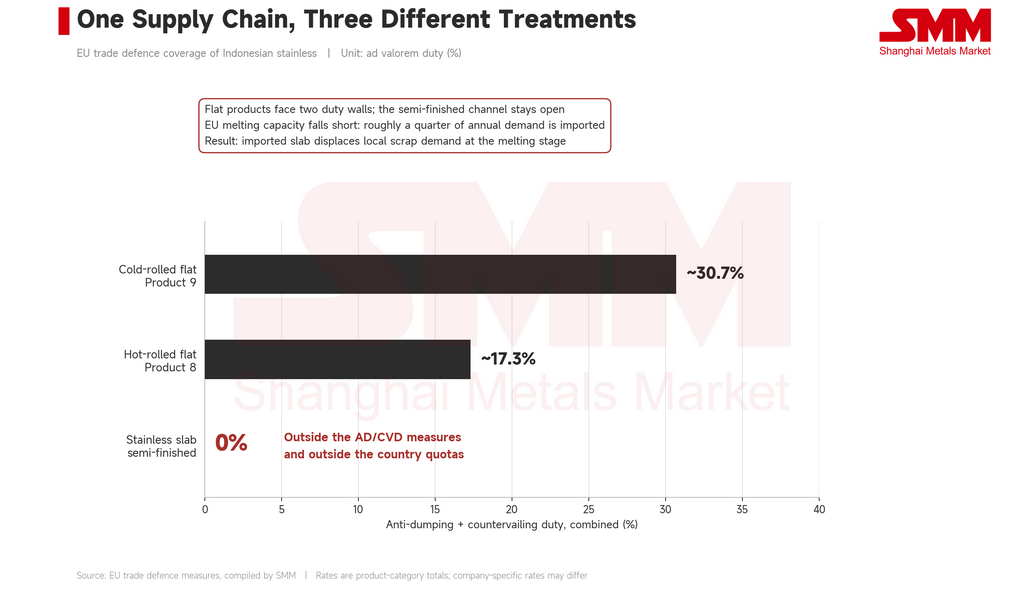
The EU's trade defence architecture against Indonesian stainless is already dense. Anti-dumping and countervailing duties on cold-rolled product total roughly 30.7%; hot-rolled carries about 17.3%. Those measures have clearly curbed direct Indonesian flat-product access to the bloc.
Stainless slab, however, is a semi-finished product, and it sits outside the scope of the flat-product measures. The channel was left open.
In 2025, Indonesia shipped roughly 330,000 tonnes of stainless slab to Italy alone. October 2025 saw 124,000 tonnes move to the EU in a single month, largely stockpiling ahead of CBAM entering its paid phase in January 2026. Once that inventory was in place, Indonesian shipments to the EU ran close to zero for the first three months of 2026, before restarting in April with about 30,000 tonnes routed through Belgium.
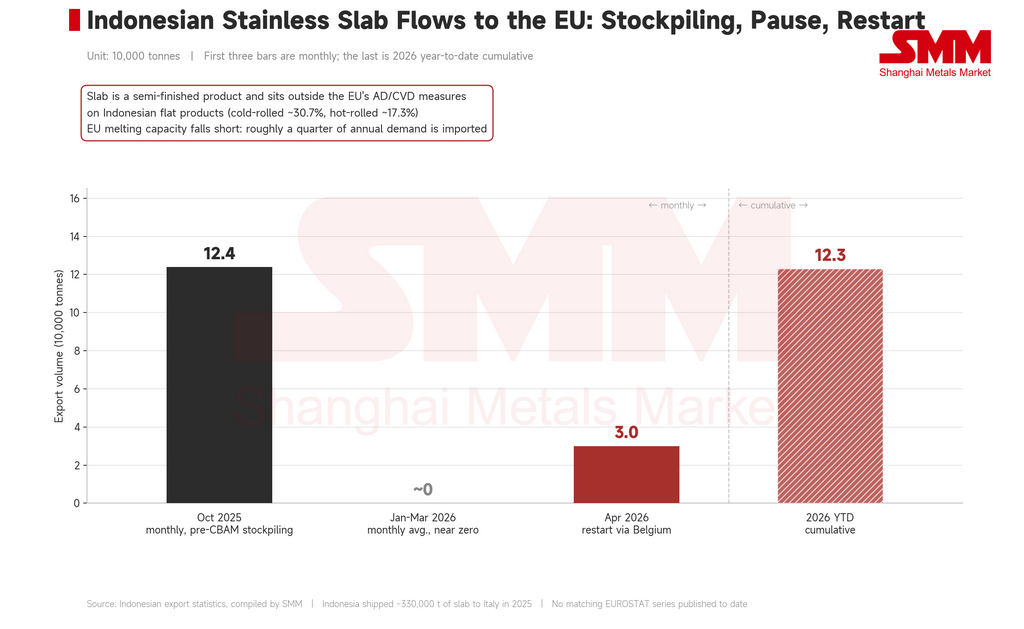
The channel has since reopened at volume. Indonesian export statistics show more than 123,000 tonnes of stainless slab leaving for Europe so far this year. EU government has published no matching series, but Jakarta booked the tonnes some time ago.
III. The buyers and the petitioners are largely the same companies
This produces an awkward alignment. The mills pressing Brussels for quotas, for melt-and-pour origin rules and for the 50% out-of-quota tariff are, to a substantial degree, the same mills buying this slab.
The reason is not complicated. On the European Commission's Joint Research Centre estimates, European melting capacity cannot cover European demand; roughly a quarter of annual stainless requirements must be imported. The capacity gap is real.
What European producers want, then, is not fewer imports. It is cheaper imports, available to the right companies.
IV. Why the distinction matters to scrap traders
Stainless Slab and scrap compete directly at the melting stage. The nickel and chromium units in a heat come either from stainless scrap and alloy additions, or from purchased semi-finished material that is simply re-melted and rolled. Every additional tonne of imported stainless slab removes a corresponding call on local scrap.
That is the portion of the decline summer shutdowns cannot account for. A seasonal dip is reversible and happens every year. Substitution by stainless slab is structural, tied directly to a gap in the design of the trade measures, and still expanding in the second half.
For stainless scrap traders the difference is not semantic. A seasonal decline implies prices repair naturally once lines restart in September. Structural substitution implies the purchasing base has been permanently reduced, restart or no restart.
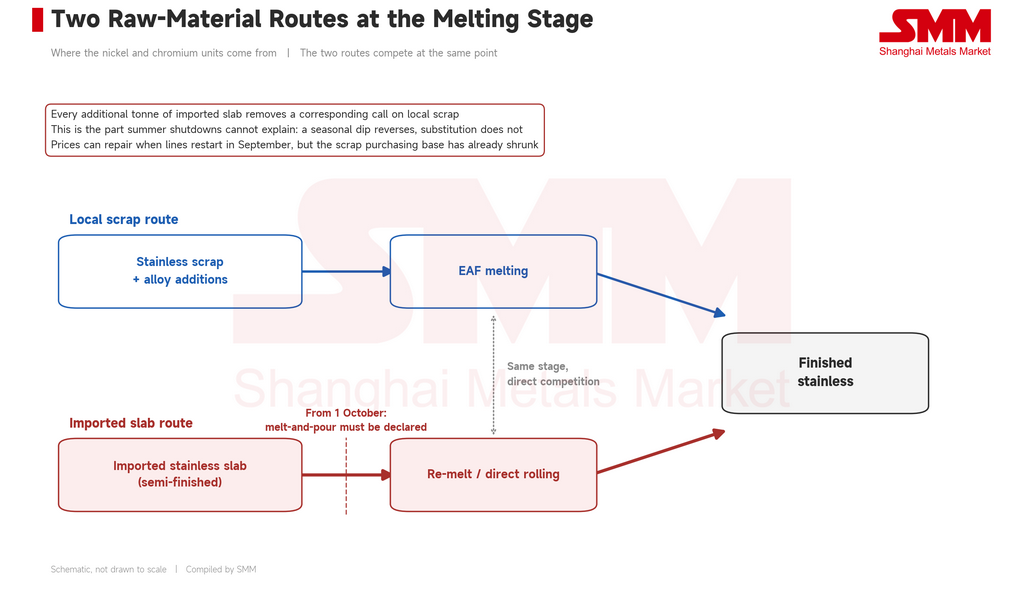
The date to watch is 1st of October. From then, EU importers must declare the country where the steel was first melted and cast, supported by mill test certificates and equivalent documentation. The rule was aimed at third-country processing routes, but it applies with equal force to European mills importing slab directly. Where it finally lands will determine whether this channel is narrowed or formally accepted.
V. When "overcapacity" has no definition
The stainless slab question is uncomfortable because it drags a much larger argument back down to specific tonnages.
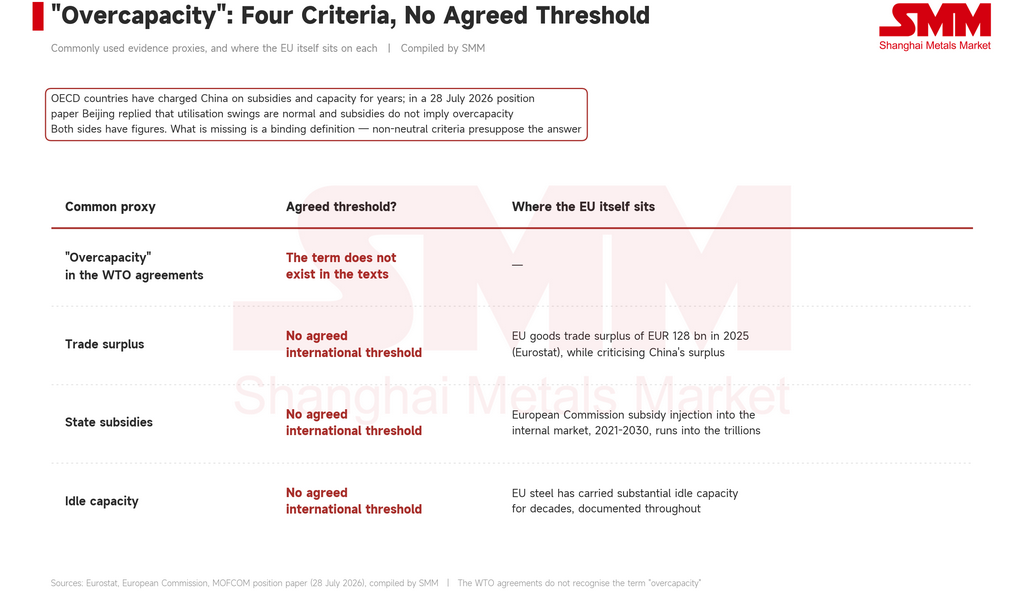
For years, OECD countries have accused China Mainland of building capacity on subsidies and flooding global markets — first in steel, now in batteries, solar and electric vehicles. In a position paper released on 28 July 2026, China's Ministry of Commerce responded that capacity-utilisation swings are normal in a market economy, that no necessary link runs from industrial subsidies to excess capacity, and that export volumes and trade surpluses are not themselves evidence of overcapacity.
Both sides have figures. Both select the ones that suit them.
What appears in none of the papers is a binding definition. The WTO agreements do not recognise the term, and no internationally agreed threshold exists at which capacity becomes overcapacity. The same point applies to the EU's own steel sector, which has carried substantial idle capacity for decades — a fact well documented throughout.
If the criteria are not neutral, the conclusion is set in advance. Trade surpluses are one commonly used proxy: on EU government figures, the EU itself recorded a goods trade surplus of €128 billion in 2025, in a year when it was criticising China's surplus. State support is another: the European Commission's planned subsidy injection into the internal market between 2021 and 2030 runs into the trillions of euros. On the same evidentiary logic, Brussels would need to explain itself first.
Outlook
Summer shutdowns are a genuine part of why European stainless scrap has fallen. They cannot explain why Asia moved the other way over the same weeks, and they cannot explain a stainless slab channel running at volume through a gap in the trade measures.
Protected companies buying those stainless scrap that are protected, which was built against is not a contradiction. Given the capacity gap, it is the rational choice.
It simply means that when the invoices are counted, nobody will admit to having ordered the slab — even though the discharge ports leave little doubt about who bought it.
![[SMM Nickel Morning Meeting Summary] US Stocks Rebound, Macro Pressure Eases, the Most-Traded SHFE Nickel Contract Edges Up in Early Trading](https://imgqn.smm.cn/usercenter/CWsEw20251217171732.jpeg)
![[SMM Analysis] Detailed Data on China's Sulphuric Acid Production in August](https://imgqn.smm.cn/usercenter/Fxolk20251217171712.jpg)
![[SMM Analysis] China Sulphur and Sulphuric Acid Import and Export Data for August](https://imgqn.smm.cn/usercenter/XBbTq20251217171709.jpg)