– Based on Data from the National Bureau of Statistics and China Customs
In H1 2026, China’s sulphur imports shrank sharply under the impact of geopolitical conflicts, export bans, and logistics disruptions, while domestic sulphuric acid production came under pressure and sulphuric acid exports practically halted in June due to policy measures. The following analysis covers four dimensions: prices, production, sulphur trade, and sulphuric acid trade.
1. Prices: Sulphur surged then retreated, sulphuric acid followed with a lag
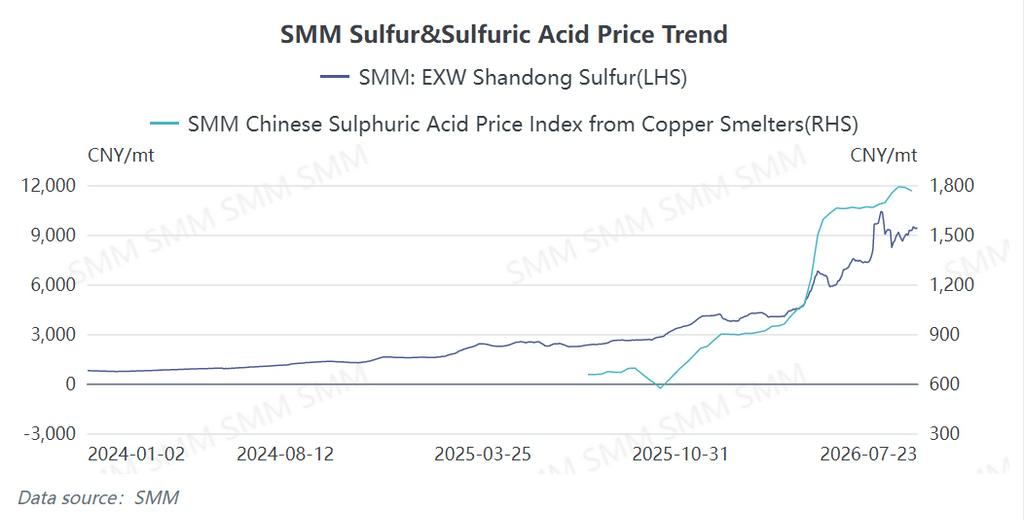
In H1 2026, the SMM sulphur (EXW Shandong) price started the year at RMB 4,180/t and went through five phases: a mild start, a turning point in March, acceleration in April–May, a peak in June, and a pullback in July. In January–February, prices moved narrowly in the RMB 4,000–4,200/t range. In March, as geopolitical tensions fully erupted, prices jumped rapidly from RMB 4,150/t to RMB 6,090/t, a monthly gain of nearly RMB 2,000/t. The uptrend continued in April–May, with the price centre shifting up to RMB 6,500–7,800/t. June saw extreme conditions, with prices hitting an all-time high of RMB 10,353.5/t on 16 June, a 148% increase from the start of the year. Prices eased somewhat in July, closing at RMB 9,428.5/t on 23 July, roughly RMB 1,000/t below the peak.
The SMM copper smelting acid index trended up from RMB 919.5/t at the start of the year. In January–February, it moved narrowly in the RMB 900–960/t range. In March, it climbed quickly to RMB 1,235.5/t following sulphur’s surge, then rose further to RMB 1,657/t in April. In May–June, it remained in a high range of RMB 1,650–1,750/t, briefly touched RMB 1,789/t in early July, then edged lower to RMB 1,763/t as of 17 July. Sulphuric acid rose by about 92%, less than half of sulphur’s gain, reflecting the cost advantage of smelter acid over sulphur‑burning acid – the sharp sulphur price volatility did not transmit equally to the acid side.
2. Production: National output down 1.6% y‑o‑y, with widening regional divergence
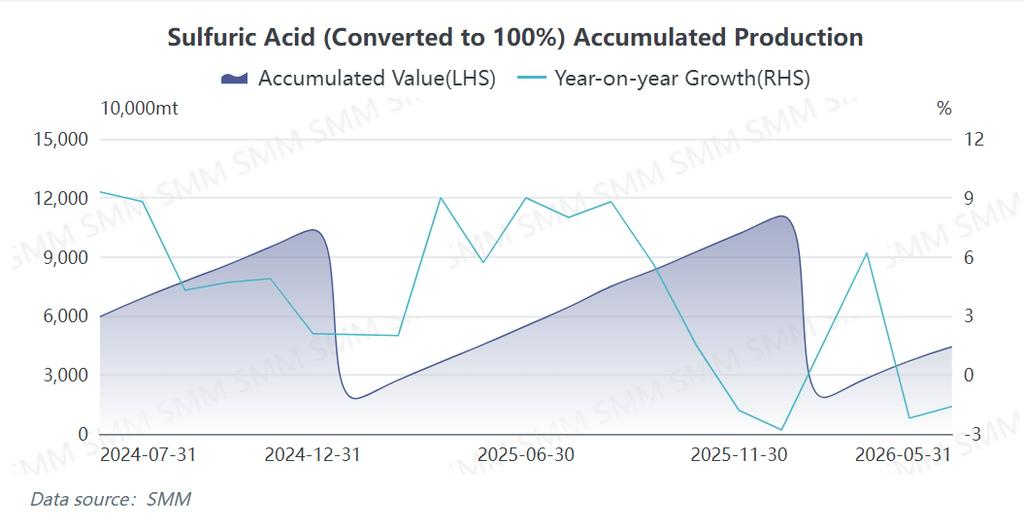
According to the National Bureau of Statistics, China’s cumulative sulphuric acid production (100% H₂SO₄ basis) in January–May 2026 stood at 44.293 million tonnes, down 1.6% y‑o‑y. The cumulative growth rate fell from 6.2% in March to -2.2% in April and -1.6% in May, indicating clear weakening on the margin. Based on monthly figures, May output was approximately 7.216 million tonnes, down about 19.4% from the same month last year, reflecting the persistent drag of high upstream costs on acid production.
By region, the top five provinces were Yunnan (6.6809 mt), Shandong (3.665 mt), Anhui (3.5935 mt), Guizhou (2.9048 mt), and Hubei (2.7395 mt). Anhui benefited from new smelter acid capacity, posting a 20% y‑o‑y gain – the largest increase among provinces. Hubei plunged 53% y‑o‑y, nearly halving its output, mainly due to persistently low phosphate fertiliser operating rates and maintenance shutdowns. Yunnan edged down 0.7%, while Guizhou fell 6.8%, reflecting the pass‑through of weak phosphate fertiliser demand to upstream acid production. Inner Mongolia, Sichuan, and Jiangxi showed relatively small changes.
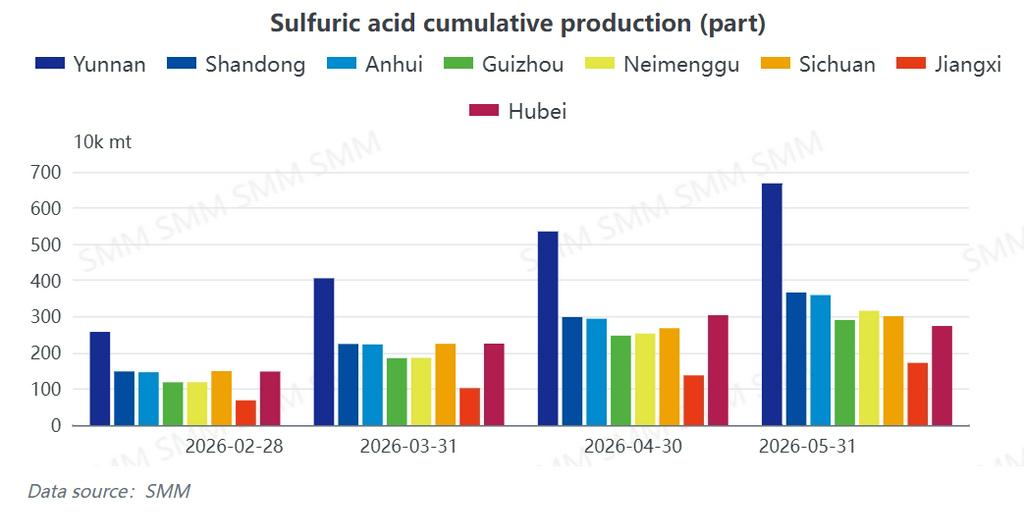
The regional divergence reflects cost competitiveness differences between production routes. With sulphur prices at historically high levels, smelter acid (co‑produced from copper and zinc smelting) enjoys a clear cost advantage over sulphur‑burning acid. Provinces with large copper smelting bases, such as Anhui, saw output growth, while regions with a high share of sulphur‑burning acid capacity – especially those linked to phosphate fertiliser production (Hubei, Guizhou, Yunnan) – suffered output cuts under cost pressure.
3. Sulphur trade: Total imports halved, supply sources reshaped
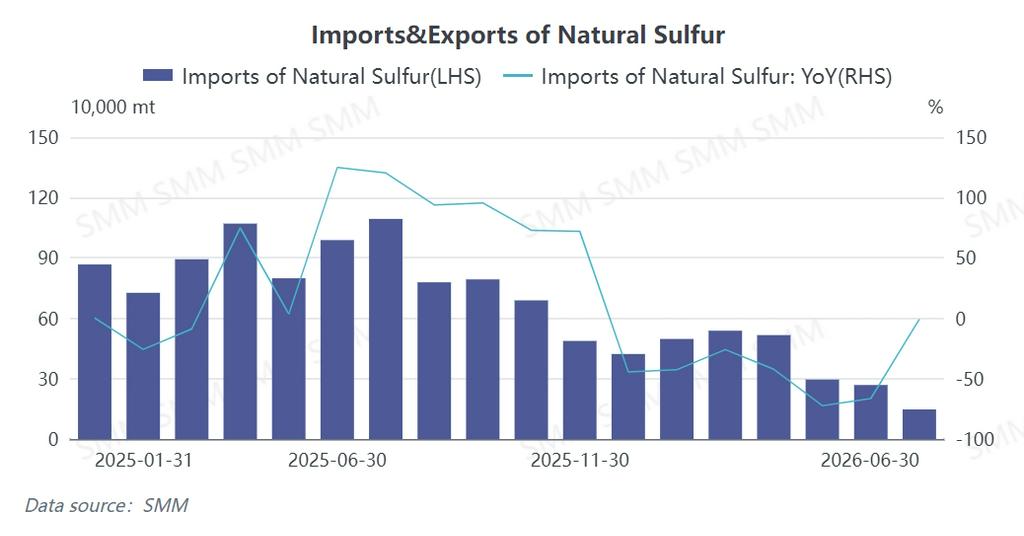
Customs data show that China’s natural sulphur imports in January–June 2026 were 497,200 t, 538,100 t, 516,300 t, 295,500 t, 268,300 t, and 147,000 t respectively, totalling about 2.262 mt in H1. On a combined basis including refined sulphur, the comparable 2025 H1 figure was about 5.345 mt, implying a y‑o‑y drop of approximately 57.7% in 2026. The contraction accelerated month by month: the average monthly import in January–March was about 517,000 t, but April saw a 43% month‑on‑month plunge, and May–June further fell to around 200,000 t. The June figure of 147,000 t was among the lowest single‑month totals in recent years.
The import source pattern changed fundamentally. Comparing January and June: combined imports from the five Middle Eastern countries (UAE, Saudi Arabia, Kuwait, Qatar, Oman) fell from 202,500 t to 7,700 t, and their share dropped from 40.7% to 5.2%, leaving Middle Eastern supply virtually at zero. Canada increased its share from 97,300 t in January to 57,600 t in June, accounting for 39.2% of that month’s total, making it the largest supplier in June. In H1, Canada exported about 341,200 t to China, representing 15% of total imports. South Korea’s exports to China decreased gradually from 118,500 t in January to 43,300 t in June but maintained a stable presence. Kazakhstan had no exports in January–May and shipped only 3,100 t in June.
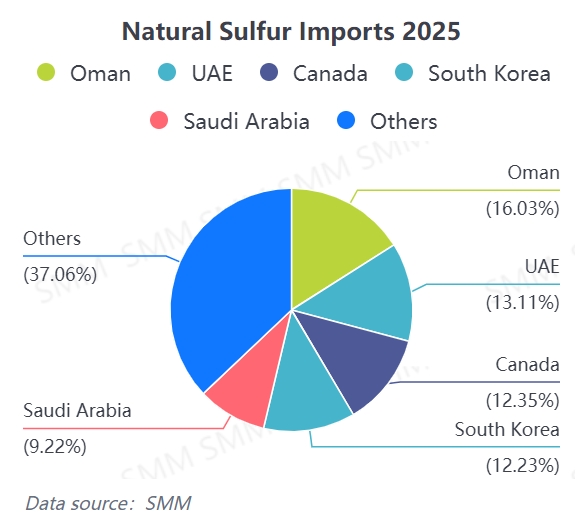
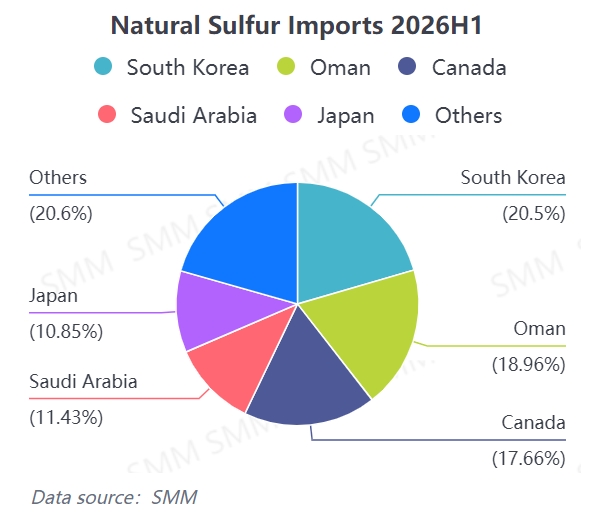
For refined sulphur (purity ≥99.95%), H1 imports totalled about 363.9 t, of which Canada accounted for about 77%. Refined sulphur exports surged in May–June (160 t and 121.2 t respectively), suggesting that some refined material was diverted to overseas markets for higher margins amid tight natural sulphur supply and high domestic prices.
The monthly decline in natural sulphur imports mirrored the gradual rise in domestic sulphur prices: when imports remained above 500,000 t per month in January–March, domestic prices moved in the RMB 4,000–6,000/t range; when imports dropped to 295,500 t in April, prices broke above RMB 6,500/t; as imports fell to around 200,000 t in May–June, prices surged to RMB 7,500–7,800/t and then broke through the RMB 10,000/t threshold. The tightening import supply was the key fundamental driver behind the domestic price spike.
4. Sulphuric acid trade: Imports negligible, exports dropped to zero in June
China’s sulphuric acid imports remained extremely low in H1 2026: 17,200 t, 9,400 t, 900 t, 17,100 t, 900 t, and 17,900 t respectively, averaging less than 12,000 t per month – almost negligible compared to the domestic monthly output of roughly 7 million t, and thus having no impact on domestic supply/demand or prices.
On the export side, the pattern was “high then crash”. Exports peaked at 242,500 t in January, then held in the 116,000–143,000 t range in February–May (average ~135,000 t/month), before plunging to 980.12 t in June – a month‑on‑month drop of over 99%, practically a halt. The sharp decline directly resulted from the formal suspension of ordinary sulphuric acid exports effective 1 May, with its full effect evident in June.
In terms of destinations, in January–May the main recipients were Chile (total 295,300 t, 37.7% of the period’s total), Indonesia (~219,300 t), India (~99,600 t in Q1), and Saudi Arabia (~101,500 t in February–April). All major destinations saw zero exports in June.
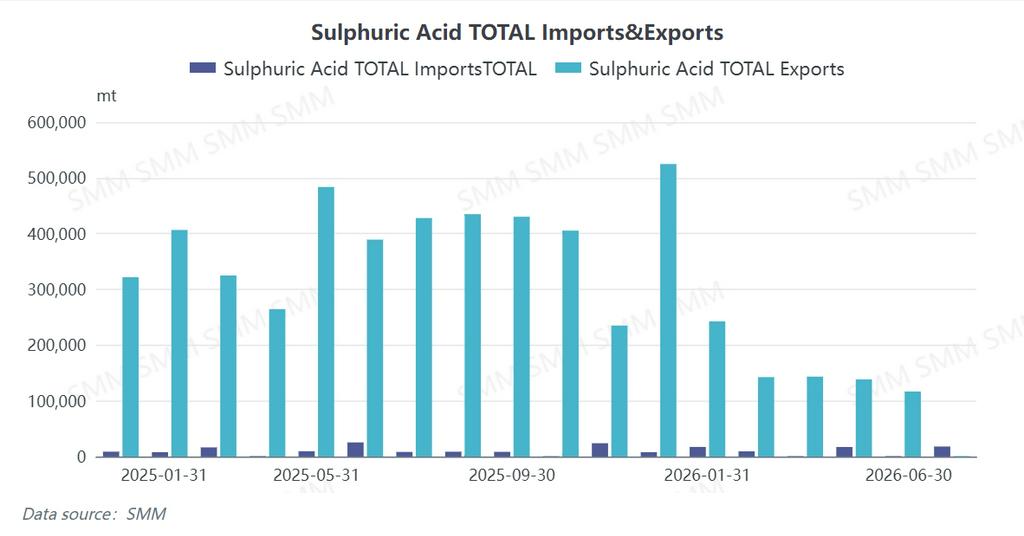
In H1, China’s sulphuric acid trade profile was “negligible imports plus exports that stopped after a strong start”. Cumulative exports in January–May were about 784,000 t, averaging 157,000 t/month, making China a net exporter. The June halt meant that approximately 100,000–150,000 t per month of acid that would have gone to overseas markets were forced back to the domestic market, putting some pressure on coastal regional markets; however, relative to the country’s monthly production of about 7 million t, the impact on the overall supply‑demand balance is manageable.
5. Summary
In H1 2026, China’s sulphur market experienced a full transmission chain of “import collapse – output pressure – export stagnation”. Key figures:
- Imports: Natural sulphur imports fell from 497,200 t in January to 147,000 t in June. On a combined natural and refined sulphur basis, imports dropped by about 57.7% y‑o‑y, and the Middle Eastern share declined from nearly 40% to 5%.
- Production: National sulphuric acid output in January–May fell 1.6% y‑o‑y, with significant declines in traditional phosphate fertiliser producing provinces like Hubei, Guizhou, and Yunnan, while Anhui and other smelter‑acid‑concentrated regions saw growth.
- Exports: Sulphuric acid exports practically halted in June, sending about 100,000–150,000 t/month back to the domestic market.
- Prices: Sulphur surged from RMB 4,180/t at the start of the year to a peak of RMB 10,353.5/t in June, while the copper smelting acid index rose by about 92%.
Looking ahead to H2, developments in the Strait of Hormuz shipping and the pace of sulphur capacity expansion remain core variables determining sulphur supply and price direction. If supply‑side pressures persist, the tight domestic sulphur market is unlikely to reverse in the short term, and the sulphuric acid sector will continue to face a “cost‑push, demand‑weak‑acceptance” high‑range fluctuation pattern. Regional divergence will persist – smelter‑acid‑concentrated regions are likely to maintain a relative advantage, while regions relying on purchased sulphur‑burning acid will continue to face significant cost pressure.
![[SMM Flash] SADC Urged to Shift from Raw Mineral Exports to Processing, Zimbabwe's Lithium Ban Cited as Model](https://imgqn.smm.cn/usercenter/mpqgn20251217171727.jpg)

![[SMM Flash ] Savannah Resources Secures Land Access Agreements for Barroso Lithium Project in Portugal](https://imgqn.smm.cn/usercenter/BmqWy20251217171726.jpg)