Materias primas aguas arriba: Las importaciones de bauxita aumentan interanualmente, las de alúmina se disparan, las de aluminio primario se debilitan y las importaciones totales de chatarra de aluminio descienden interanualmente
1. Bauxita (código HS 26060000): Predominio del suministro guineano; las importaciones del primer semestre aumentan un 17,1 % interanual, las de junio bajan un 11,8 % intermensual
De enero a junio, las importaciones acumuladas de bauxita de China alcanzaron 121,08 millones de tm, un 17,1 % más interanual. De ellas, las importaciones procedentes de Guinea sumaron 98,41 millones de tm, lo que representa el 81,28 % del total y constituye la fuente de materia prima más importante para las refinerías nacionales de alúmina. Las importaciones de bauxita guineana aumentaron un 23,5 % interanual en el primer semestre.
En términos mensuales, las importaciones de bauxita de junio fueron de 20,32 millones de tm, retrocediendo un 11,8 % intermensual pero aún un 12,2 % superiores interanualmente. Las importaciones procedentes de Guinea en ese mes se situaron en 15,84 millones de tm, un 19,2 % menos intermensual, principalmente porque el alza de los precios internacionales del petróleo elevó los fletes marítimos y los costes de extracción, lo que llevó a las minas guineanas a controlar los envíos. Las importaciones de Australia en el mismo mes totalizaron 3,67 millones de tm, un 21,2 % más intermensual.
En general, si bien las importaciones de bauxita aumentaron interanualmente, siguen dependiendo en gran medida de la estabilidad de los envíos desde Guinea. Por lo tanto, es necesario seguir monitoreando las noticias sobre la política de cuotas de bauxita de Guinea y las tendencias de los precios del petróleo.
2. Alúmina: Las importaciones se disparan un 343,47 % interanual, las exportaciones se mantienen altas, las importaciones netas acumuladas del primer semestre totalizan 668.000 tm
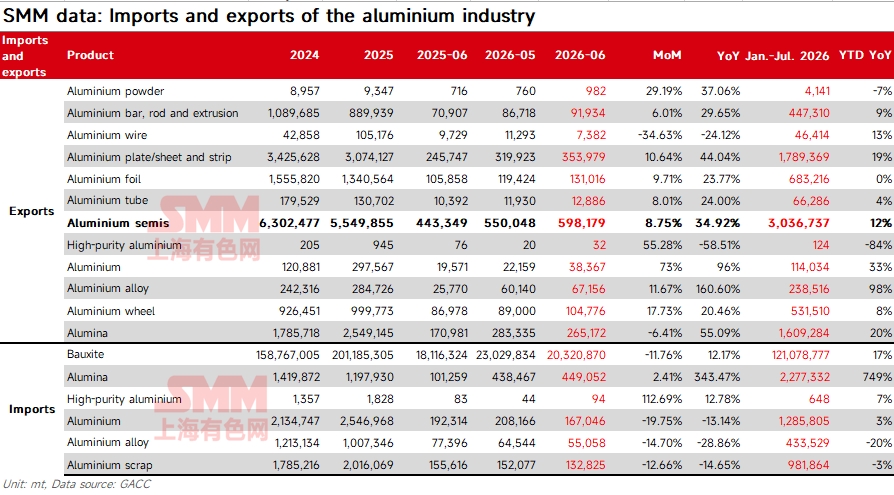
En junio de 2026, China importó 449.050 tm de alúmina, un 2,41 % más intermensual y un 343,47 % más interanual. Las importaciones acumuladas de enero a junio alcanzaron 2,28 millones de tm. En cuanto a las exportaciones, los envíos de junio fueron de 265.170 tm, con un leve descenso del 6,41 % intermensual y un aumento del 55,09 % interanual. Las exportaciones acumuladas del primer semestre llegaron a 1,61 millones de tm, lo que arroja importaciones netas acumuladas de 668.000 tm en el período.
La divergencia de los flujos comerciales es clara: las importaciones dependen en gran medida de Australia, cuya alúmina representó el 91,65 % de las importaciones de junio. Los destinos de exportación son principalmente Rusia y Omán, que en conjunto supusieron el 92,03 % de las exportaciones totales de alúmina en junio. Debido a las recientes tensiones en Oriente Medio, el estrecho de Ormuz sufrió interrupciones temporales en el tránsito. Como resultado, parte de la alúmina originalmente programada para Oriente Medio se desvió a puertos chinos, se reenvasó y luego se reexpidió a Oriente Medio. Este ajuste provocó un aumento tanto de las importaciones como de las reexportaciones de alúmina en el mercado chino.
3. Aluminio Primario (HS76011090, 76011010): Las importaciones mensuales se debilitan, las exportaciones crecen y las importaciones netas del primer semestre suben un 0,8 %
En junio, las importaciones chinas de aluminio primario fueron de 167 000 tm, un 19,7 % menos intermensual y un 13,1 % menos interanual. Las exportaciones ascendieron a 38 000 tm, un 73,1 % más intermensual y un salto del 95,4 % interanual, lo que resultó en importaciones netas de 129 000 tm en el mes, inferiores tanto a nivel intermensual como interanual.
En el primer semestre, las importaciones acumuladas de aluminio primario totalizaron 1,286 millones de tm, un 2,9 % más interanual. Las exportaciones acumuladas fueron de 114 000 tm, un 31,8 % más interanual, y las importaciones netas acumuladas alcanzaron 1,172 millones de tm, un leve aumento de apenas el 0,8 % interanual.
En el primer semestre, los contratos de importación a largo plazo y algunos pedidos previamente acordados se ejecutaron con normalidad y, con la llegada de cargamentos en tránsito, las importaciones de aluminio primario se mantuvieron elevadas. Afectadas por el diferencial de precios exteriores, las pérdidas por importación continuaron ampliándose, lo que provocó que algunos cargamentos de aluminio primario importado se redirigieran o reexportaran a países y regiones como Japón, Corea del Sur, Tailandia, India, Europa y EE. UU. 4. Chatarra de Aluminio: Las importaciones del primer semestre caen interanualmente, con orígenes concentrados en Europa y EE. UU.
De enero a junio de 2026, las importaciones acumuladas de chatarra de aluminio de China alcanzaron 982 000 tm, un retroceso notable desde los 1,012 millones de tm del mismo período de 2025. Unas políticas de recogida y exportación de chatarra más estrictas en el extranjero, sumadas a los precios más altos del aluminio en el LME, elevaron los precios exteriores de la chatarra y redujeron la oferta de materias primas recicladas de alta calidad y bajo costo.
Por país de origen, Tailandia, el Reino Unido y Japón fueron los tres principales proveedores, representando el 20,2 %, 13,2 % y 10,2 % de las importaciones del primer semestre, respectivamente. Las importaciones mensuales bajo los tres regímenes comerciales —comercio ordinario, comercio de procesamiento con materiales importados y comercio de procesamiento con materiales suministrados— fluctuaron significativamente. Los aranceles a la exportación de chatarra en el extranjero y los controles relacionados con la protección ambiental continuaron presionando el suministro de chatarra de aluminio en China.
Productos Procesados de la Cadena Intermedia y Final: Las exportaciones se disparan en todas las categorías, con múltiples rubros alcanzando récords mensuales de exportación
1. Aleación de Aluminio sin Forjar (HS76012000): Junio pasa a exportaciones netas; las exportaciones se disparan un 160,6 % interanual hasta un nuevo récord
En junio, las importaciones de aleación de aluminio sin forjar fueron de 55.100 toneladas, un 28,9 % interanual y un 14,7 % mensual menos; las exportaciones fueron de 67.200 toneladas, con un aumento interanual del 160,6 % y un 11,7 % mensual más, estableciendo un máximo mensual histórico. Ese mes, la balanza comercial pasó de importaciones netas a exportaciones netas. En enero–junio de 2026, las importaciones acumuladas alcanzaron 433.500 toneladas, un 20,0 % interanual menos, mientras que las exportaciones acumuladas totalizaron 238.500 toneladas, con un aumento interanual del 98,3 %.
En el primer semestre de 2026, el comercio de aleación de aluminio sin forjar de China mostró una tendencia de contracción de las importaciones y expansión de las exportaciones. Las importaciones estuvieron limitadas por los elevados costes de las materias primas en el extranjero y los márgenes de importación persistentemente negativos, y con los factores geopolíticos empujando al alza los precios de la aleación de aluminio en el exterior, las pérdidas por importación fueron significativas. La ventana de importación no logró abrirse de manera efectiva, limitando la entrada de recursos importados y manteniendo bajos los volúmenes de importación. Las exportaciones, por su parte, se beneficiaron de una oferta ajustada y una demanda creciente fuera de China, junto con un diferencial favorable de precios entre los mercados chino y extranjeros, lo que generó un crecimiento significativo de las exportaciones. Al mismo tiempo, los modos de comercio y la expansión de mercados siguieron mejorando, con un aumento de la participación del comercio ordinario y la diversificación de los destinos de exportación desde los tradicionales Japón y Corea del Sur hacia Norteamérica, el sudeste asiático, el norte de África y otras regiones, lo que realzó aún más la diversificación.
2. Alambre de aluminio (HS76141000, 76149000): las exportaciones de junio se dispararon casi cuatro veces interanual, estableciendo un nuevo máximo mensual histórico
En junio de 2026, las exportaciones totales de alambre de aluminio alcanzaron 112.400 toneladas, un 76,03 % mensual más y un asombroso 379,7 % interanual; las exportaciones acumuladas en enero–junio llegaron a 283.400 toneladas, un salto del 109,76 % interanual. Por subcategoría, las exportaciones de otros alambres trenzados de aluminio no aislados ascendieron a 96.400 toneladas, representando el 85,76 % del total, con un aumento mensual del 91,9 %; las exportaciones de alambre trenzado de aluminio con alma de acero se situaron en 16.000 toneladas, el 14,24 %. La ampliación del diferencial de precios Shanghái-Londres en el primer semestre y el aumento de la demanda en el exterior impulsaron las exportaciones nacionales de alambre trenzado de aluminio a récords mensuales consecutivos; mientras tanto, las revisiones de las redes eléctricas mundiales y el despliegue concentrado de proyectos de transmisión de nuevas energías apuntalaron las exportaciones estables de alambre trenzado de aluminio con alma de acero, respaldadas por la demanda de infraestructura eléctrica en el extranjero.
3. Semielaborados de aluminio (planchas/láminas, flejes y hojas / extrusiones / tubos y conductos / alambre / polvo): las exportaciones totales de junio alcanzaron 605.400 toneladas, un nuevo máximo anual, con múltiples subcategorías fortaleciéndose simultáneamente
Según el desglose aduanero, los productos semielaborados de aluminio abarcan seis grandes subcategorías: placas/chapas y flejes, hoja de aluminio, extrusiones y barras & varillas, tubos & tuberías de aluminio, alambre de aluminio y polvo de aluminio. En junio de 2026, las exportaciones totales de productos semielaborados de aluminio de China alcanzaron 598.200 t, un incremento intermensual del 8,8 % desde 550.000 t, un máximo mensual del año. Exportaciones de junio por subcategoría:
- Las exportaciones de placas/chapas y flejes fueron de 354.000 t, la mayor categoría, con un incremento intermensual del 10,66 % desde 319.900 t;
- Las exportaciones de hoja de aluminio fueron de 131.000 t, un incremento intermensual del 9,72 % desde 119.400 t;
- Las exportaciones de extrusiones y barras & varillas fueron de 91.900 t, un incremento intermensual del 6,00 % desde 86.700 t;
- Las exportaciones de alambre de aluminio fueron de 7.400 t, una caída intermensual del 34,6 % desde 11.300 t;
- Las exportaciones de tubos & tuberías de aluminio fueron de 12.900 t, un incremento intermensual del 8,0 % desde 11.900 t;
- Las exportaciones de polvo de aluminio fueron de 1.000 t, un ligero aumento desde 800 t.
El respaldo de la demanda es evidente: la expansión de las instalaciones fotovoltaicas y de almacenamiento de energía en el exterior impulsó un repunte en las exportaciones de extrusiones para marcos fotovoltaicos; el aligeramiento de los vehículos de nuevas energías (NEV) en Europa y EE. UU. aumentó los pedidos de chapa de aluminio para carrocerías y extrusiones estructurales; la continua construcción de infraestructura y vivienda en el Sudeste Asiático y Oriente Medio siguió absorbiendo extrusiones de aluminio para construcción; y la demanda estable de envases y electrónica dio soporte a las exportaciones de hoja de aluminio. En cuanto a las importaciones, solo se requirieron volúmenes limitados de placas/chapas y flejes de aluminio de alta gama y alta precisión y extrusiones de aleación especial, siendo las importaciones mucho menores que las exportaciones, lo que mantuvo a los productos semielaborados de aluminio en un gran superávit comercial. En cuanto a las tendencias del primer semestre, las exportaciones mensuales de productos semielaborados de aluminio tocaron fondo en febrero y desde entonces han aumentado intermensualmente durante cuatro meses consecutivos, ya que la creciente diferencia de precios entre los mercados chino y extranjero y las capacidades integradas de procesamiento y ventajas de coste de China continuaron atrayendo pedidos de exportación.
4. Llantas y piezas de aleación de aluminio para vehículos automotores: las exportaciones de junio registraron un crecimiento interanual e intermensual, con Norteamérica como principal mercado de exportación
En junio, las exportaciones chinas de llantas y piezas de aleación de aluminio para vehículos automotores totalizaron 104.780 t, un incremento interanual del 20,46 % y un incremento intermensual del 17,73 %. Por país: EE. UU. fue el principal mercado de exportación con 25.900 t, representando el 24,71 %; Japón y México ocuparon el segundo y tercer lugar, y los tres en conjunto representaron más del 50 % del total de las exportaciones. Por provincia: Hebei exportó 36.700 t, una participación del 35,02 %, convirtiéndose en la región productora principal para las exportaciones de llantas; Zhejiang y Jiangsu la siguieron, y las tres provincias contribuyeron con más del 70 % de las exportaciones. La recuperación de la producción y ventas de automóviles y vehículos de nuevas energías en el extranjero ha impulsado de manera constante las exportaciones de piezas de aluminio para automóviles.
Resumen de la lógica central de las importaciones y exportaciones de la cadena de la industria del aluminio en el primer semestre
1. Materias primas aguas arriba: Las restricciones de la oferta dominaron el ritmo de importación.
El ritmo de importación de bauxita dependió del calendario de envíos marítimos de Guinea, lo que provocó fluctuaciones significativas en las llegadas mensuales a puerto; las importaciones y exportaciones de alúmina se dispararon debido al conflicto en Oriente Medio; las importaciones de chatarra de aluminio se contrajeron bruscamente, limitadas por las políticas medioambientales y comerciales en el extranjero; la relación de precios entre los mercados de aluminio primario chino y extranjero se desequilibró. En conjunto, las importaciones de materias primas mostraron un patrón divergente de «crecimiento estable de la bauxita, crecimiento explosivo de la alúmina y tendencias de debilitamiento del aluminio primario y secundario».
2. Productos transformados aguas abajo: La creciente demanda manufacturera en el extranjero impulsó un crecimiento amplio y elevado de las exportaciones.
Las exportaciones de tres productos transformados clave —piezas de automóvil, cables eléctricos y aleación de aluminio colado— se duplicaron con creces en junio en términos interanuales. El ánimo sectorial en los sectores de vehículos de nueva energía (NEV), infraestructuras de redes eléctricas y maquinaria general en el extranjero se mantuvo positivo. Unido a las ventajas de costes de la cadena industrial completa del aluminio en China, los pedidos locales en el extranjero siguieron trasladándose a China, con exportaciones mensuales de múltiples categorías alcanzando máximos históricos, lo que reforzó aún más la competitividad exterior de los productos de aluminio.
3. Transformación de la estructura comercial: La característica de exportación neta de los productos de aluminio siguió reforzándose.
La aleación de aluminio sin forjar pasó de importaciones netas a exportaciones netas en junio, mientras que el alambre de aluminio y las llantas de aluminio para automóviles mantuvieron volúmenes de exportación neta sustanciales a largo plazo. Solo la alúmina y la bauxita siguieron siendo importaciones netas. El patrón de la industria china del aluminio de «depender de las importaciones de materias primas y exportar productos transformados» se afianzó aún más, y el superávit comercial de los productos transformados siguió ampliándose.
Perspectivas de mercado
Bauxita: A corto plazo, se espera que los envíos de bauxita de Guinea se recuperen, y se prevé que las llegadas de bauxita a puerto repunten en términos intermensuales en julio-agosto.
Alúmina: A medida que el conflicto en Oriente Medio sigue intensificándose, es poco probable que las importaciones de alúmina rompan su tendencia de fluctuación en niveles altos.
Aluminio: Afectadas por las grandes pérdidas previas en importaciones y los ciclos de envío, se espera que las importaciones chinas de aluminio primario se mantengan en los niveles actuales a corto plazo. Sin embargo, a medida que la oferta exterior se recupere gradualmente y la relación de precios SHFE/LME se repare, se espera que las importaciones de lingotes de aluminio repunten a más largo plazo.
Chatarra de aluminio: Es probable que persista la caída de las importaciones causada por el diferencial invertido de precios entre los mercados chino y extranjero, y unos controles más estrictos a las exportaciones de chatarra en el extranjero seguirán limitando las importaciones de chatarra de aluminio.
Productos de aluminio: Los cambios en las barreras comerciales y las políticas arancelarias en el extranjero pueden perturbar las exportaciones de productos transformados de aluminio, generando incertidumbre para las importaciones y exportaciones de la cadena industrial.
Aleaciones de aluminio sin forjar: Tras julio, los precios de las aleaciones de aluminio en el extranjero continuaron retrocediendo, reparándose gradualmente el diferencial de precios entre los mercados chino e internacional. Si el mercado exterior sigue débil mientras los precios en China se mantienen firmes, respaldados por factores de costes como impuestos y facturas, se espera que se abra la ventana de rentabilidad de importación, complementando así la oferta nacional. En el lado exportador, la recuperación de la oferta externa y la reducción de los diferenciales comprimirán los márgenes de beneficio. En el segundo semestre, aunque se prevé que los volúmenes de exportación se mantengan en niveles altos en comparación interanual, se espera que las exportaciones no alcancen los niveles del primer semestre debido a un elevado efecto base y a la debilitación de las ventajas por diferenciales de precios.
Productos semielaborados de aluminio: Desde el punto de vista de la rentabilidad exportadora, la relación de precios SHFE/LME se ha recuperado rápidamente desde finales de junio, provocando que la ventana de arbitraje que impulsó importantes exportaciones de semielaborados de aluminio se cierre de golpe. Los nuevos pedidos en algunos sectores ya han disminuido, y los márgenes de beneficio de exportación actuales se han reducido al nivel observado a principios de marzo, antes del conflicto entre Estados Unidos e Irán. En el contexto actual de débil consolidación de los precios del aluminio, el sentimiento de los clientes intermedios es fuertemente bajista, con una voluntad de recogida de mercancías notablemente debilitada. Los pedidos de almacenamiento se están retrasando en gran medida en el calendario de producción, aunque los pedidos previamente aceptados del modelo de precio fijo se siguen ejecutando según lo previsto. A medida que se vayan completando gradualmente los pedidos en cartera, las exportaciones de semielaborados de aluminio en el segundo semestre podrían enfrentar riesgos de reducción si la rentabilidad exportadora posterior no puede repararse.