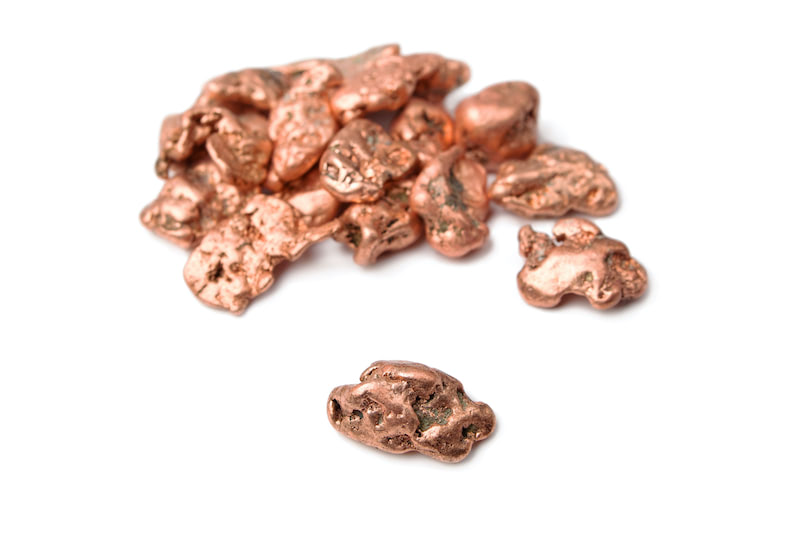
Data released by the online query platform of Customs statistics show that China's imports of copper ores and concentrates in June 2026 were 2,334,780.8 mt, down 1.10% MoM and up 0.03% YoY.
China imported 638,168.31 mt of copper ores and concentrates from Peru in June, down 7.77% MoM and up 22.05% YoY.
China imported 516,799.6 mt of copper ores and concentrates from Chile in June, down 27.35% MoM and down 23.29% YoY.
On the export side, China's exports of copper ores and concentrates in June 2026 were 1.31 mt, down 99.95% MoM and down 96.64% YoY.
China exported 0.53 mt of copper ores and concentrates to the UK in June, up 2.51% MoM and up 6,692.86% YoY.
China exported 0.33 mt of copper ores and concentrates to the Netherlands in June, down 34.01% MoM and up 5,333.33% YoY.
Below is a breakdown of import data compiled from the General Administration of Customs website:
|
Origin |
June 2026 (mt) |
MoM |
YoY |
|---|---|---|---|
|
Peru |
638,168.31 |
-7.77% |
22.05% |
|
Chile |
516,799.6 |
-27.35% |
-23.29% |
|
Mongolia |
214,247.26 |
14.65% |
12.79% |
|
Kazakhstan |
134,966.44 |
25.17% |
-7.67% |
|
Russia |
133,669.85 |
6.80% |
80.40% |
|
Mexico |
126,596 |
131.63% |
-7.04% |
|
Serbia |
110,087.4 |
57.58% |
73.45% |
|
Canada |
86,167.72 |
357.47% |
21.12% |
|
Spain |
80,622.28 |
111.41% |
- |
|
Australia |
54,917.75 |
93.22% |
77.46% |
|
Botswana |
33,531.13 |
22.70% |
1.80% |
|
Armenia |
25,680.84 |
52.70% |
87.25% |
|
Brazil |
23,773.24 |
4.67% |
-25.96% |
|
Ecuador |
22,942.5 |
-65.25% |
-50.63% |
|
Laos |
16,739.07 |
-35.65% |
66.13% |
|
DRC |
15,812.81 |
-44.53% |
-72.99% |
|
Philippines |
11,621.78 |
-54.66% |
6.93% |
|
Eritrea |
11,076.46 |
10.98% |
-64.59% |
|
Saudi Arabia |
10,872.98 |
-77.22% |
-53.38% |
|
Morocco |
10,519.99 |
185.28% |
149.03% |
|
Turkey |
9,739.34 |
1,103.76% |
-2.20% |
|
Azerbaijan |
8,445.38 |
177.55% |
684.86% |
|
Albania |
8,320.77 |
54.88% |
240.21% |
|
Zambia |
7,319.35 |
17.88% |
14.27% |
|
Namibia |
5,356.69 |
30.11% |
2,930.23% |
|
Dominican Republic |
4,546.34 |
81.65% |
-1.36% |
|
Mauritania |
3,790.08 |
0% |
-60.72% |
|
Pakistan |
2,047.51 |
-56.62% |
251.56% |
|
Angola |
1,290.5 |
886.54% |
- |
|
Oman |
962.41 |
-62.08% |
-57.65% |
|
Iran |
847.1 |
- |
87.37% |
|
Mozambique |
722.49 |
49.50% |
222.54% |
|
Congo Republic |
545.48 |
7.83% |
-15.99% |
|
Tanzania |
317.48 |
7.69% |
-21.03% |
|
Colombia |
313.04 |
-91.41% |
- |
|
Madagascar |
265.74 |
-50.33% |
385.55% |
|
UAE |
253.36 |
-77.69% |
-90.24% |
|
Thailand |
251 |
84.02% |
- |
|
Bolivia |
230.36 |
-31.89% |
242.19% |
|
Nigeria |
195.22 |
-11.67% |
21.79% |
|
Niger |
112.32 |
- |
- |
|
Myanmar |
43.63 |
-93.98% |
-98.24% |
|
Afghanistan |
28 |
- |
- |
|
Vietnam |
23.66 |
-62.93% |
- |
|
Netherlands |
0.07 |
27.45% |
32.65% |
|
Malaysia |
0.04 |
600.00% |
-100.00% |
|
Total |
2,334,780.8 |
-1.10% |
0.03% |
Source: General Administration of Customs
Below is a breakdown of export data compiled from the General Administration of Customs website:
|
Destination |
June 2026 (mt) |
MoM |
YoY |
|---|---|---|---|
|
UK |
0.53 |
2.51% |
6,692.86% |
|
Netherlands |
0.33 |
-34.01% |
5,333.33% |
|
Mongolia |
0.24 |
-99.94% |
- |
|
Belgium |
0.1 |
100.00% |
900.00% |
|
Australia |
0.06 |
52.50% |
- |
|
Kazakhstan |
0.02 |
-73.63% |
- |
|
Azerbaijan |
0.01 |
- |
- |
|
Total |
1.31 |
-99.95% |
-96.64% |
Source: General Administration of Customs
(Wenhua Comprehensive)