[SMM Analysis] Decoding China's H1 2026 Sulphur and Sulphuric Acid Customs Data: Shifting Volume, Source and Momentum

Published: Jul 20, 2026 19:03
Focused on H1-2026 customs data — a cliff in sulfur imports with a reshuffled source mix; acid exports collapsing under the export ban. Three charts decode the shifts in volume, source and momentum.

I.China monthly sulfur imports (2025–2026, Jan–Jun)

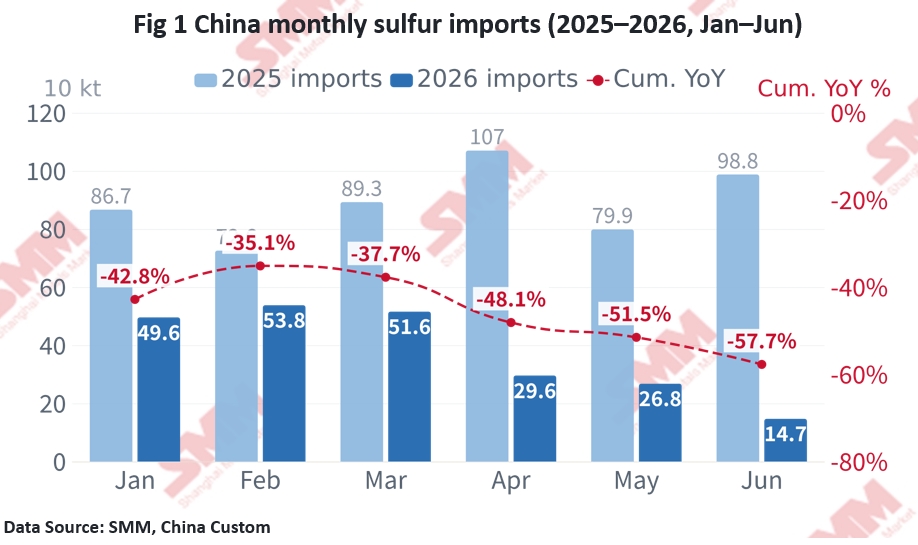
    In H1-2026 China's sulfur imports accelerated their contraction. Cumulative Jan–Jun imports were ~2.26 Mt, down 57.7% from ~5.34 Mt a year earlier; the monthly average fell from ~0.80 Mt in 2025 to ~0.38 Mt.

    Monthly, Jan–Mar held around 0.50 Mt (0.50 / 0.54 / 0.52 Mt); a cliff set in from April — 0.30 Mt in April, 0.27 in May, and just 0.147 Mt in June (−85.1% YoY), under one-fifth of the year-earlier level.

    Full-year 2025 imports were ~9.61 Mt (avg ~0.80 Mt/mo), and June's 0.147 Mt is a multi-year low. If the geopolitical conflict and Kazakhstan's export ban persist, H2 imports may weaken further — full-year 2026 is on track for only ~40% of 2025.
II.China sulfur import-source mix (FY2025 vs H1-2026)

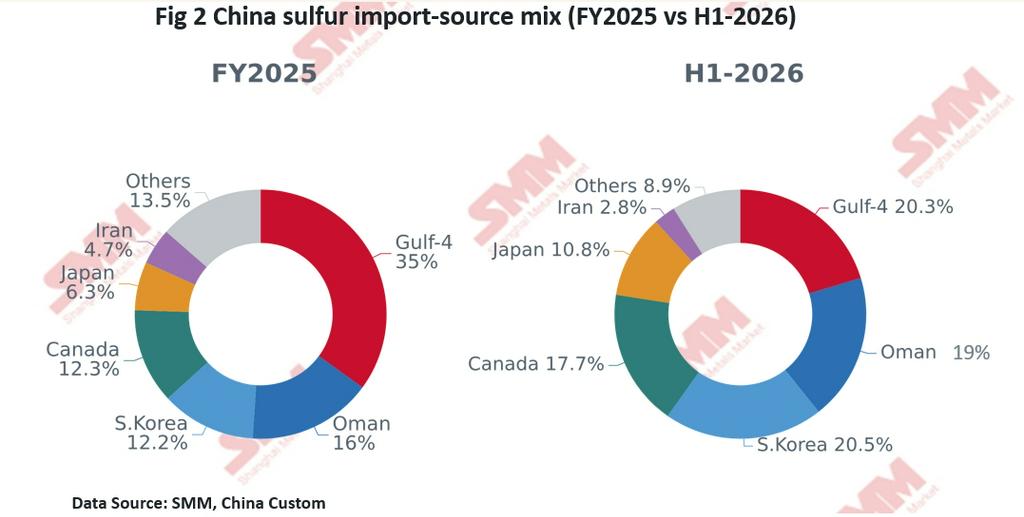
    China's sulfur import-source mix was fundamentally reshaped in H1-2026. In 2025 total imports were ~9.61 Mt, highly concentrated in the Middle East — Saudi Arabia, UAE, Qatar and Kuwait together ~35% (Oman another ~16%); sanctioned Iran was only ~4.7%, in sporadic cargoes.

    In H1-2026 the Gulf-4 share halved to ~20%South Korea jumped to #1 at ~0.46 Mt (20.5%), Oman ~0.43 Mt (19.0%) and Canada ~0.40 Mt (17.7%) — together ~58% — becoming the core alternative suppliers, with Japan (10.8%) close behind. Notably, Iran shipped ~62 kt directly in April (via Hainan), its first large direct arrival since the conflict, showing some cargoes have transited the Strait.

    Behind this is the double shock of the Hormuz closure and Kazakhstan's export ban. The halving of the Middle-East share passively narrows China's geopolitical exposure, but the stability, price and durability of alternative sources remain to be seen.
III.China monthly sulfuric-acid exports & the export ban (2025–2026, Jan–Jun)

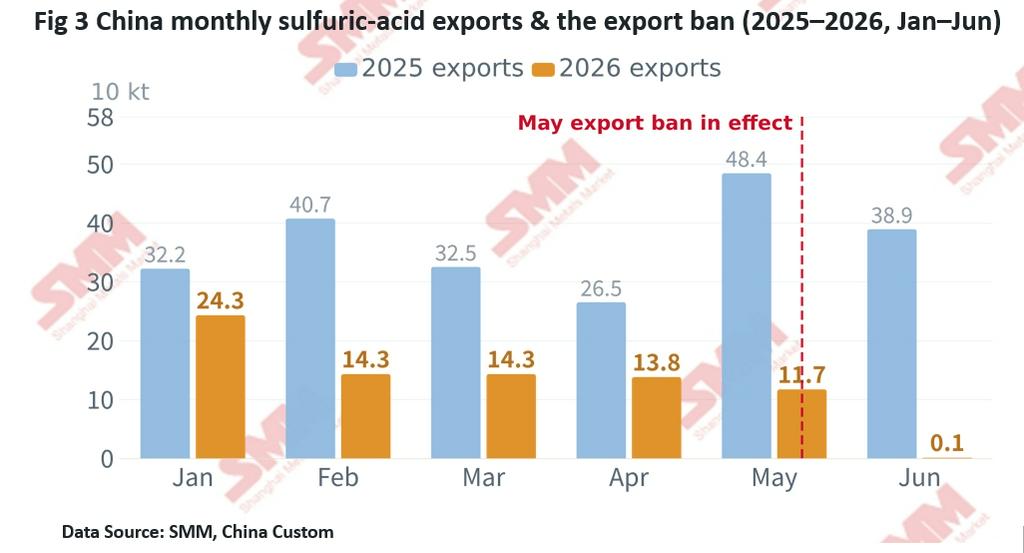
    China's sulfuric-acid exports show a gradual decline then a June cliff to zero. Cumulative H1-2026 exports were ~0.78 Mt, down 64.2% from ~2.19 Mt a year earlier.

    2026 exports weakened month by month: 0.24 Mt in January, easing to 0.11–0.14 Mt over Feb–May, then collapsing to ~980 t (0.001 Mt) in June — −99.7% YoY, ~−99% MoM, as export controls / quota cuts took hold and acid "stayed domestic".

    Versus 2025 (full-year ~4.65 Mt, avg ~0.39 Mt/mo, peaking at 0.525 Mt in December), H1-2026 was only ~36% of the year-earlier level, and June (0.001 Mt) was under 0.3% of June-2025 (0.389 Mt).

    Destinations reshaped too: 2025 was led by Chile (32.4%), Indonesia (14.7%), Morocco / Saudi (~12% each); in H1-2026 Indonesia (HPAL nickel) jumped to #1 (28.0%), Chile fell to 18.4%, Saudi / India ~13% each. Buyers highly dependent on Chinese acid (e.g. Chile, ~one-fifth of its copper output uses acid) face direct supply-chain pressure, reshaping global acid trade.
IV.Core Conclusion:

  1.     Sulfur imports: Volume cliff, source reshuffle — H1-2026 imports ~2.26 Mt (−57.7% YoY; June −85%); the Gulf-4 share halved (~35% → ~20%), replaced by S.Korea / Oman / Canada (~58% combined).
  2.     Acid exports: Ban to zero — H1-2026 exports ~0.78 Mt (−64% YoY); June only ~980 t (−99.7% YoY), a cliff exit; Indonesia becomes the top destination.
  3.     Common logic: Geopolitical conflict + export controls together — China shifts from a "global sulfur hub" to "self-protective contraction".

Data Source Statement: Except for publicly available information, all other data are processed by SMM based on publicly available information, market communication, and relying on SMM's internal database model. They are for reference only and do not constitute decision-making recommendations.

For any inquiries or for more information, please contact: lemonzhao@smm.cn
For more information on how to access our research reports, please contact:service.en@smm.cn
Related News
[SMM Manganese Ore Weekly Review] Pre-Holiday Stockpiling Falls Short of Expectations Spot Manganese Ore Prices Generally Decline
1 hour ago
[SMM Manganese Ore Weekly Review] Pre-Holiday Stockpiling Falls Short of Expectations Spot Manganese Ore Prices Generally Decline
Read More
[SMM Manganese Ore Weekly Review] Pre-Holiday Stockpiling Falls Short of Expectations Spot Manganese Ore Prices Generally Decline
[SMM Manganese Ore Weekly Review] Pre-Holiday Stockpiling Falls Short of Expectations Spot Manganese Ore Prices Generally Decline
Sep 21 news: North ports: 46% Australian lumps at 40.3-40.8 yuan/mtu, flat WoW; South African semi-carbonate at 33.5-33.8 yuan/mtu, down WoW; Gabonese at 39.1-39.3 yuan/mtu, down WoW; South African high-iron at 28.8-29.3 yuan/mtu, flat WoW; South African medium-iron at 35.2-35.5 yuan/mtu, down WoW. South ports: 46% Australian lumps at 42.7-43.2 yuan/mtu, flat WoW; South African semi-carbonate at 36-36.5 yuan/mtu, down WoW; Gabonese at 40.3-40.8 yuan/mtu, flat WoW; South African high-iron at 29.3-29.8 yuan/mtu, down WoW; South African medium-iron at 37.1-37.6 yuan/mtu, up WoW. Inquiry activity in the manganese ore market remains sluggish, pre-holiday stockpiling and the traditional peak season have fallen short of expectations, and port spot prices in both north and south China are broadly declining.
1 hour ago
China Aims for 11.5 kWh/100km Energy Consumption in Electric Cars by 2030, MIIT Outlines Plan
1 hour ago
China Aims for 11.5 kWh/100km Energy Consumption in Electric Cars by 2030, MIIT Outlines Plan
Read More
China Aims for 11.5 kWh/100km Energy Consumption in Electric Cars by 2030, MIIT Outlines Plan
[MIIT and eight other departments: By 2030, average energy consumption of battery electric passenger vehicles to reach around 11.5 kWh per 100 km] The MIIT and eight other departments issued the Intelligent Connected NEV Industry Development 15th Five-Year Plan. The plan proposes that by 2030, key technology levels will be effectively improved. Average fuel consumption of passenger vehicles will reach 3.3 liters per 100 km, and average energy consumption of battery electric passenger vehicles will reach around 11.5 kWh per 100 km. Highly automated driving will be achieved on highways, urban expressways, and some urban roads.
1 hour ago
State Grid Enhances Services for New Energy, Storage, and Efficiency to Support Zero-Carbon Goals
1 hour ago
State Grid Enhances Services for New Energy, Storage, and Efficiency to Support Zero-Carbon Goals
Read More
State Grid Enhances Services for New Energy, Storage, and Efficiency to Support Zero-Carbon Goals
[State Grid: Providing Fair and Efficient Grid Connection Services for New Entities and Business Forms Such as New Energy, New-Type Energy Storage, and Generation-Grid-Load-Storage] State Grid Corporation of China has released several measures to build a modern electricity business environment and empower high-quality economic and social development. Among them, it mentioned proactively serving enterprises in energy conservation, carbon reduction, and efficiency improvement. It will deepen "power supply + energy efficiency" services, fully promote the "Enterprise Electricity Assistant," push energy efficiency bills to 100% of registered high-voltage clients on "Online State Grid," and provide free energy-saving diagnostics as well as green electricity and green certificate consulting services. It will actively support the construction of zero-carbon parks and assist export-oriented enterprises in low-carbon development through direct green electricity connections and renewable energy substitution.
1 hour ago