Gold comes under pressure
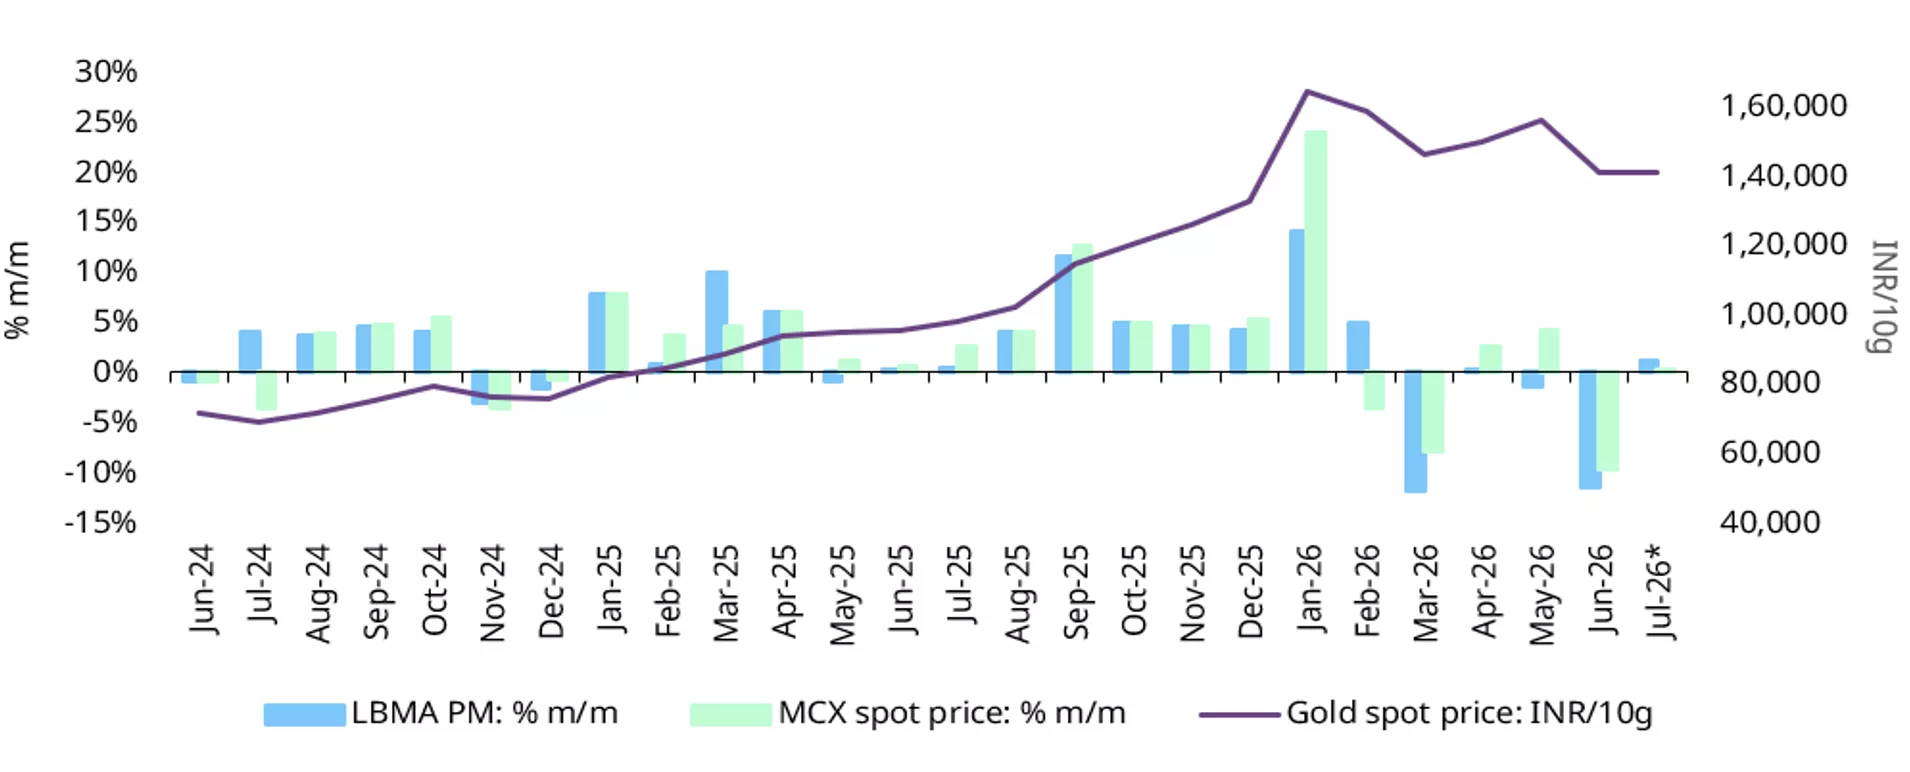
International and domestic gold prices recorded a sharp decline in June. The international price2 fell by more than 11% to around US$4,000/oz, its lowest level since October, while domestic price3 declined by around 10% to near INR141,000/10g, a six-month low. Although prices have recovered marginally since then, international gold price remains nearly 7% lower on a year-to-date basis. In contrast, domestic price is up around 6% y-t-d, supported by the 9% import duty hike in May and the INR depreciation against the US dollar.
A stronger US dollar, intensifying expectations of US rate hikes, and a rotation towards equities in Western markets have weighed on gold prices. At the same time, the pullback in prices has provided a buying opportunity to those waiting to enter the market, cushioning the decline in prices.
Chart 1: Gold weakens
Month-end LBMA Price PM and MCX spot gold price changes and movement*
*As of 14 July 2026. Source: Bloomberg, World Gold Council
Ample supply keeps domestic prices at a discount
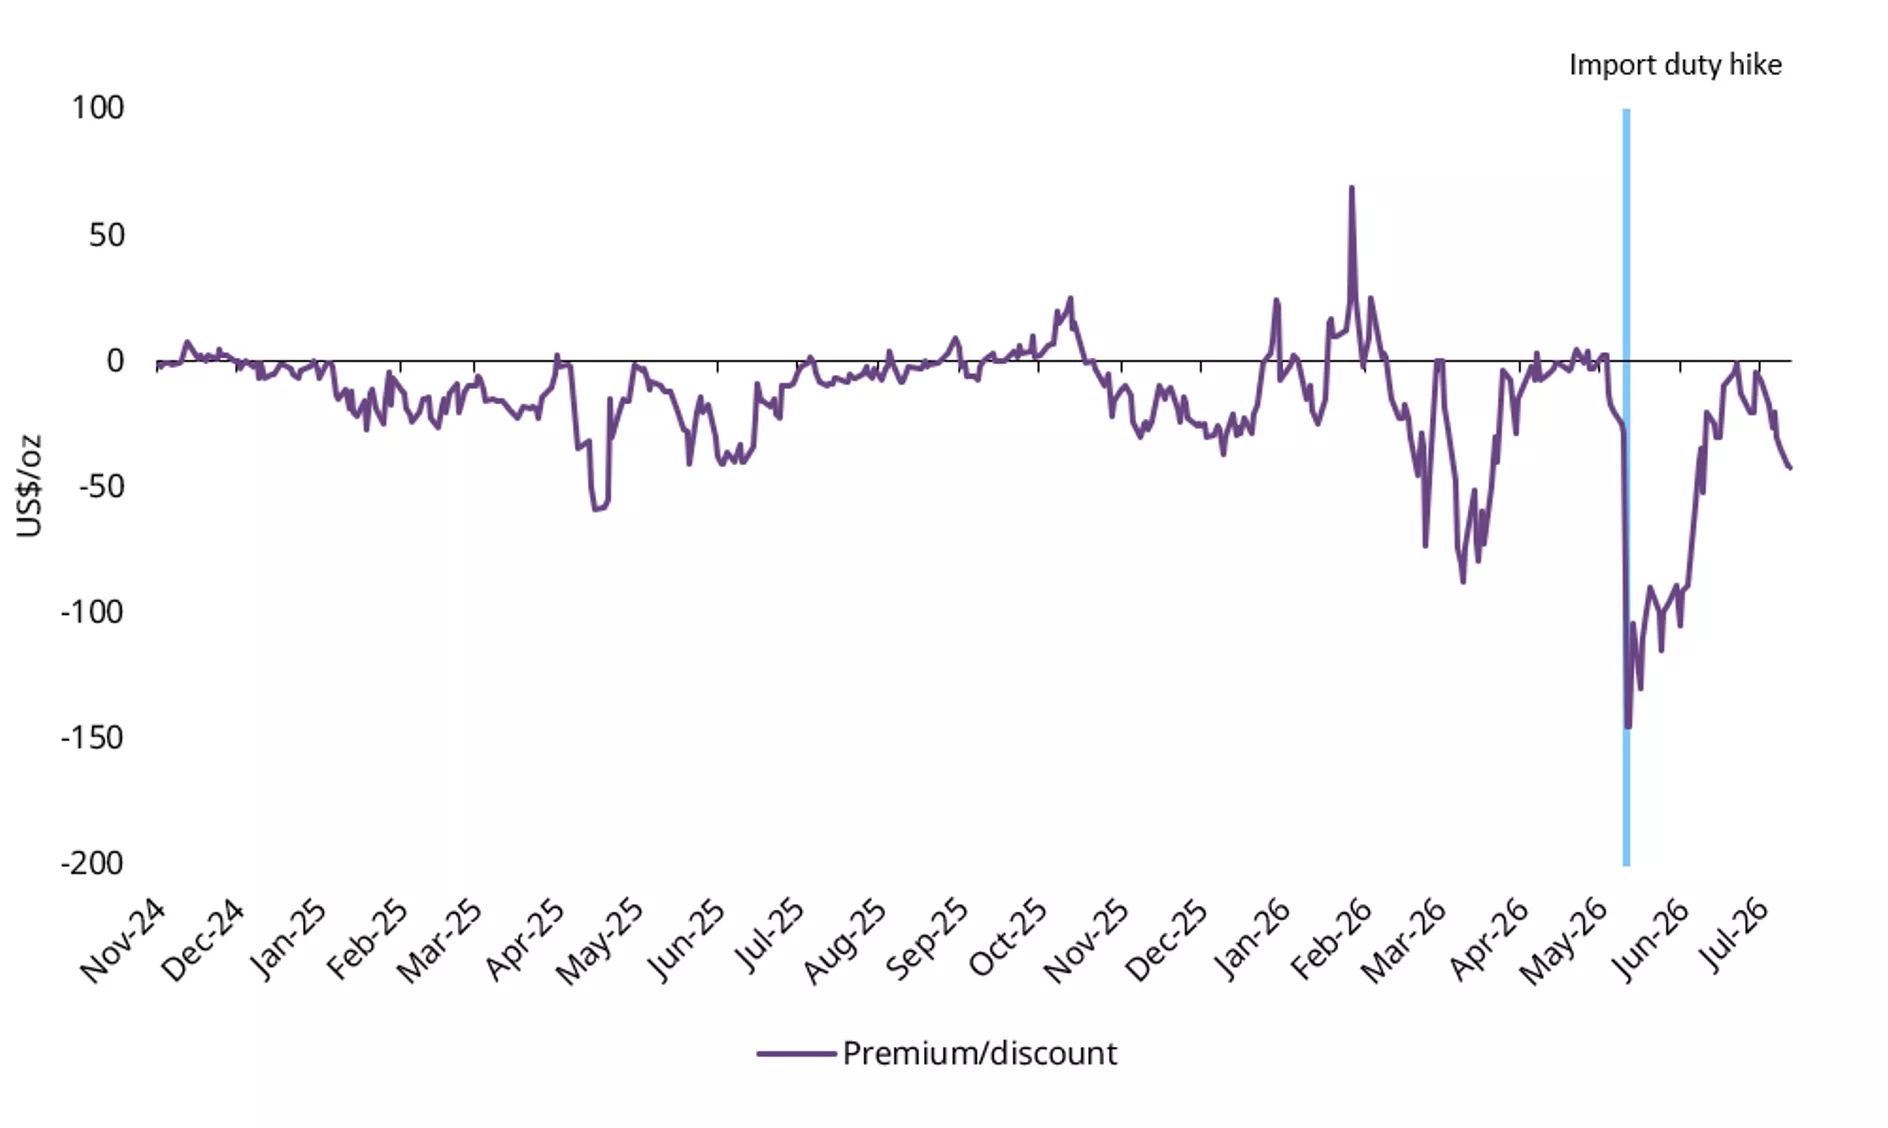
Gold price discounts in the domestic market have narrowed considerably from the elevated levels following the import duty hike in May and early June, indicating a gradual normalisation of market conditions. Discounts averaged around US$20/oz to the landed price4 during the first two weeks of July, significantly lower than the peak discount of nearly US$150/oz recorded in May. Domestic prices briefly traded close to parity with the landed price in late June and early July, indicating an improving market balance. Discounts have widened since to US$40/oz as of mid-July. The prevailing level of discount reflects the availability of ample domestic supply relative to demand. Industry interactions indicate that the rise in old gold exchange for new jewellery has increased the supply of gold in the market.
Chart 2: Discounts recede
NCDEX gold premium/discount relative to the official domestic price*
*As of 14 July 2026.
Source: NCDEX, World Gold Council
Jewellery buying gains traction
Following a month-long lull from mid-May to mid-June, driven by seasonally softer demand, an inauspicious period,5 policy measures and the Prime Minister’s appeal to limit gold purchases, consumer demand has reportedly begun to recover. Industry feedback suggests that while overall demand remains subdued, consumer buying has picked up in recent weeks, led primarily by jewellery. In contrast, bar and coin demand appears to have cooled.
The pullback in gold prices and the relative price stability are said to be stimulating jewellery purchases. The promotional campaign by retailers, including discounts, exchange offers, flexible payment terms, etc., have also been supporting sales. Notably, demand has not been limited to wedding-related purchases. Manufacturers too have been receiving order bookings from retailers in preparation for the festive season from August.
At the same time, softer prices have tempered demand for bars and coins, which are typically bought for investment purposes and tend to attract stronger interest during periods of rising prices.
Meanwhile, the exchange of old gold jewellery has gained further traction following the import duty hike in mid-May. Retailers report that exchange volumes have risen by a further 10–20%, with some indicating that old gold exchanges now account for as much as 70% of jewellery sales.
Healthy performance of listed jewellers in April–June quarter
Major listed jewellery retailers6 reported a strong April–June quarter despite an inauspicious period that typically tempers purchases. Revenue growth was broadly in the high 30–60% y/y range, supported by regional festivals, the summer wedding season and Akshay Tritiya7 during the early part of the quarter.
Demand was broad, with plain gold and studded jewellery registering double-digit sales growth. Retailers also reported growth both in customer additions and average ticket sizes.
Old gold exchange for new jewellery continued to rise on average accounting for somewhere between 43–55% of sales during the quarter, aided in part by promotional and marketing campaigns. These retailers continued with their store expansions, adding between 8 and 33 stores across the country during the quarter. The continued pace of store openings can be seen as reflecting industry confidence in the medium-term outlook for jewellery demand.
Price pullback drives ETF inflows
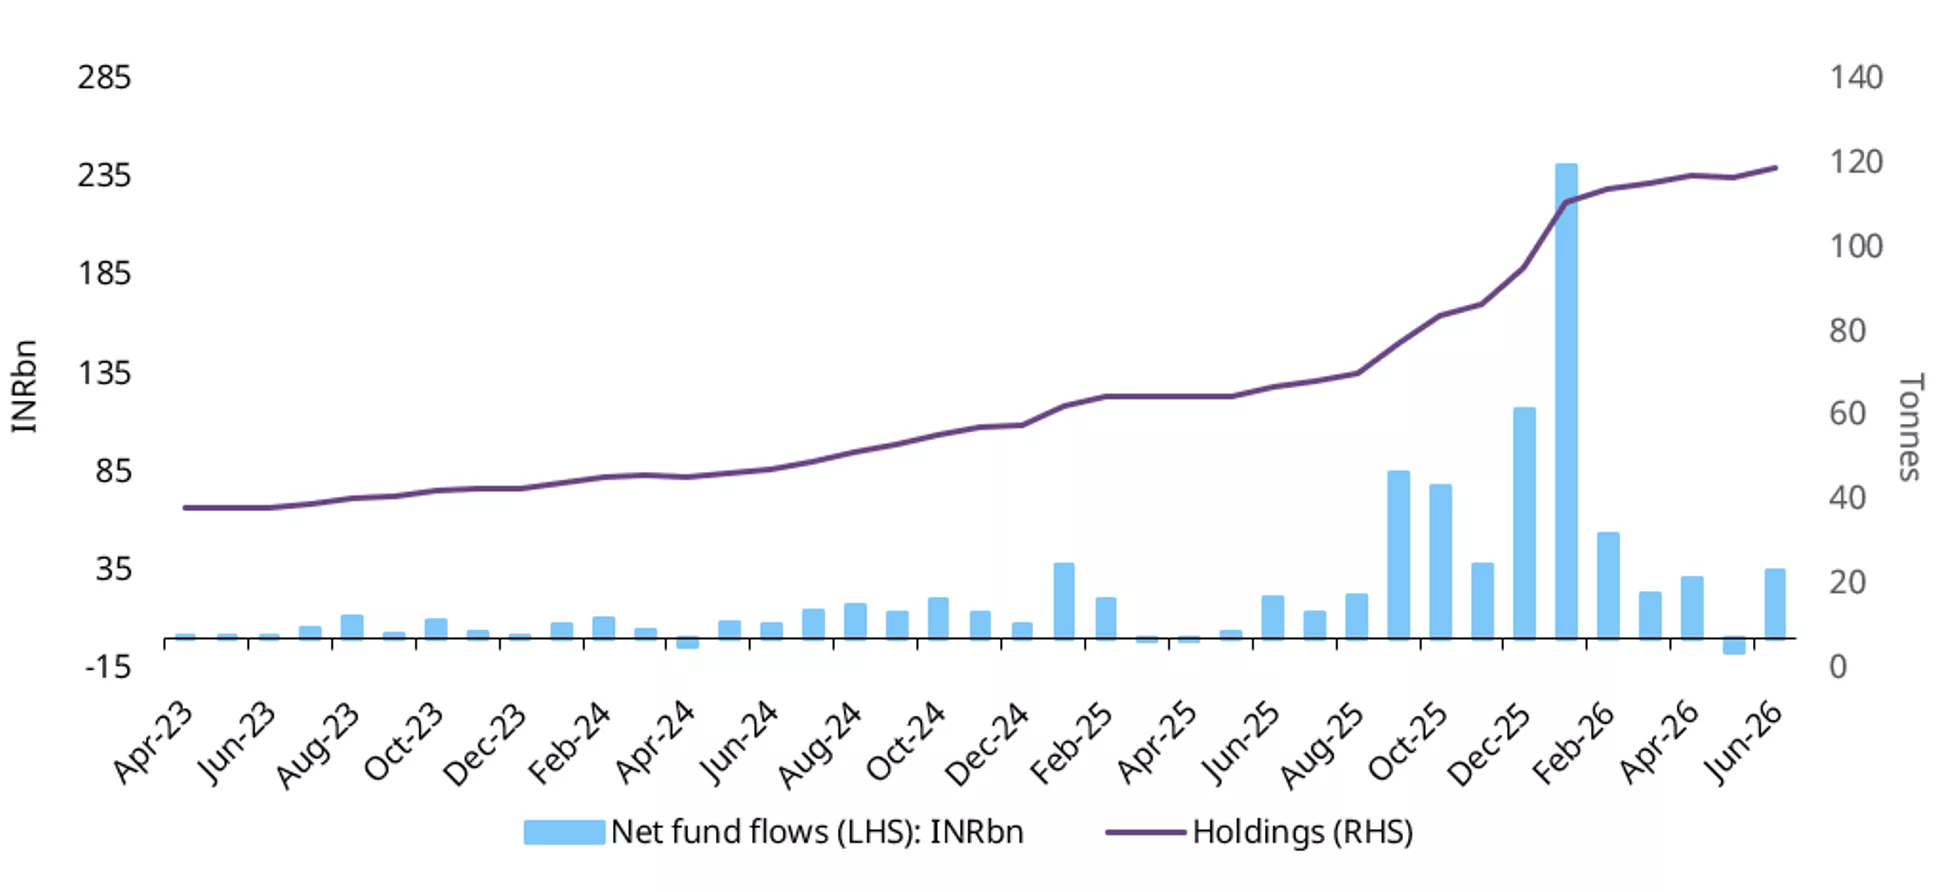
Indian gold ETFs recorded a rebound in June, in contrast to the global trend of outflows, as investors bought into the price dips. Net inflows during the month were INR34.4bn (US$356mn), the highest since February. Holdings increased by 2.2t to 119t, in line with our estimates, while the cumulative AUM fell 8% m/m, reflecting the decline in gold prices during the month.
The price pullback appears to have been viewed as a buying opportunity by investors, with inflows remaining healthy in early July. During 1–10 July, net inflows are estimated at INR12.1bn (US$127mn). Investor participation also broadened, with 135k new folios (accounts) being added during the month, taking the total number of accounts to 12.5mn.
Chart 3: Gold ETF flows rebound
Gold ETF flows in INRbn, and total holdings in tonnes*
*As of end June 2026.
Source: AMFI, ICRA Analytics, CMIE, World Gold Council
Increased buying of digital gold
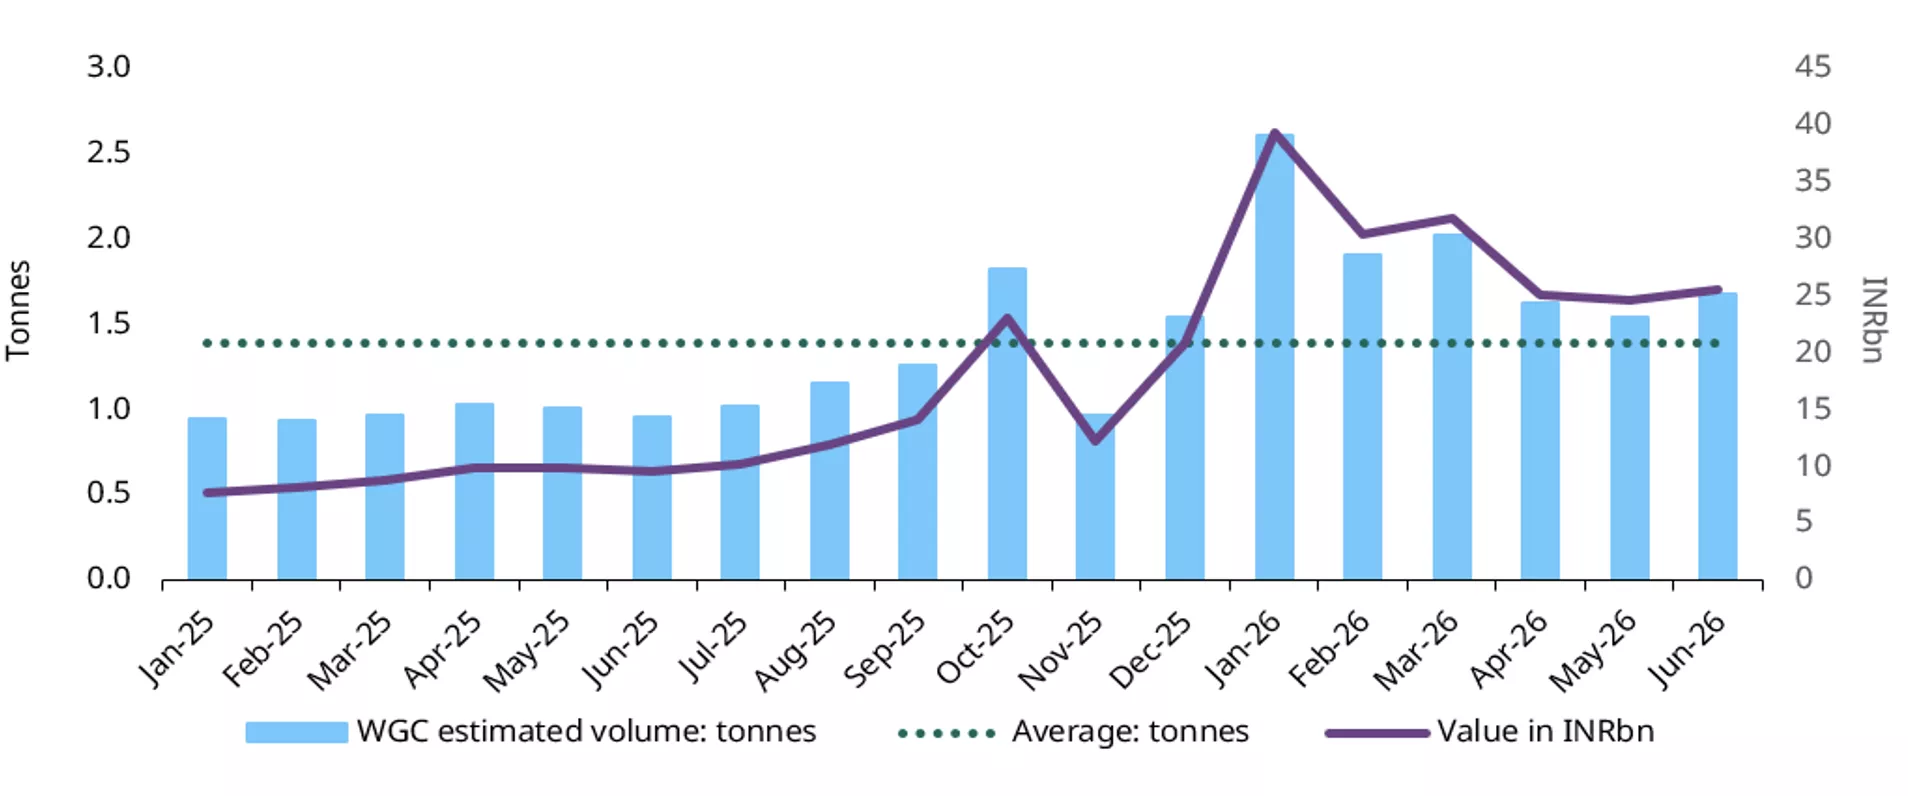
Digital gold purchases through the Unified Payment Interface (UPI) rebounded in June after moderation in the previous month. Both transaction value and estimated volumes reached a three-month high, pointing to renewed investor interest. Transaction value rose 4% m/m to INR25.5bn (US$269mn), while volumes are estimated to have increased 9% m/m to 1.7t. Purchases during the month were above the 17-month average of 1.4t and remained within the higher-transacting category of UPI, suggesting that demand in the digital gold segment continues to be resilient.
Chart 4: Resilient demand in digital gold
Purchase of digital gold, by value and estimated volume
Source: NPCI, World Gold Council
Imports ease amid soft demand and recycled supply
Gold imports weakened further in June, declining for a second consecutive month. At US$1.97bn, imports were down 42% m/m and the lowest since June 2025. However, import value was 7% higher y/y, driven largely by higher gold prices, with the average landed cost of gold rising 38% from a year ago.8 Import volumes in June are estimated at 16–22t, down from 29t in May and 25t in June 2025. The decline in import volumes is reflective of softer demand, elevated inventories in the supply chain, and supply from the exchange and sale of old gold. Old gold supply has risen since the import duty hike, lowering the need for fresh imports. Consequently, gold’s share of total merchandise imports fell to 3% in June, well below the 17% recorded in January.
Chart 5: Gold imports hit one-year low
Monthly gold imports in tonnes and US$bn*
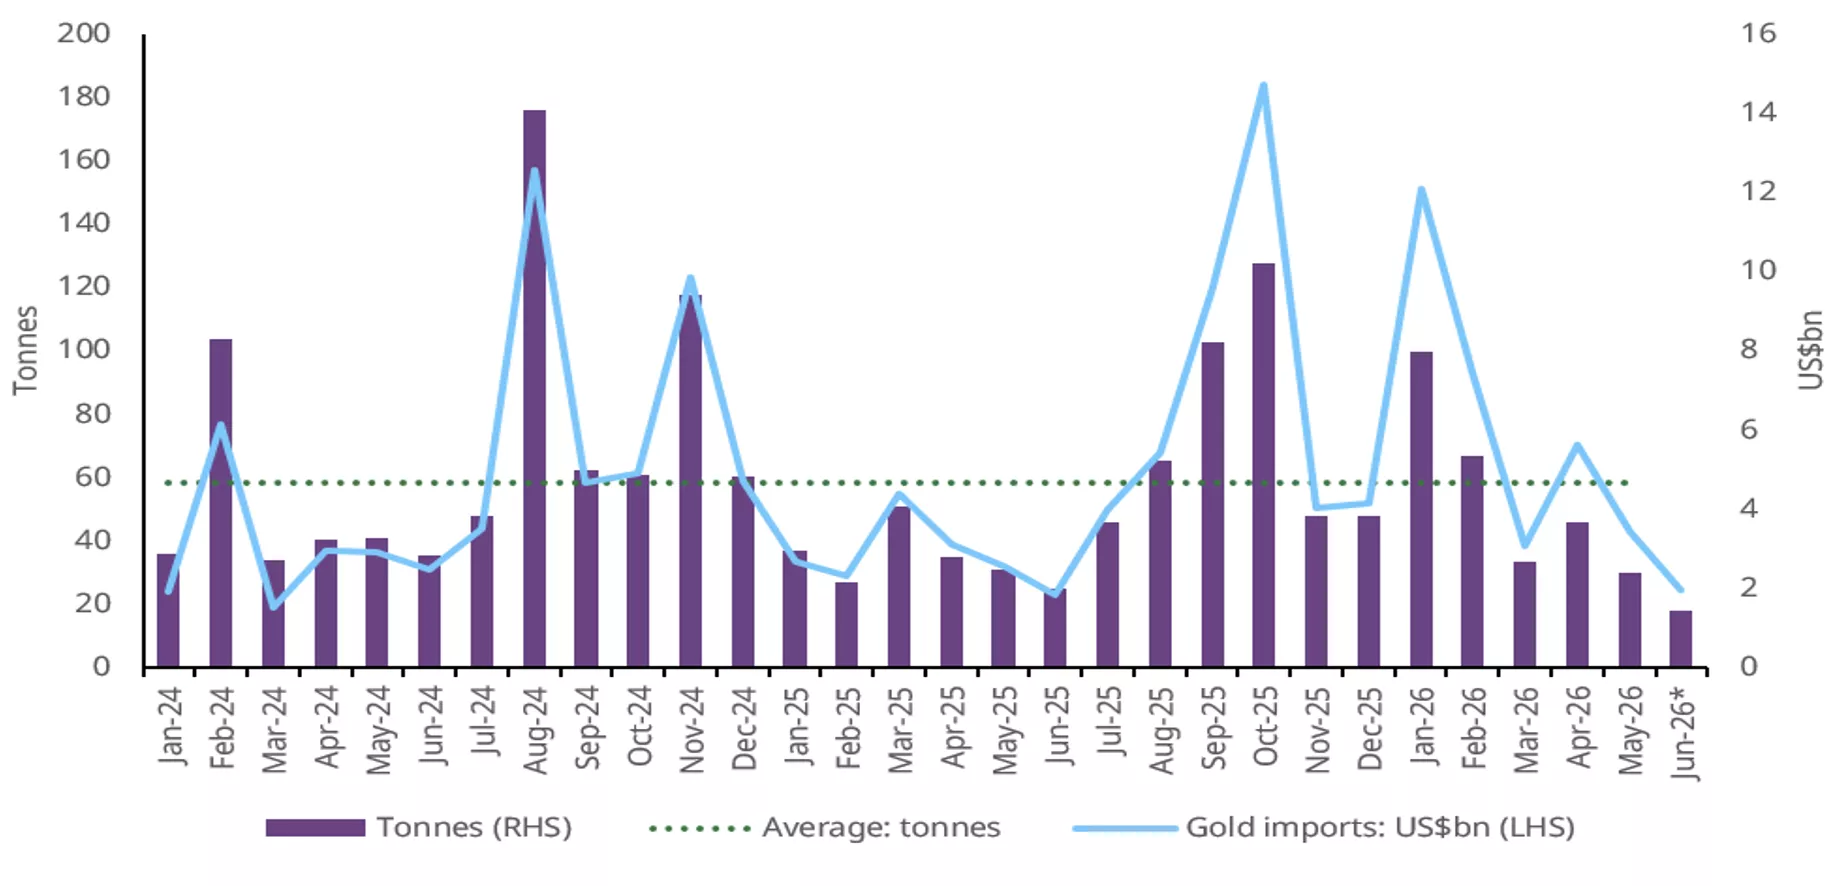
*Includes World Gold Council estimates.
Source: Ministry of Commerce and Industry, CMIE, World Gold Council
Footnotes
1LBMA Gold Price and MCX Spot Gold Price as of 14 July 2026.
2LBMA Gold Price PM.
3MCX Spot Gold Price.
4Landed price is the international price (LBMA Gold Price AM) adjusted for import tax.
5Adhik Maas from 17 May to 15 June 2026.
6Titan Company Ltd, Kalyan Jewellers India Ltd, Senco Gold Ltd, PN Gadgil Jewellers Limited
7Akshay Tritiya (19-20 April) is traditionally regarded as an auspicious and key demand period for gold.
8Landed cost is the international price (LBMA Gold Price AM) adjusted for import taxes.
Source:https://www.gold.org/goldhub/gold-focus/2026/07/india-gold-market-update-mixed-demand-signals