News Release, July 10, 2026:
Chrome ore prices saw distinct phased volatility in the first half of 2026, rallying throughout Q1 before sliding downward on a gradual downtrend in Q2.
Price Review: Cost-Driven Upswing Followed by Gradual Decline Amid Oversupply
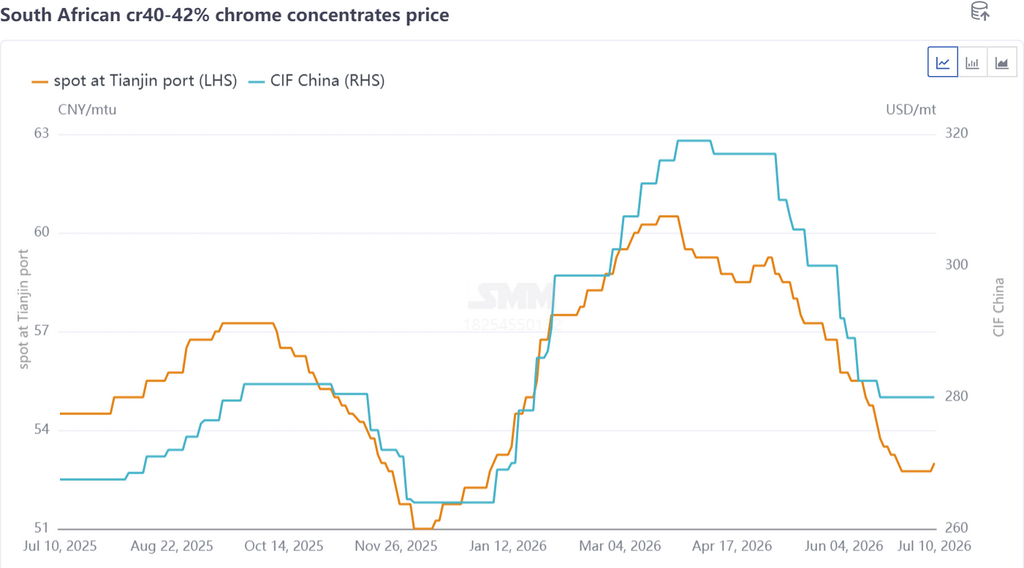
Taking South African 40–42% chrome concentrate ore as an example, domestic spot prices climbed from RMB 52.5 per metric ton unit to RMB 60.5 per metric ton unit in Q1, while major overseas mine quotations rose from USD 264 per metric ton to USD 319 per metric ton. In the early stage, tightened Indonesian nickel ore quotas pushed stainless steel prices sharply higher. Driven by bullish market sentiment, offshore chromite ore prices led the price hike. Coupled with domestic ferrochrome mills ramping up pre-Spring Festival inventory building, domestic spot prices tracked upward accordingly. Subsequently, the outbreak of Middle East tensions between the US and Iran sent fuel prices surging, triggering a steep jump in ocean freight rates for chromite ore. Higher logistics costs further lifted chromite ore prices.
Q2 witnessed a notable surplus of chromite ore, and mounting shipment pressure triggered a steady pullback in ore quotations. Middle East conflicts eased, halting the rally and stabilizing ocean freight costs for chromite. Global chromite shipments remained elevated at 2.8–3.0 million metric tons per month, resulting in ample ore supply. Concentrated port arrivals fueled continuous inventory accumulation at major ports. Meanwhile, ferrochrome producers had wrapped up bulk stockpiling in the prior quarter, leaving them with muted purchasing appetite and a wait-and-see stance toward ore price movements, translating to sluggish transaction volumes. Chromite ore holders lost confidence and began selling cargo at discounted prices to offload stocks. Abundant South African fine ore posted a substantial price drop from RMB 60.5 to RMB 55 per metric ton unit. In contrast, high-grade chromite concentrate fines and mainstream chromite ore spot supplies remained relatively tight, limiting their downside. Overall, prices trended in a divergent pattern.
Supply Landscape: Stable Shipments and Persistently Surging Inventories
Per SMM statistical data, total bulk chromite ore shipments worldwide from January to June 2026 reached 16.0796 million metric tons, a year-on-year increase of 13.87%, with monthly shipments holding at 2.8–3.0 million metric tons. China’s total chromite ore imports from January to May 2026 stood at 11.2556 million metric tons, averaging 2.2511 million metric tons monthly, up 36.36% year-on-year. Supply remained robust across H1 2026, with the only disruption in February stemming from flood-induced transport bottlenecks during South Africa’s rainy season. The loose supply outlook is unlikely to shift in the short term.
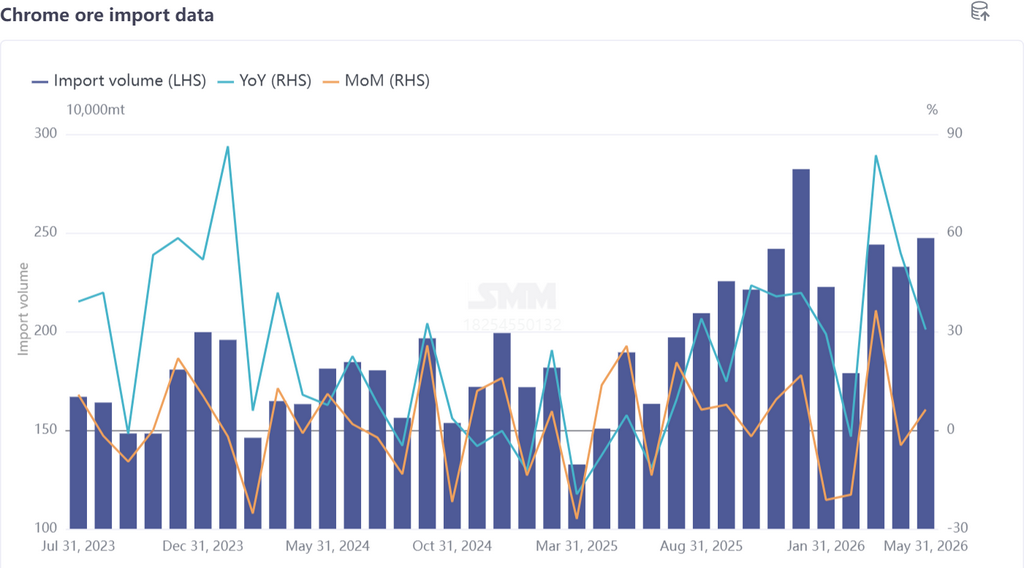
By source country, South Africa retained its dominant position. H1 2026 chromite ore imports from South Africa totaled 8.96 million metric tons, rising 29.91% year-on-year and accounting for 79.64% of China’s total imports. Massive ferrochrome plant shutdowns in South Africa during 2025 drastically cut local ore absorption capacity, prompting domestic mines to pivot heavily toward exports and sustain rising South African chromite ore supply. Shipments from Zimbabwe and Turkey also registered remarkable growth:
- Imports from Zimbabwe: 989,600 metric tons, +44.3% YoY, 8.8% market share
- Imports from Turkey: 694,600 metric tons, +170.17% YoY, 6.13% market share
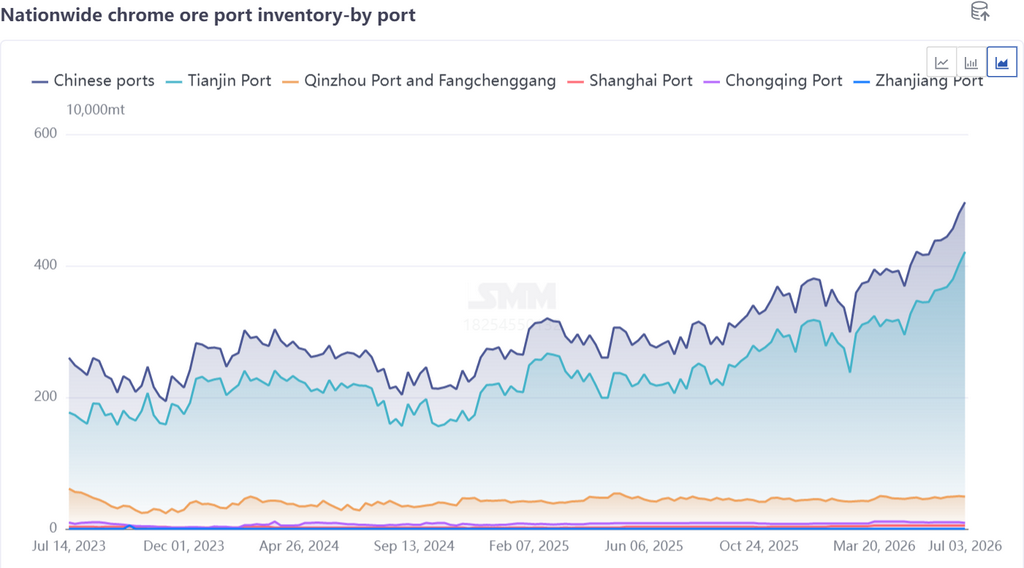
Concentrated ore arrivals pushed port inflows higher, lifting port inventories to repeated record highs. As of end-June, national chromite ore port inventories hit 4.7 million metric tons, jumping 67.86% year-on-year. Bearish expectations around the downstream consumption off-season kept ferrochrome producers on the sidelines with weak buying interest, with no turning point for inventory drawdown visible for chromite ore as yet.
Demand Landscape: Stable Output Yet Sluggish Purchasing Rhythm
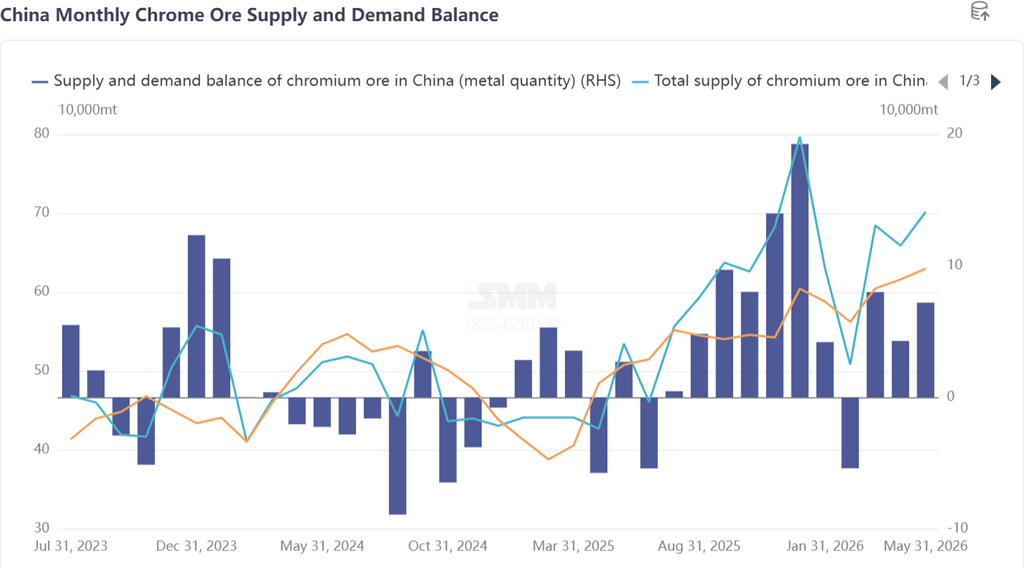
Domestic ferrochrome output trended higher in H1 2026, averaging 900,200 metric tons per month, a 36.79% year-on-year rise that underpinned rigid baseline demand for chromite ore. However, most ferrochrome mills completed raw material stockpiling in Q1. Q2 saw weak and volatile stainless steel downstream performance, leading producers to adopt a hand-to-mouth procurement strategy without long-term inventory building. As a result, inquiry and purchasing activity for chromite ore remained slack, dragging ore prices lower. Against the backdrop of abundant ore supply, ferrochrome producers maintained a cautious wait-and-see stance. Mounting ferrochrome oversupply and softening ferrochrome prices further dampened confidence in the market outlook, fostering widespread price-cutting sentiment and a stalemate between buyers and sellers.
Market Outlook
In the short run, the chromite ore market will mostly fluctuate within a narrow range amid oversupply. On one hand, South Africa’s ferrochrome resumption progresses sluggishly, leaving local ore absorption capacity weak. Monthly exports are projected to stay high at 2.4 million metric tons, with limited downside risk to overall chromite shipments. On the other hand, the stainless steel sector remains mired in the consumption off-season, with multiple steel mills implementing production cuts and maintenance works. Downbeat sentiment spills over to weigh on ferrochrome prices. Ferrochrome producers will stick to demand-based purchasing, with ore arrivals outpacing consumption to keep port inventories elevated; meaningful inventory drawdowns are unlikely in the near term.
Nevertheless, heightened geopolitical uncertainties worldwide provide cost support for overseas chromite mining and logistics costs, capping room for steep price declines and favoring sideways price consolidation. Key monitoring indicators: progress of South African ferrochrome capacity restarts, downstream stainless steel and ferrochrome production schedules, and shifts in global macro geopolitical developments.
![[SMM Chromium Flash] China August 2026 HC FeCr Imports Rise 18.7% MoM to ~157,610 t as South Africa Returns](https://imgqn.smm.cn/usercenter/CIcRv20251217171725.jpg)
![August silicone exports increase MoM, imports decrease MoM [SMM analysis]](https://imgqn.smm.cn/usercenter/rUQIB20251217171723.jpeg)
![[SMM Flash] Amnesty Reports Abuses at Rubaya Coltan Mines and Alleged Trafficking to Rwanda](https://imgqn.smm.cn/usercenter/gKDYO20251217171723.jpeg)