I. Điểm chính
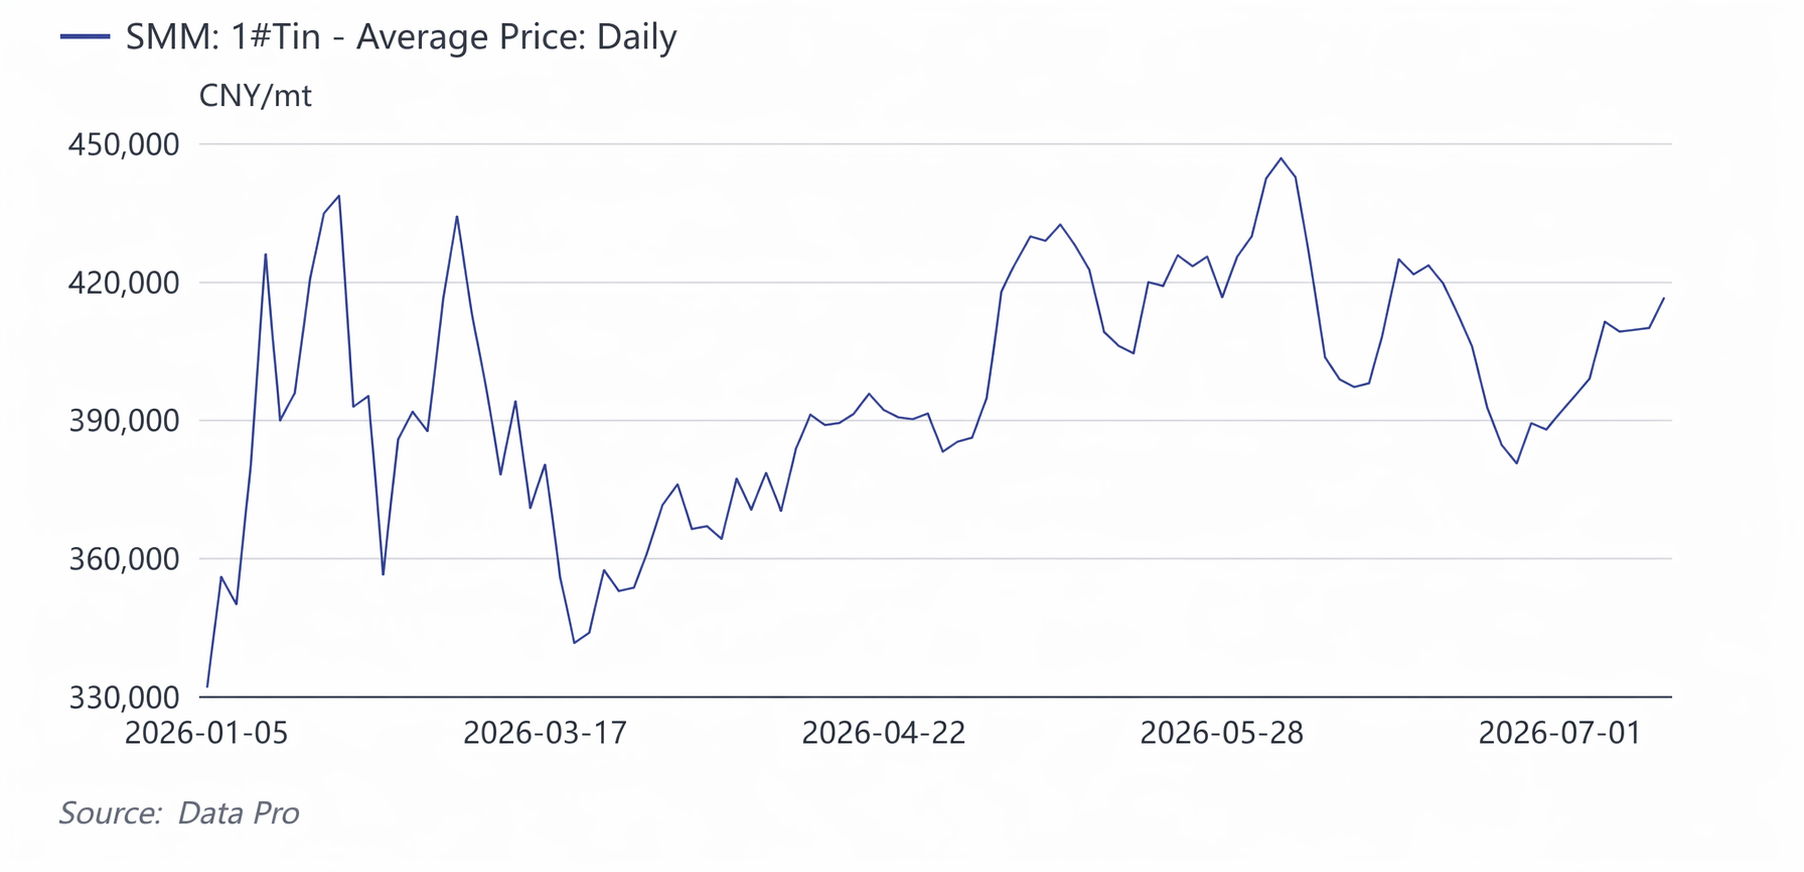
Nửa đầu năm 2026, giá thiếc diễn biến theo mô hình dao động biên độ rộng, lên xuống thất thường: “lập đỉnh lịch sử — điều chỉnh tích lũy — tăng vọt trở lại — tích lũy ở mức cao”. Hợp đồng thiếc giao dịch nhiều nhất trên LME tăng từ khoảng 42.000 USD/tấn vào đầu năm lên mức cao kỷ lục 59.000 USD/tấn, điều chỉnh xuống 40.500 USD/tấn vào tháng 3, rồi lại tăng vọt lên gần 58.000 USD/tấn vào tháng 4-5, và đến cuối tháng 6 giảm xuống dưới 50.000 USD/tấn; hợp đồng thiếc giao dịch nhiều nhất trên SHFE tăng từ 330.000 nhân dân tệ/tấn vào đầu năm lên mức cao kỷ lục 470.000 nhân dân tệ/tấn, giảm xuống 322.600 nhân dân tệ/tấn vào tháng 3, chạm 451.000 nhân dân tệ/tấn vào đầu tháng 6, rồi cuối tháng lùi về dưới 400.000 nhân dân tệ/tấn.
Động lực chi phối chu kỳ giá này là sự cộng hưởng đan xen giữa tiến độ khôi phục sản xuất tại bang Wa của Myanmar liên tục thấp hơn kỳ vọng, chính sách xuất khẩu thắt chặt của Indonesia và xung đột địa chính trị tại CHDC Congo ba tuyến chính phía cung với chi tiêu vốn cho sức mạnh tính toán AI bùng nổ và chu kỳ bán dẫn phục hồi tuyến chính phía cầu. Trung tâm giá thiếc dịch chuyển lên mức cao hơn một cách hệ thống so với năm 2025 — giá giao ngay trung bình trên LME trong nửa đầu năm là 50.291 USD/tấn, tăng 56,59% so với cùng kỳ; giá trung bình hợp đồng giao dịch nhiều nhất trên SHFE là 396.000 nhân dân tệ/tấn, tăng 51,11% so với cùng kỳ. Logic cân bằng căng thẳng “độ cứng của cung + tăng trưởng nhờ AI” , kết hợp với tồn kho thấp, đã khuếch đại biến động giá.
Các biến số theo dõi chính đối với giá thiếc nửa cuối năm 2026: Thứ nhất, tốc độ tăng tốc khôi phục sản xuất tại bang Wa sau mùa mưa (tháng 5-7) , và liệu khu khai thác Man Maw có thể tiến từ mức 40-50% so với trước lệnh cấm hiện nay lên 70% hay không. Thứ hai, tiến độ phê duyệt RKAB hàng năm của Indonesia , về số liệu xuất khẩu, xuất khẩu thỏi thiếc của Indonesia trong tháng 6/2026 đạt 2.995 tấn, tăng 5,09% so với tháng 5 nhưng giảm 32,55% so với cùng kỳ năm ngoái. Dữ liệu lũy kế nửa đầu năm cho thấy tổng xuất khẩu thỏi thiếc của Indonesia từ tháng 1 đến tháng 6/2026 đạt 18.715 tấn, giảm 25,14% so với cùng kỳ so với 25.000 tấn cùng kỳ năm 2025. Nhìn chung, trong khi xuất khẩu tháng 6 đơn lẻ tiếp tục xu hướng phục hồi khiêm tốn so với tháng trước, tổng xuất khẩu nửa đầu năm vẫn sụt giảm đáng kể so với cùng kỳ năm ngoái. Thứ ba, liệu chi tiêu vốn cho máy chủ AI, đóng gói tiên tiến và mô-đun quang có tiếp tục được hiện thực hóa hay không, khi nhu cầu thiếc toàn cầu từ AI năm 2026 vào khoảng 12-15 nghìn tấn, chỉ chiếm 3-4% tổng tiêu thụ toàn cầu 370 nghìn tấn, nhưng hầu như toàn bộ nhu cầu gia tăng đều đến từ AI. Thứ tư, liệu tồn kho khả kiến toàn cầu có thể thoát khỏi mức thấp . Trong kịch bản trung tính, giá thiếc LME dự kiến giao dịch trong khoảng 50.000-56.000 USD/tấn vào nửa cuối năm, còn giá thiếc SHFE ở mức 380.000-440.000 nhân dân tệ/tấn .
2. Môi trường vĩ mô – Đảo chiều thanh khoản, Cú sốc địa chính trị và Tái định giá “Kim loại Điện toán”
1. Fed Mỹ “Từ Bồ câu sang Diều hâu,” Đề cử Warsh đảo ngược kỳ vọng nới lỏng
Vào đầu năm, thị trường đặt cược vào việc cắt giảm lãi suất 50–100 điểm cơ bản trong nửa đầu năm 2026, chỉ số đô la Mỹ giảm xuống dưới 97, và ngành kim loại màu tăng giá trên diện rộng. Cuối tháng 1, Warsh được đề cử làm Chủ tịch Fed , khiến đồng đô la chạm đáy và kim loại cơ bản đồng loạt thoái lui. Giá thiếc bắt đầu đợt điều chỉnh giảm sâu đầu tiên từ 470.000 xuống 320.000. Biểu đồ dot plot tháng 6 nghiêng về diều hâu, logic “hiện thực hóa nới lỏng” được điều chỉnh một cách hệ thống, và cùng với lo ngại tăng lãi suất, giá thiếc lại thoái lui vào tháng 6 từ 450.000 xuống dưới 400.000.
2. Địa chính trị Trung Đông lan từ “Giao dịch trú ẩn an toàn” sang “Tác động vận tải biển thực tế”
Vào tháng 3, cuộc tấn công quân sự chung của Mỹ-Israel vào Iran và những xáo trộn tại eo biển Hormuz không chỉ đẩy phí bảo hiểm năng lượng lên cao mà, trực tiếp hơn đối với thiếc, là sự gián đoạn của tuyến vận tải thiếc tinh chế Indonesia-Châu Âu . Sau lệnh ngừng bắn Mỹ-Iran vào giữa tháng 6, phí bảo hiểm năng lượng và trú ẩn an toàn giảm dần, giá thiếc đồng thời đạt đỉnh và thoái lui.
3. Nhân dân tệ “Hai sức mạnh” + Mỹ thêm thiếc vào Danh sách Khoáng sản Thiết yếu
Nhân dân tệ nội địa tăng từ 6,98 lên 6,79, giảm chi phí nhập khẩu và mở ra cơ hội, nhưng thách thức trong nước đối với thiếc không phải là cú sốc nhập khẩu (xuất khẩu của Indonesia đã giảm một nửa) mà là nỗ lực của Mỹ vào năm 2026 nhằm độc lập hóa chuỗi cung ứng thiếc – với tư cách là thành viên danh sách khoáng sản thiết yếu của Mỹ, thiếc được đưa vào câu chuyện “tái định giá tài nguyên chiến lược”, được hưởng phí bảo hiểm vốn cùng với đồng và niken.
3. Chính sách công nghiệp – Wa “nói nhiều hơn làm” và Indonesia “chủ nghĩa dân tộc tài nguyên” thắt chặt kép
1. Bang Wa, Myanmar: “Ba xiềng xích” trong quá trình khôi phục sản lượng sau lệnh cấm khai thác
Bang Wa cấm khai thác vào tháng 8/2023 và đến tháng 7/2025 mới cấp phép khai thác, nhưng sản lượng khôi phục thực tế thấp xa kỳ vọng , hiện công suất chỉ đạt 40–50% mức trước lệnh cấm:
- Xiềng xích vật chất : Hầm mỏ sâu bị ngập úng nghiêm trọng; việc chia sẻ chi phí bơm nước chính thức được triển khai vào tháng 3/2026, các khu vực có độ cao thấp, hàm lượng quặng cao từ từ đạt sản lượng tối đa;
- Xiềng xích thể chế : Xuất khẩu chuyển sang đánh thuế 30% bằng hiện vật thay thế thuế tiền mặt; một phần quặng được giữ lại cho luyện kim địa phương, làm giảm lượng xuất sang Trung Quốc. Từ tháng 1 đến tháng 4, dù lượng nhập khẩu thực tế đạt 69,1 nghìn tấn, tăng 88% so với cùng kỳ (hiệu ứng nền thấp), nhưng lượng kim loại tương đương chỉ đạt 22,5 nghìn tấn, tăng 36% so với cùng kỳ, tăng trưởng so với tháng trước không đáng kể;
- Xiềng xích bất khả kháng : Vụ nổ lớn tại nhà máy thuốc nổ Bangkang ở Wa ngày 7/4 khiến tất cả nhà máy hóa chất/thuốc nổ trong bang phải đình chỉ, cắt đứt nguồn cung thuốc nổ dân dụng. Cùng với hạn chế khai thác lộ thiên và vận tải đường bộ trong mùa mưa từ tháng 5 đến tháng 7, trước tháng 8 chưa thể có tăng trưởng quy mô lớn .
2. Indonesia: Từ rút ngắn thời hạn RKAB đến thuế lợi nhuận bất thường, xuất khẩu thiếc tinh luyện "giảm một nửa"
Indonesia, nước xuất khẩu thiếc tinh luyện lớn nhất thế giới, trong năm 2026 chứng kiến hàng loạt gói chính sách:
- Phê duyệt RKAB được thay đổi từ chu kỳ ba năm về một năm, hạn ngạch của một số doanh nghiệp năm 2026 bị thu hồi và xem xét lại, khiến sự bất ổn về xuất khẩu tăng vọt;
- xuất khẩu thiếc tinh luyện tháng 4 chỉ đạt 2.255 tấn, giảm 53,7% so với cùng kỳ và giảm một nửa so với tháng trước, chủ yếu do gia hạn giấy phép, siết chặt hạn ngạch và cải tổ ngành;
3. Mỏ Bisie của DRC: “Sự thiếu hụt kéo dài” từ xung đột vũ trang
Bisie chiếm khoảng 6% nguồn cung toàn cầu. Sau khi ngừng hoạt động vào tháng 3 năm 2025 do xung đột vũ trang, sản lượng không phục hồi hoàn toàn trong cả năm, và đầu năm 2026, sạt lở đất cộng với trở ngại địa chính trị đã tạo ra gián đoạn thứ ba về phía cung.
4. Chuỗi nguyên liệu thô: Truyền tải chi phí từ Tinh quặng thiếc → Thiếc tinh luyện → Chất hàn
1. Tinh quặng thiếc: Phí TC phục hồi, nhưng "Nới lỏng biên" không đồng nghĩa với "Nới lỏng"
Trong nửa đầu năm 2026, phí TC tinh quặng thiếc trong nước được nâng cộng dồn 5.500 nhân dân tệ/tấn, một xác nhận về cải thiện biên của nguyên liệu thô ở mức giá cả, tuy nhiên quặng trong nước không ghi nhận tăng trưởng, sự nới lỏng ở bên ngoài Trung Quốc thấp hơn kỳ vọng, và không thấy sự nới lỏng đáng kể ở khâu thỏi.
- Cơ cấu nhập khẩu đã thay đổi về mặt cấu trúc: năm 2022, Myanmar chiếm 77% nhập khẩu tinh quặng thiếc của Trung Quốc, giảm xuống 26% năm 2025, trong khi CHDC Congo tăng lên 24%, Australia 12%, và Bolivia 10% – sự đa dạng hóa giảm thiểu gián đoạn nguồn cung, nhưng khối lượng tuyệt đối không thể lấp đầy khoảng trống mà Myanmar để lại.
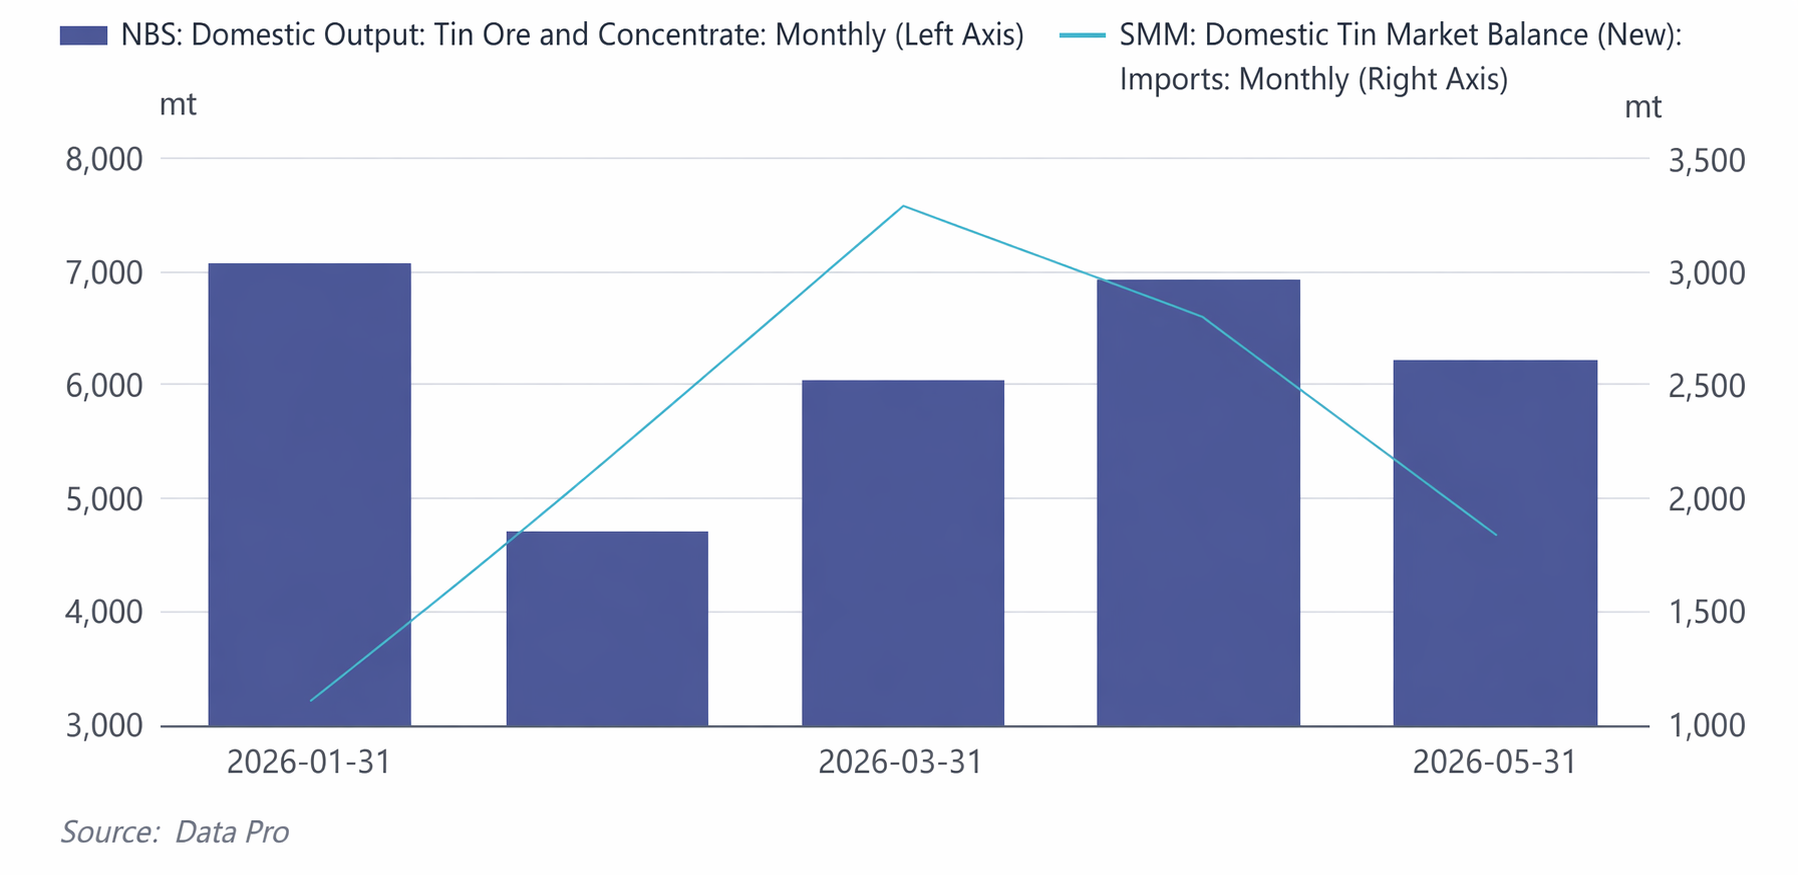
- Quặng thiếc trong nước: từ tháng 1 đến tháng 5, tổng sản lượng quặng và tinh quặng thiếc trong nước đạt khoảng 30.600 tấn, trung bình khoảng 6.187 tấn/tháng. Sản lượng tháng 1 là 7.062 tấn, đỉnh trong kỳ; tháng 2 giảm mạnh xuống 4.708 tấn (giảm 33,3% so với tháng trước) do Tết Nguyên đán; tháng 3 đến tháng 5 phục hồi dần lên mức 6.000–7.000 tấn.
- Nhập khẩu thỏi thiếc: nhập khẩu tháng 1 chỉ 1.101 tấn (mức thấp trong năm), tăng lên 3.287 tấn vào tháng 3 (đỉnh trong năm), rồi giảm xuống 2.802 tấn và 1.838 tấn trong tháng 4 và tháng 5. Nhập khẩu cộng dồn từ tháng 1 đến tháng 5 khoảng 11.200 tấn, trung bình khoảng 2.239 tấn/tháng.
Cân bằng thắt chặt ở khâu khai thác: tăng trưởng sản lượng quặng trong nước hạn chế, nhập khẩu giảm so với đỉnh tháng 3, khiến tổng cung khai thác trong tháng 5 đạt khoảng 8.049 tấn (trong nước + nhập khẩu). Mô hình tổng thể là “quặng trong nước tăng ổn định, bổ sung nhập khẩu biến động,” và sự thắt chặt ở khâu khai thác tạo hỗ trợ đáy cho giá thiếc.
2. Sản xuất thiếc tinh luyện: Trong nửa đầu năm, sản lượng thiếc tinh luyện cộng dồn của SMM vào khoảng 86.800 tấn.
Vào tháng 2, sản lượng giảm xuống còn 11.490 tấn do bảo trì Tết Nguyên đán (mức thấp nhất nửa đầu năm), sau đó nhanh chóng hồi phục lên 14.950 tấn từ tháng 3. Từ tháng 4 đến tháng 6, sản lượng ổn định trong khoảng 14.670-15.430 tấn, với tháng 6 đạt mức cao nhất nửa đầu năm là 15.430 tấn, cho thấy các nhà máy luyện kim vẫn duy trì nhiệt huyết sản xuất cao bất chấp nguồn cung nguyên liệu thô thắt chặt.
- Tỷ trọng thiếc tái chế: Sản lượng thiếc tinh chế tái chế lũy kế từ tháng 1 đến tháng 6 khoảng 17.200 tấn, chiếm khoảng 19,8% tổng sản lượng. Tháng 2, thiếc tái chế chỉ đạt 1.770 tấn (bị ảnh hưởng bởi việc ngừng hoạt động dịp Tết Nguyên đán), dần hồi phục lên 3.000-3.220 tấn từ tháng 5 đến tháng 6. Độ co giãn cung của vật liệu tái chế hạn chế.
- Tỷ lệ vận hành: Tỷ lệ vận hành trung bình của các nhà máy luyện kim giảm từ 62,7% trong tháng 1 xuống 47,7% vào tháng 2 (Tết Nguyên đán), sau đó duy trì trong khoảng 54,3%-57,1% từ tháng 3 đến tháng 6, hồi phục lên 57,1% vào tháng 6. Tỷ lệ vận hành tổng thể ở mức trung bình của ngành, phản ánh sự hạn chế của nguồn cung quặng chặt chẽ đối với giải phóng công suất luyện kim.
3. Chất hàn thiếc/Hóa chất thiếc: 'Tiêu thụ ẩn' của chuỗi sức mạnh tính toán AI
Nhu cầu chất hàn truyền thống (PCB, đồ gia dụng, ô tô) ổn định nhưng yếu, trong khimáy chủ AI tiêu thụ lượng thiếc trên mỗi đơn vị cao hơn gấp bốn lần so với máy chủ truyền thống, với thiếc được tiêu thụ trong mọi khâu từ đóng gói tiên tiến đến mối hàn mô-đun quang. Năm 2026, nhu cầu thiếc liên quan đến AI dự kiến 12.000-15.000 tấn, trong khi thiếc dùng trong điện mặt trời trải qua điều chỉnh, và nhu cầu chất hàn bán dẫn vẫn duy trì sức bật.
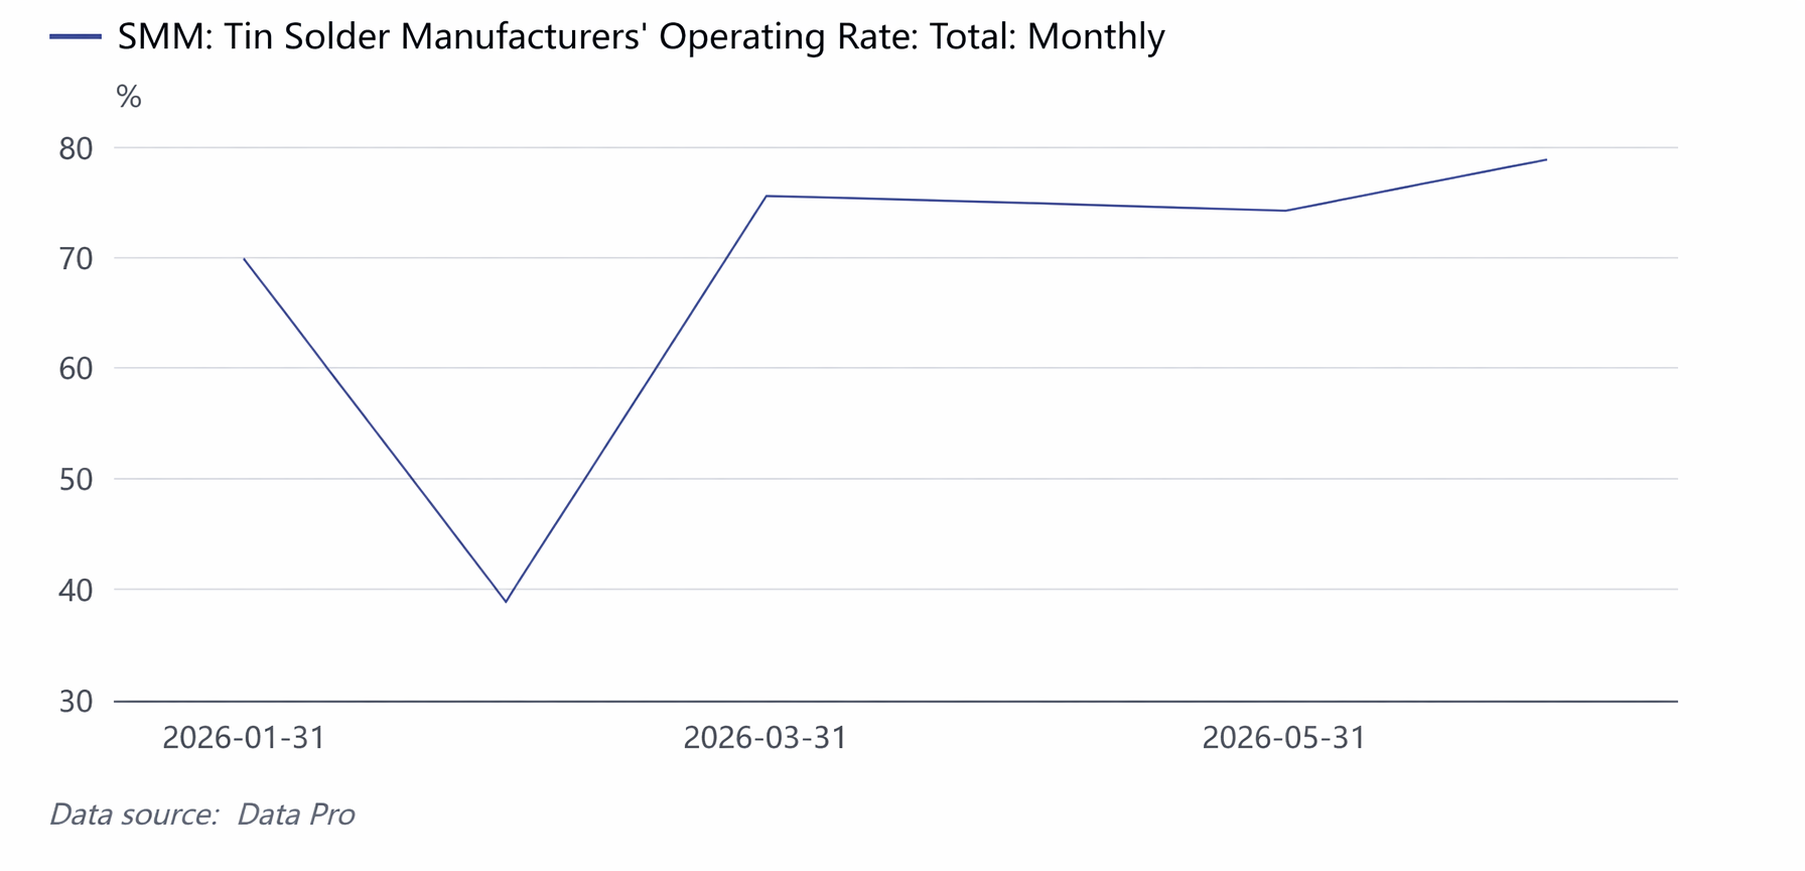
Tỷ lệ vận hành chất hàn thiếc là chỉ số tiêu thụ thiếc chính: Tiêu thụ chất hàn thiếc chiếm hơn 60% tổng tiêu thụ thiếc tinh chế của Trung Quốc, phản ánh trực tiếp sức mạnh nhu cầu thực tế từ các ngành sử dụng cuối cùng như điện tử và điện mặt trời.
- Đặc điểm hiệu suất: Tỷ lệ vận hành đạt 69,7% trong tháng 1 (được thúc đẩy bởi tích trữ trước Tết Nguyên đán), giảm mạnh xuống 39,0% vào tháng 2 (nghỉ Tết + giá thiếc cao kìm hãm mua hàng), hồi phục mạnh lên 75,5% vào tháng 3 (tái tích trữ sau kỳ nghỉ), duy trì ở mức cao 74,2%-74,9% từ tháng 4 đến tháng 5, và tiếp tục leo lên 78,8% vào tháng 6, đạt đỉnh nửa đầu năm.
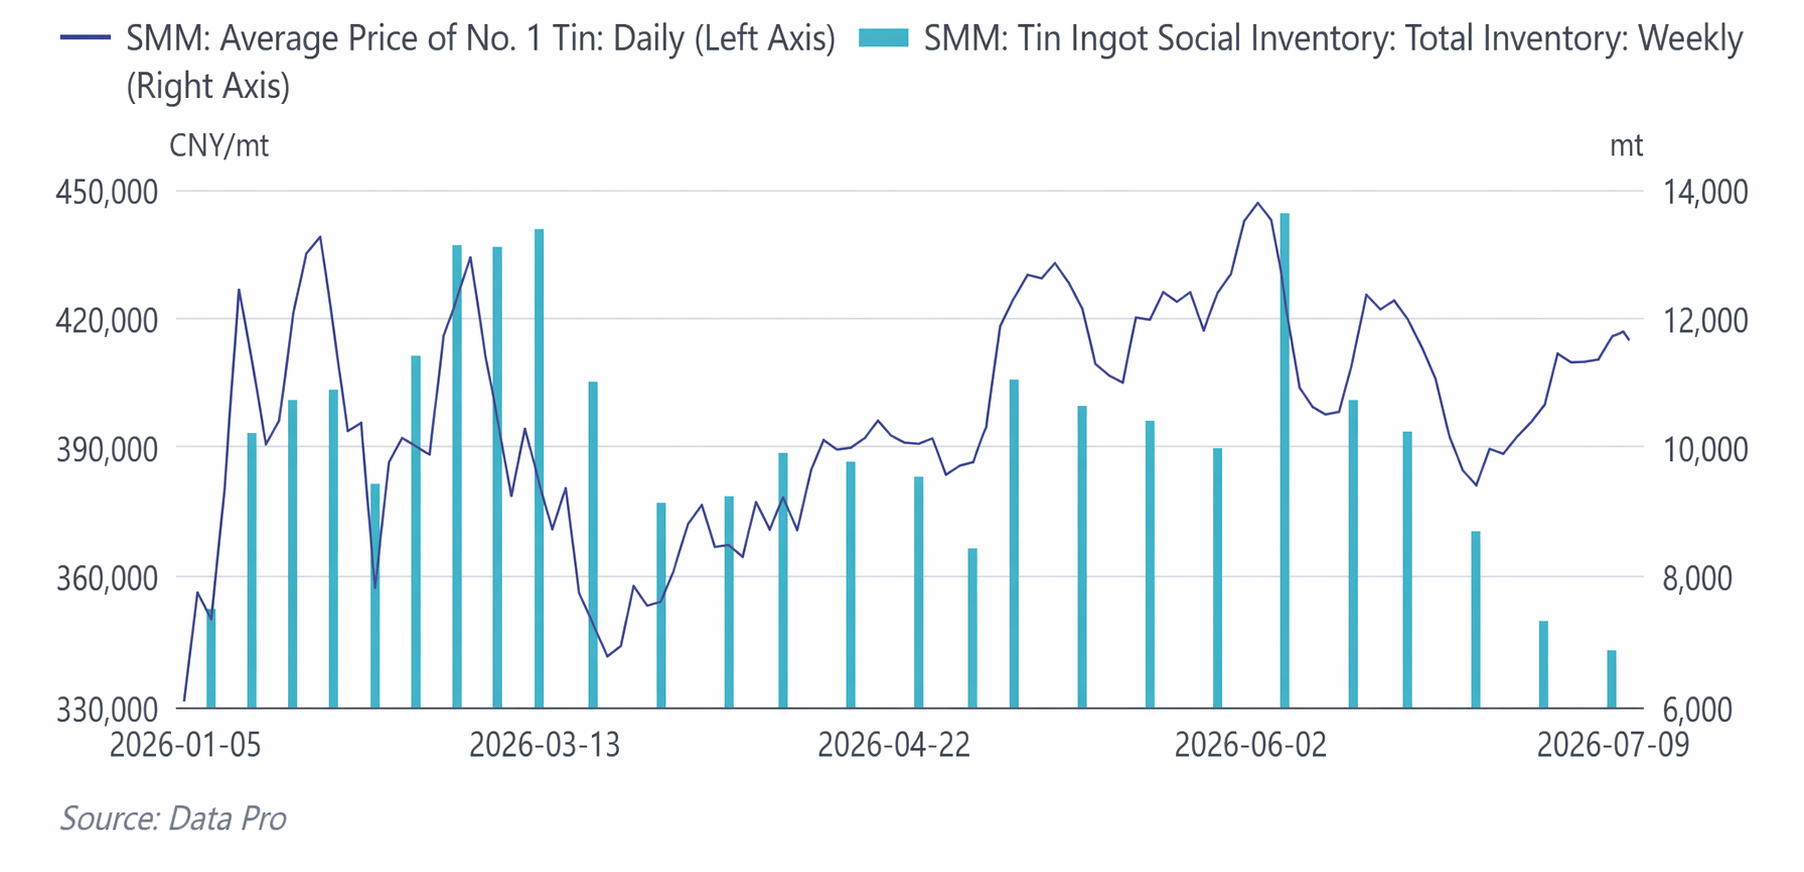
- Tín hiệu chính: Trong tháng 6, tỷ lệ vận hành của ngành hàn đi ngược xu hướng và leo lên 78,8%, trong khi giá thiếc nguyên liệu giảm từ mức cao 446.700 nhân dân tệ/tấn, làm tăng đáng kể thiện chí mua bắt đáy từ hạ nguồn. Điều này rất nhất quán với việc tồn kho xã hội thiếc thỏi giảm nhanh từ 13.604 tấn xuống 6.861 tấn trong cùng kỳ, xác nhận mối liên kết truyền dẫn trong chuỗi ngành 'điều chỉnh giá → tái dự trữ hạ nguồn → tiêu hóa tồn kho nhanh'.
V. Cảnh báo rủi ro và Dự báo giá thiếc nửa cuối năm 2026
Trong nửa cuối năm, giá thiếc dự kiến duy trì mô hình'cuộc chơi nguồn cung chi phối, AI khuếch đại độ co giãn, và tồn kho thấp làm nền tảng', với các trọng tâm chính: ① đẩy nhanh khôi phục sản xuất tại Bang Wa sau mùa mưa tháng 8; ② cường độ thực thi RKAB của Indonesia; ③ hướng dẫn chi tiêu vốn AI quý 3 (báo cáo thu nhập Microsoft/Google/Meta); ④ tình trạng sản xuất tại mỏ Bisie ở CHDC Congo; ⑤ liệu tồn kho khả kiến toàn cầu có tích lũy được hay không.
Phân tích theo kịch bản:
|
Kịch bản |
Điều kiện kích hoạt |
Biên độ giá thiếc LME (USD/tấn) |
Biên độ giá thiếc SHFE (vạn nhân dân tệ/tấn) |
|---|---|---|---|
|
Giảm giá |
Bang Wa đẩy nhanh khôi phục sản xuất + nới lỏng hạn ngạch Indonesia + hạ cấp chi tiêu vốn AI + diều hâu vĩ mô |
47.000—51.000 |
36—40 |
|
Trung tính(xác suất cao nhất) |
Bang Wa khôi phục sản xuất ôn hòa + AI duy trì tăng trưởng cao + tồn kho thấp |
50.000—56.000 |
38—44 |
|
Tăng giá |
Sau mùa mưa, Bang Wa tiếp tục trì hoãn + gián đoạn tại CHDC Congo + AI vượt kỳ vọng + tiêu hao tồn kho |
54.000—60.000 |
42—47 |
Về nhịp điệu, trong quý 3, ngay sau mùa mưa tại Bang Wa, dữ liệu khôi phục sản xuất sẽ được kiểm chứng dồn dập, khiến đây trở thành cửa sổ định giá quan trọng nhất trong năm; sang quý 4, bước vào chu kỳ ra mắt sản phẩm AI mới, trung tâm giá dự kiến sẽ kiểm tra lại các đỉnh nửa đầu năm. Từ góc độ bảng cân đối cả năm, SMM dự báo thâm hụt thiếc tinh luyện toàn cầu khoảng 5.100 tấn—cân bằng thắt chặt + tồn kho thấp + AI, logic định giá của thiếc đã chuyển từ “kẻ theo sau kim loại màu” sang “người dẫn đầu kim loại sức mạnh tính toán”.
![Không thể tăng vọt lên 430.000, đang chờ hướng neo kép của PCE ngày 26/8 và Wo Shi ngày 28/8 [SMM Tin Morning News]](https://imgqn.smm.cn/usercenter/bYFQn20251217171752.jpg)
![Hợp đồng thiếc được giao dịch nhiều nhất trên SHFE tiếp tục tích lũy, trong khi thị trường giao ngay chủ yếu là các đơn hàng nhỏ và mua sắm đúng lúc [SMM Tin Futures Review]](https://imgqn.smm.cn/usercenter/nBLhE20251217171750.jpg)