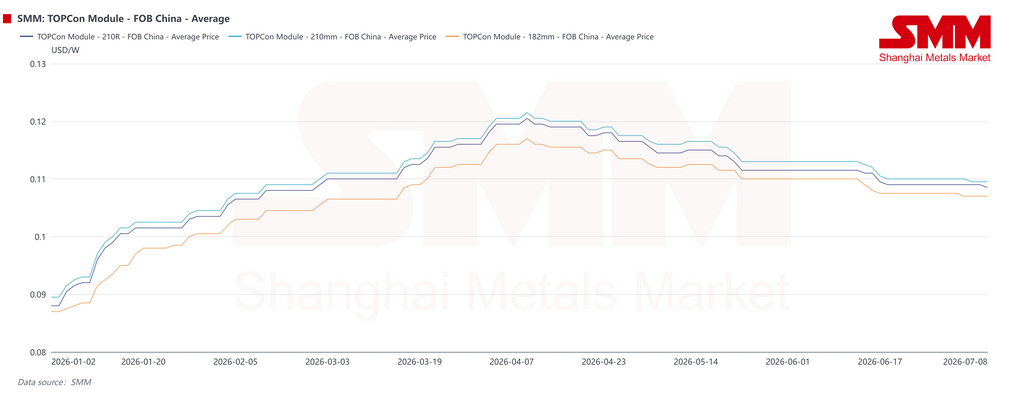
ตลาด PV ต่างประเทศเข้าสู่ช่วงรีเซ็ตที่ขับเคลื่อนด้วยนโยบาย หลังจากการเร่งดึงอุปสงค์ล่วงหน้าในครึ่งปีแรก การเปลี่ยนแปลงภาษีส่งออก ความผันผวนของค่าระวางเรือ ต้นทุนวัตถุดิบ และกำหนดเวลานโยบาย หนุนราคา FOB แผง TOPCon ของจีนในไตรมาสแรก ก่อนที่อุปสงค์ที่อ่อนแอลงจะดึงราคากลับมาที่ 0.108-0.112 ดอลลาร์สหรัฐฯ/วัตต์ภายในปลายเดือนมิถุนายน
บทวิเคราะห์ตลาด PV ต่างประเทศครึ่งแรกของปี 2026 โดย SMM
ตลาดโฟโตวอลเทอิกต่างประเทศในช่วงครึ่งแรกของปี 2026 มีลักษณะเด่นคือ การเร่งดึงอุปสงค์ล่วงหน้า ราคาที่ปรับขึ้นก่อนแล้วค่อยลดลง และอุปสรรคเชิงนโยบายที่เข้มงวดมากขึ้น ราคาส่งออก FOB แผง TOPCon ของจีนแข็งค่าขึ้นในไตรมาสแรก โดยได้แรงหนุนจากการเปลี่ยนผ่านมาตรการคืนภาษีส่งออก ต้นทุนแร่เงินและวัตถุดิบที่สูงขึ้น และการสร้างสต็อกสินค้าในต่างประเทศโดยผู้ผลิต
ในไตรมาสที่สอง แรงส่งดังกล่าวได้แผ่วลง เมื่อผลกระทบจากความผันปวนทางนโยบายบรรเทาลง และผู้ซื้อในต่างประเทศเต็มใจรับมอบแผงราคาสูงน้อยลง ศูนย์กลางราคาจึงปรับตัวลดลง ภายในสิ้นเดือนมิถุนายน ราคา FOB หลักทั่วไปทรงตัวเป็นส่วนใหญ่ที่ 0.108-0.112 ดอลลาร์สหรัฐฯ/วัตต์
ผลการดำเนินงานตามภูมิภาคแตกต่างกันอย่างมีนัยสำคัญ อินเดียมีการเร่งติดตั้งเป็นประวัติการณ์ก่อนบัญชีรายชื่อเซลล์ ALMM จะมีผลบังคับใช้ ยุโรปเคลื่อนผ่านวัฏจักรเต็มรูปแบบ ตั้งแต่การเร่งส่งออกและการเติมสต็อกคลังสินค้า ไปจนถึงแรงกดดันด้านสินค้าคงคลังที่เห็นได้ชัด อุปสงค์ในเอเชียตะวันออกเฉียงใต้ฟื้นตัวอย่างค่อยเป็นค่อยไปเมื่อราคาแผงปรับลดลง ขณะที่ปากีสถานเข้าสู่ช่วงการปรับโครงสร้าง หลังการเปลี่ยนแปลงนโยบายการรับซื้อไฟฟ้าส่วนเกิน (Net Metering) ในตะวันออกกลางและแอฟริกา ปัญหาความขัดแย้งทางภูมิรัฐศาสตร์กดดันการส่งมอบ แต่ท่อส่งโครงการของรัฐยังคงสนับสนุนอุปสงค์ระยะกลาง
SMM คาดการณ์ว่าการติดตั้ง PV ใหม่ในต่างประเทศจะปรับลดลงชั่วคราวสู่ราว 224 กิกะวัตต์ในปี 2026 ลดลงประมาณ 4% เมื่อเทียบกับปีก่อนหน้า ฐานการเติบโตระยะยาวยังคงไม่เปลี่ยนแปลง แต่ตลาดกำลังเคลื่อนเข้าสู่ช่วงที่ต้องเลือกสรรและขับเคลื่อนด้วยนโยบายมากขึ้น
ยุโรป: การเติมสต็อกหนุนในไตรมาส 1 แต่การตรวจสอบการปฏิบัติตามกฎระเบียบและราคาติดลบถ่วงในไตรมาส 2
ยุโรปเปลี่ยนจากการรับคำสั่งซื้ออย่างคึกคัก ไปสู่การย่อยสินค้าคงคลังในช่วงครึ่งแรก เมื่อต้นปี วันหยุดตามประเพณีทำให้การส่งออกแผงจากจีนชะลอตัว หลังจากช่วงหยุดยาว ซัพพลายเชนกลับมาดำเนินการ หน้าต่างมาตรการคืนภาษีส่งออกแคบลง และผู้ผลิตกระจุกตัวจัดส่งสินค้า ทำให้เกิดช่วงเร่งส่งออกอย่างชัดเจน
การรับคำสั่งซื้อและการสร้างสต็อกสินค้าในยุโรปค่อนข้างแข็งแกร่งในไตรมาส 1 ผู้ผลิตบางรายเพิ่มสต็อกคลังสินค้าในยุโรปไปพร้อมกัน ผลักดันให้สินค้าคงคลังในช่องทางจำหน่ายสูงขึ้น
อุปสงค์ยังคงยืดหยุ่นในเดือนมีนาคมและเมษายนโครงการระดับสาธารณูปโภคบางโครงการถึงกำหนดเส้นตายการเชื่อมต่อกริดในเดือนมีนาคม ขณะที่ข้อกำหนดวันที่เริ่มดำเนินการเชิงพาณิชย์และตารางการเชื่อมต่อกริดก่อนฤดูร้อนช่วยหนุนคำสั่งซื้อในเดือนเมษายน อย่างไรก็ตาม การจัดซื้อใหม่มุ่งเน้นที่การเติมสต็อกตามความจำเป็นและการส่งมอบโครงการมากกว่าอุปสงค์ใหม่ในวงกว้าง
ในช่วงปลายไตรมาสที่ 2 แรงกดดันด้านสินค้าคงคลังที่สะสมในไตรมาสที่ 1 ปรากฏชัดเจนยิ่งขึ้น ผู้ซื้อมีความระมัดระวังมากขึ้น และราคาไฟฟ้าติดลบที่เกิดขึ้นบ่อยครั้งในบางพื้นที่ของยุโรปส่งผลกระทบต่อความคาดหวังผลตอบแทนของโครงการระดับสาธารณูปโภค ราคาโมดูลปรับฐานลงจากระดับสูงสุดก่อนหน้านี้
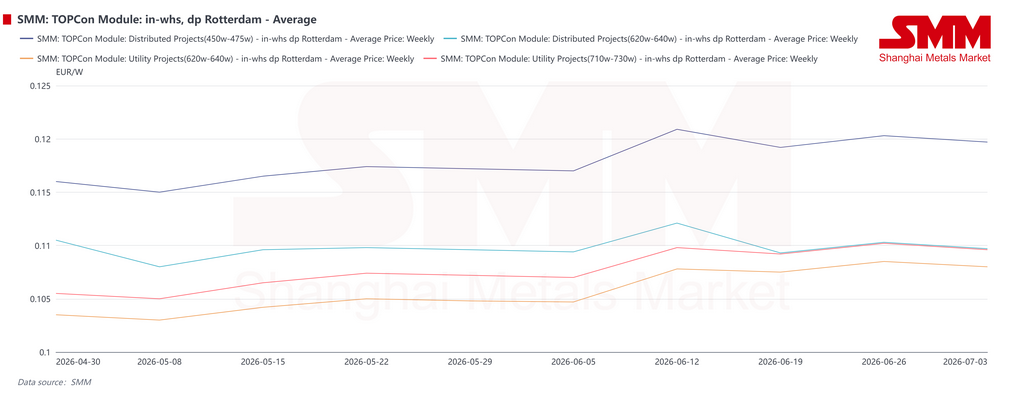
โครงการผลิตไฟฟ้าแบบกระจายศูนย์และโครงการเชิงพาณิชย์และอุตสาหกรรมมีผลงานที่ดีกว่าและช่วยหนุนอุปสงค์ได้บ้าง ในแง่การใช้งาน โมดูล TOPCon แบบกระจายศูนย์มีการปรับลดราคามากขึ้นเนื่องจากแรงกดดันจากราคาโมดูล BC ผลิตภัณฑ์ในช่วงกำลัง 450-475 วัตต์ ซึ่งรองรับอุปสงค์แบบกระจายศูนย์เฉพาะเป็นหลัก ยังคงรักษาราคาที่ค่อนข้างสูงกว่า
หลังเดือนพฤษภาคม การลดลงของราคาโมดูลในยุโรปค่อนข้างจำกัด ราคาก่อนหน้านี้ได้ปรับฐานลงแล้ว และผู้ผลิตไม่เต็มใจที่จะลดราคาลงมากอีก ในขณะเดียวกัน ค่าเงินยูโรที่อ่อนค่าลงเมื่อเทียบกับเงินหยวน และอัตราค่าขนส่งที่สูงขึ้นในเส้นทางไปยุโรปในช่วงปลายเดือนพฤษภาคม ทำให้ต้นทุนสินค้าถึงโกดังปรับตัวสูงขึ้นและเป็นปัจจัยหนุนราคาใหม่
ในช่วงกลางเดือนมิถุนายน แรงกดดันด้านการหมุนเวียนสินค้าคงคลังเพิ่มขึ้นที่ศูนย์กระจายสินค้าหลัก เช่น รอตเทอร์ดาม และราคารับสินค้าจากคลังสินค้าที่ชำระภาษีแล้วปรับตัวสูงขึ้นชั่วคราวในบางพื้นที่ อย่างไรก็ตาม เมื่อถึงสิ้นเดือน อุปสงค์ใหม่จากโครงการระดับสาธารณูปโภคที่จำกัดทำให้ผู้ผลิตโมดูลปรับลดข้อเสนออีกครั้งเพื่อแข่งขันแย่งคำสั่งซื้อ
ยุโรปก้าวเข้าสู่ช่วงชะลอตัวหลังหลายปีแห่งการขยายตัวอย่างรวดเร็ว
ตลาด PV ในยุโรปได้เปลี่ยนจากการขยายตัวอย่างรวดเร็วเข้าสู่ระยะชะลอตัวและปรับโครงสร้าง กำลังการติดตั้งใหม่เติบโตอย่างแข็งแกร่งในช่วงไม่กี่ปีที่ผ่านมา และขนาดตลาดโดยรวมขณะนี้อยู่ในระดับสูง รูปแบบการเติบโตกำลังเปลี่ยนจากการขยายปริมาณอย่างรวดเร็วไปสู่การปรับโครงสร้างให้เหมาะสม
ในระยะสั้น ยุโรปอาจเผชิญกับแรงกดดันในการปรับตัวจากการชะลอตัวของอุปสงค์ที่อยู่อาศัย ปัญหาคอขวดในการเชื่อมต่อกริด ราคาไฟฟ้าติดลบที่เกิดบ่อยขึ้น และการเปลี่ยนแปลงนโยบาย การเติบโตของกำลังการติดตั้งอาจชะลอตัวลงด้วยเหตุนี้
ในระยะกลางและระยะยาว ยุโรปยังคงมีศักยภาพในการเติบโต เป้าหมายการเปลี่ยนผ่านด้านพลังงาน การเพิ่มสัดส่วนของ PV แบบรวมอาคาร และการปรับใช้ระบบกักเก็บพลังงานที่ดีขึ้น น่าจะช่วยหนุนอุปสงค์ SMM คาดว่ากำลังการติดตั้งใหม่รายปีของยุโรปจะฟื้นตัวขึ้นไปอยู่ที่ประมาณ 70 กิกะวัตต์ภายในปี 2030
นโยบายกลายเป็นตัวแปรที่สำคัญที่สุดในครึ่งปีแรก ข้อจำกัดของสหภาพยุโรปต่ออินเวอร์เตอร์ที่เกี่ยวข้องกับ “ประเทศที่มีความเสี่ยงสูง” ขยายขอบเขตเพิ่มขึ้นไปยังระบบกักเก็บพลังงานแบตเตอรี่และระบบแปลงกำลังไฟฟ้าหลัก โครงการที่ได้แจ้งแล้วและมีความพร้อมเพียงพอจะต้องเข้าสู่สถานะการตัดสินใจอย่างเป็นทางการ การอนุมัติ หรือสถานะที่อนุมัติได้ ก่อนเดือนพฤศจิกายน 2569 เพื่อให้มีสิทธิ์ได้รับการปฏิบัติในช่วงเปลี่ยนผ่าน
ไตรมาส 4 จะเป็นหน้าต่างสำคัญในการกำหนดสถานะโครงการที่มีความพร้อม ในสถานการณ์ที่เข้มงวดที่สุด บางโครงการอาจต้องเปลี่ยนซัพพลายเออร์ เจรจาสัญญาใหม่ ปรับเปลี่ยนการเงิน หรือแม้แต่ล้มเหลวในการลงทุน ในระยะสั้น นโยบายนี้อาจกระตุ้นให้เจ้าของโครงการบางรายรีบล็อกสัญญาอุปกรณ์ล่วงหน้าเพื่อให้มีคุณสมบัติเป็นโครงการที่มีความพร้อม สร้างความต้องการเร่งด่วนชั่วคราว
ในเดือนมีนาคม 2569 สหภาพยุโรปได้เผยแพร่ข้อเสนอการเร่งรัดอุตสาหกรรมที่จะแนะนำข้อกำหนดการผลิตในท้องถิ่นสำหรับผลิตภัณฑ์พลังงานแสงอาทิตย์และกักเก็บพลังงานที่ได้รับทุนสาธารณะ ภายในสามปีหลังจากบังคับใช้ โครงการที่เข้าร่วมการจัดซื้อจัดจ้างภาครัฐหรือการประมูลจะต้องใช้อินเวอร์เตอร์และเซลล์ที่ผลิตในสหภาพยุโรป หากประเทศที่สามเพียงประเทศเดียวมีกำลังการผลิตเกินกว่าร้อยละ 40 ของกำลังการผลิตโลกสำหรับผลิตภัณฑ์ที่เกี่ยวข้อง ผลิตภัณฑ์นั้นจะต้องเผชิญกับข้อจำกัดการเข้าถึงตลาดที่เข้มงวดมากขึ้น
คณะกรรมการกำกับกิจการพลังงานของฝรั่งเศสได้เผยแพร่กฎในเดือนพฤษภาคมสำหรับการประมูลพลังงานแสงอาทิตย์แบบติดตั้งบนพื้นดินและระบบเกษตรโวลเทอิกรอบที่เก้า ด้วยขนาดรวมประมาณ 925 เมกะวัตต์ การประมูลครั้งนี้ได้แนะนำข้อกำหนดด้านความยืดหยุ่นของห่วงโซ่อุปทานที่สอดคล้องกับกฎหมายอุตสาหกรรมสุทธิเป็นศูนย์เป็นครั้งแรก แสดงให้เห็นว่าการประมูลพลังงานแสงอาทิตย์ของฝรั่งเศสกำลังเปลี่ยนจากการแข่งขันด้านราคาล้วนๆ ไปสู่กรอบที่ชั่งน้ำหนักราคา ความมั่นคงของห่วงโซ่อุปทาน และการปฏิบัติตามกฎระเบียบท้องถิ่น
ข้อกำหนดสมรรถนะพลังงานของอาคารของสหภาพยุโรปยังกำหนดให้ประเทศสมาชิกดำเนินการถ่ายโอนกฎหมายให้แล้วเสร็จก่อนวันที่ 29 พฤษภาคม 2569 ซึ่งเป็นการวางรากฐานนโยบายสำหรับอุปสงค์พลังงานแสงอาทิตย์บนอาคารตั้งแต่ปี 2570 แต่หากขอบเขตของผู้จัดหาอุปกรณ์ที่มีสิทธิ์แคบลงและต้นทุนโครงการเพิ่มขึ้น การเติบโตของพลังงานแสงอาทิตย์บนอาคารอาจเผชิญกับความขัดแย้งในการดำเนินการกับข้อจำกัดด้านอุปกรณ์
ในด้านการเงิน กลไกสนับสนุนพลังงานทดแทน FER X ของอิตาลี ซึ่งมีมูลค่าประมาณ 2.63 หมื่นล้านดอลลาร์สหรัฐ (2.3 หมื่นล้านยูโร) ได้รับการอนุมัติ รวมถึงการประมูลพลังงานแสงอาทิตย์ประมาณ 10 กิกะวัตต์ ธนาคารเพื่อการลงทุนยุโรปยังอนุมัติการเงินพลังงานสะอาดรอบใหม่เพื่อสนับสนุนการพัฒนาโครงการและการอัพเกรดโครงข่าย
อินเดีย: ALMM กระตุ้นการเร่งรีบเป็นประวัติการณ์ก่อนที่ตลาดจะเข้าสู่ช่วงการปรับตัว
อินเดียเป็นเซอร์ไพรส์ขาขึ้นที่ใหญ่ที่สุดในอุปสงค์ต่างประเทศในครึ่งปีแรก 2569การบังคับใช้ ALMM List-II สำหรับเซลล์ตั้งแต่วันที่ 1 มิถุนายน การประเมินการเชื่อมต่อโครงข่ายช่วงสิ้นปีงบประมาณ โครงการ PM Surya Ghar การพัฒนาโครงการโซลาร์เกษตร และการเร่งเชื่อมต่อก่อนที่การยกเว้นค่าธรรมเนียมสายส่งจะถูกปรับลดลง ล้วนช่วยหนุนการติดตั้ง
อินเดียเพิ่มกำลังการผลิต PV 14.4 กิกะวัตต์ในไตรมาสที่ 1 เกือบสองเท่าของช่วงเดียวกันของปีก่อนและเป็นสถิติสูงสุดในไตรมาสเดียว ภายในสิ้นเดือนมีนาคม 2026 กำลังการผลิตติดตั้ง PV สะสมได้ถึงประมาณ 152 กิกะวัตต์ โดยโครงการระดับสาธารณูปโภคคิดเป็น 85% ส่วน PV บนหลังคาคิดเป็น 15%
รัฐคุชราตและราชสถานร่วมกันคิดเป็นประมาณ 80% ของการเพิ่มกำลังการผลิตระดับสาธารณูปโภคในไตรมาสที่ 1 นับตั้งแต่เปิดตัวในปี 2024 โครงการ PM Surya Ghar ได้ขับเคลื่อนการติดตั้ง PV บนหลังคาเกือบ 10 กิกะวัตต์ เมื่อรวมกับโครงการ PM-KUSUM จะเป็นรากฐานเชิงนโยบายของความต้องการ PV แบบกระจายตัวของอินเดีย
ในด้านการดำเนินนโยบาย กระทรวงพลังงานใหม่และพลังงานหมุนเวียนของอินเดียระบุชัดเจนว่าจะไม่มีการขยายเวลาทั่วไปสำหรับ ALMM List-II โดยจะอนุมัติการยกเว้นเป็นรายกรณีสำหรับโครงการที่ได้ลงทุนไปแล้วอย่างมีนัยสำคัญเท่านั้น ช่วงเวลาในการยื่นขอขยายเวลาปิดลงเมื่อวันที่ 30 มิถุนายน
เมื่อมาตรการห้ามเริ่มมีผลบังคับใช้อย่างเป็นทางการ อุปสงค์ที่ถูกเร่งมาจากการจัดหาและเชื่อมต่อกริดก่อนกำหนดเริ่มปรากฏให้เห็น โมเมนตัมการติดตั้งในช่วงครึ่งปีหลังคาดว่าจะชะลอตัวลงอย่างมากจากครึ่งปีแรก อย่างไรก็ตาม ความต้องการเชื่อมต่อกริดช่วงสิ้นปีอาจยังช่วยหนุนการฟื้นตัวแบบค่อยเป็นค่อยไปในแต่ละเดือน
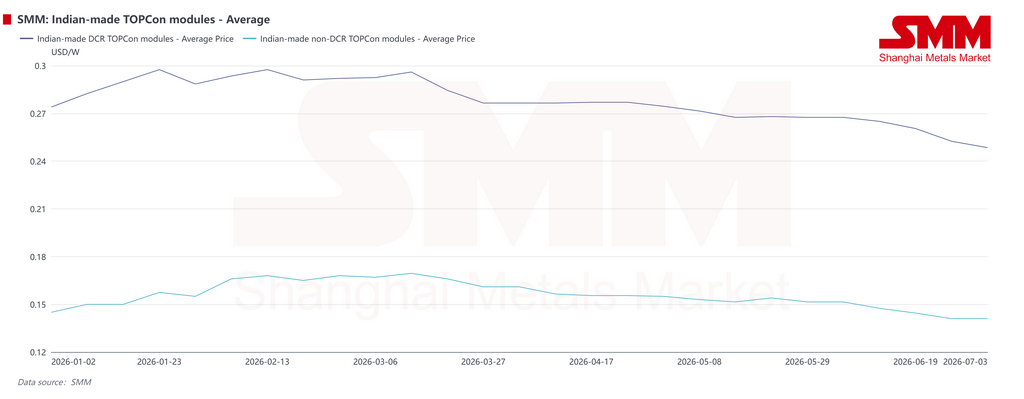
ตลาดโมดูลภายในประเทศของอินเดียกำลังแบ่งแยกเชิงโครงสร้างมากขึ้น โมดูลประเภท non-DCR มีสถานการณ์การใช้งานในประเทศที่แคบลง ทำให้ราคาลดลงมาที่ประมาณ 0.14 ดอลลาร์สหรัฐต่อวัตต์ โครงการที่เหลือที่ยังสามารถใช้โมดูล ALMM List-I ได้นั้นประมาณการว่ามีเพียงประมาณ 30 กิกะวัตต์ และส่วนใหญ่ต้องเชื่อมต่อกริดภายในสิ้นปี 2027 ผลิตภัณฑ์เหล่านี้อาจถูกดูดซับผ่านการส่งออกมากขึ้นในภายหลัง
โมดูล DCR ยังคงได้รับประโยชน์จากนโยบายและอุปสงค์จากโครงการภาครัฐที่เจาะจง อย่างไรก็ตาม กำลังการผลิตเซลล์ในประเทศที่จำกัดทำให้ต้นทุนโมดูลสูง เพิ่มต้นทุนพลังงานเฉลี่ยต่อหน่วยของโครงการ และบีบอัดผลตอบแทนการลงทุนของโรงไฟฟ้า ภายใต้แรงกดดันจากอุปสงค์ที่อ่อนตัวและต้นทุนที่สูง ราคาโมดูล DCR ก็ปรับตัวลดลงเช่นกัน
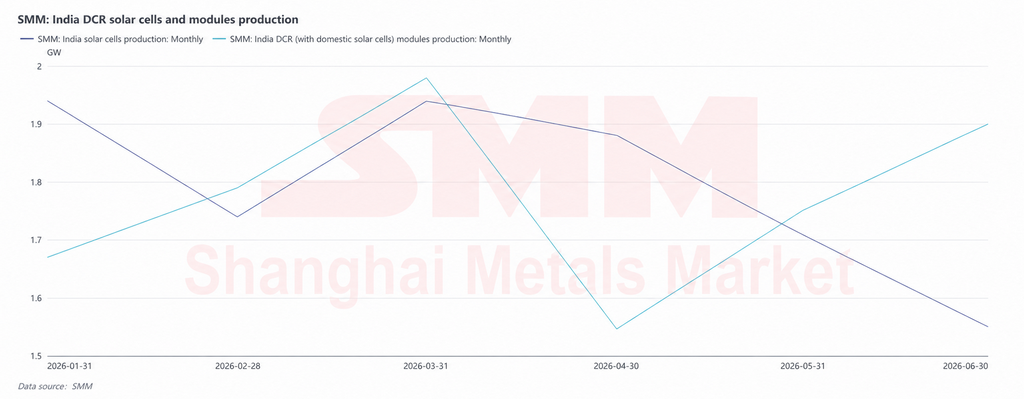
ข้อมูลจาก SMM แสดงให้เห็นว่ากำลังการผลิตโมดูล DCR ของอินเดีย ซึ่งรวมถึงเซลล์ที่ผลิตในประเทศ อยู่ที่ประมาณ 10.64 กิกะวัตต์ในครึ่งปีแรก กำลังการผลิตเซลล์ของอินเดียรวมประมาณ 10.76 กิกะวัตต์ ซึ่งใกล้เคียงกับกำลังการผลิตโมดูลในระดับเดียวกัน แม้ว่าผลผลิตรายเดือนจะแตกต่างกันก็ตาม
ในไตรมาส 1 ห่วงโซ่การผลิตในประเทศของอินเดียยังคงเดินเครื่องในอัตราสูง เนื่องจากมีการจัดซื้อล่วงหน้าก่อนรายการ ALMM List-II การประเมินการเชื่อมต่อโครงข่ายช่วงสิ้นปีงบประมาณ และโครงการที่ได้รับการสนับสนุนจากภาครัฐ ผลผลิตโมดูล DCR เพิ่มขึ้นสู่ 1.98 จิกะวัตต์ในเดือนมีนาคม ซึ่งเป็นจุดสูงสุดรายเดือนของครึ่งปีแรก
ในไตรมาส 2 ต้นทุนเซลล์ในประเทศที่สูงและส่วนต่างราคาของโมดูล DCR เมื่อเทียบกับผลิตภัณฑ์ที่ไม่ใช่ DCR ส่งผลให้การยอมรับของโครงการปลายทางลดลง การจัดส่งโมดูลชะลอตัวและส่งผลย้อนกลับไปยังการจัดตารางการผลิตเซลล์ต้นน้ำ ผลผลิตเซลล์ทรงตัวที่ 1.88 จิกะวัตต์ในเดือนเมษายน ก่อนลดลงเหลือ 1.71 จิกะวัตต์ในเดือนพฤษภาคม และ 1.55 จิกะวัตต์ในเดือนมิถุนายน สะท้อนถึงการดูดซับสินค้าคงคลังและการปรับคำสั่งซื้อหลังช่วงการผลิตสูงก่อนหน้านี้
ภาพรวม ภาคการผลิตของอินเดียในครึ่งปีแรกสะท้อนการปลดปล่อยชั่วคราวตามกำหนดเวลานโยบาย มากกว่าการขยายตัวของอุปสงค์ที่ยั่งยืน หลังจาก ALMM List-II มีผลบังคับใช้อย่างเป็นทางการวันที่ 1 มิถุนายน ความเชื่อมโยงระหว่างเสถียรภาพอุปทานเซลล์ในประเทศ ต้นทุนโมดูล DCR และผลตอบแทนโครงการจะแข็งแกร่งยิ่งขึ้น การจัดตารางโมดูลในครึ่งปีหลังคาดว่าจะปรับเปลี่ยนตามอุปทานเซลล์ในประเทศ ความคืบหน้าการยกเว้นโครงการ จังหวะการประมูลของภาครัฐ และอุปสงค์การเชื่อมต่อโครงข่ายปลายปี
ในระยะกลางถึงระยะยาว ข้อกำหนดการผลิตในประเทศของอินเดียจะเคลื่อนขึ้นสู่ต้นน้ำต่อไป ALMM List-III สำหรับแผ่นเวเฟอร์มีกำหนดมีผลบังคับใช้วันที่ 1 มิถุนายน ค.ศ. 2028 โครงการที่ครอบคลุมจะต้องเป็นไปตามข้อกำหนดการผลิตในประเทศแบบครบวงจรทั้งในส่วนของเซลล์และแผ่นเวเฟอร์ เนื่องจากอินเดียเริ่มวางแผนกำลังการผลิตเวเฟอร์ค่อนข้างเร็ว SMM คาดว่าผลกระทบที่แท้จริงจะจำกัด
แนวโน้มการติดตั้งระยะกลางของอินเดียยังมีปัจจัยหนุนจากเป้าหมายประมาณ 300 จิกะวัตต์ในปี ค.ศ. 2030 และนโยบายส่งเสริมการผลิตในประเทศที่ต่อเนื่อง
เอเชียแปซิฟิก: การนำเข้าแซงยุโรปในเดือนมีนาคม พร้อมปัจจัยขับเคลื่อนอุปสงค์ที่แตกต่าง
ตำแหน่งของเอเชียแปซิฟิกในแผนที่การส่งออกโมดูลของจีนปรับตัวสูงขึ้นอย่างเด่นชัดในครึ่งปีแรกของ ค.ศ. 2026 ในเดือนมีนาคม การส่งออกโมดูลของจีนแตะระดับสูงสุดรายเดือนที่ 35 จิกะวัตต์ เนื่องจากปริมาณการจัดส่งกระจุกตัวในช่วงหน้าต่างการคืนภาษี การนำเข้าของเอเชียแปซิฟิกแซงหน้ายุโรปเป็นครั้งแรก ทำให้ภูมิภาคนี้เป็นจุดหมายปลายทางการส่งออกโมดูลใหญ่ที่สุดของจีนในเดือนนั้น
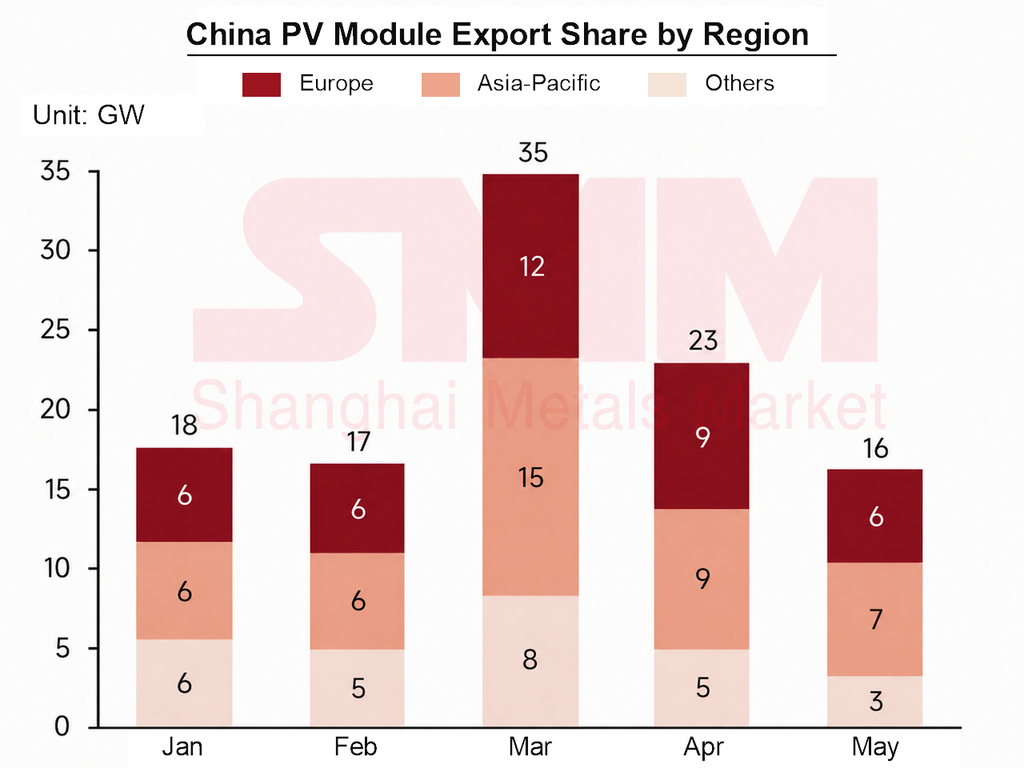
การเปลี่ยนแปลงเชิงโครงสร้างนี้สะท้อนถึงสินค้าคงคลังในช่องทางจัดจำหน่ายยุโรปที่สูง และการปรับสู่การเติมสต็อกแบบตายตัว ในขณะที่ตลาดเอเชียแปซิฟิกจำนวนมากยังคงนำเข้าตามแรงกดดันจากการเปลี่ยนผ่านด้านพลังงานและราคาไฟฟ้าปลายทางที่สูง โดยเอเชียแปซิฟิกไม่ได้เป็นเพียงช่องทางส่งออกซ้ำอีกต่อไปตลาดนี้กำลังกลายเป็นตลาดความต้องการปลายทางที่สำคัญ
ในภูมิภาคนี้ เอเชียตะวันออกเฉียงใต้และปากีสถานมีตรรกะความต้องการที่แตกต่างกัน เอเชียตะวันออกเฉียงใต้ขับเคลื่อนโดยการประมูล กำหนดเวลาโควตา และการจัดการนโยบายเป็นหลัก ส่วนปากีสถานขับเคลื่อนโดยเศรษฐศาสตร์ของโซลาร์แบบกระจายศูนย์และการเปลี่ยนแปลงกลไกการตั้งราคาค่าไฟฟ้ามากกว่า
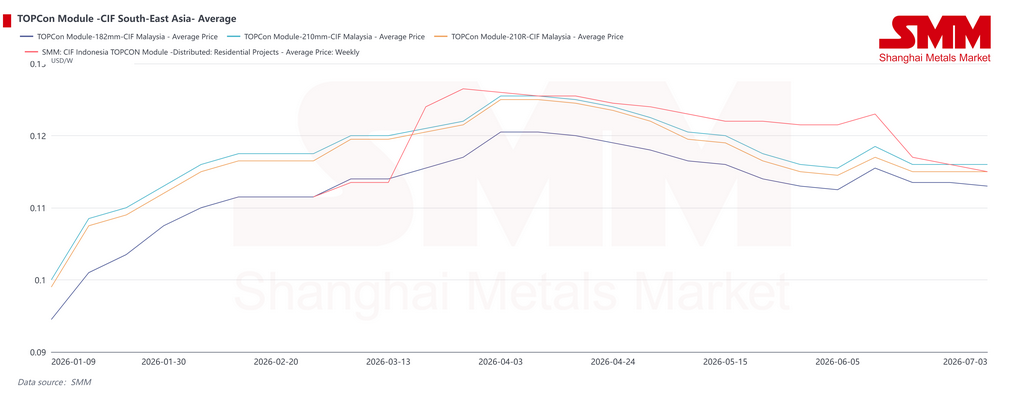
ในเอเชียตะวันออกเฉียงใต้ ราคาแผงโซลาร์แบบ CIF เพิ่มขึ้นในช่วงแรก เผชิญแรงกดดันในระดับสูงช่วงกลางของระยะเวลา แล้วจึงปรับตัวลดลง ทำให้การจัดซื้อบางส่วนกลับมาดำเนินต่อได้ การเพิ่มขึ้นของราคาในไตรมาส 1 เกิดจากต้นทุนเป็นหลัก ค่าระวางเรือปรับสูงขึ้นในช่วงตรุษจีน ขณะที่การกระจุกตัวของการจัดส่งในช่วงเวลาขอคืนภาษีส่งออกทำให้ความสามารถในการขนส่งตึงตัว และหนุนให้ราคาส่งมอบไปยังมาเลเซียและอินโดนีเซียสูงขึ้น
ในไตรมาส 2 เมื่อราคา CIF ลดลง ความต้องการบางส่วนที่ถูกเลื่อนเพราะราคาสูงเริ่มกลับมา ในช่วงกลางเดือนมิถุนายน ต้นทุนการขนส่งที่สูงขึ้นช่วยหนุนราคา CIF ชั่วคราว แต่ความต้องการปลายทางในต่างประเทศที่อ่อนแอจำกัดการปรับขึ้น ผู้ผลิตระดับสองลดราคาก่อนเพื่อปิดดีล และผู้ผลิตชั้นนำก็ดำเนินตามในภายหลังอย่างไม่มีทางเลือก ทำให้ราคาลดลงอีกครั้งในช่วงกลางถึงปลายเดือนมิถุนายน
เมื่อแยกตามตลาด มาเลเซียมีการสอบถามที่คึกคักมากขึ้นในช่วงปลายไตรมาส 2 เมื่อโครงการระดับสาธารณูปโภคบางส่วนเริ่มต้น หนุนให้ราคาค่อนข้างแข็งแกร่ง อินโดนีเซียได้ปล่อยความต้องการติดตั้งบางส่วนออกไปแล้วในครึ่งปีแรก ทำให้แรงผลักดันการจัดซื้อระยะสั้นอ่อนแอและราคาลดลงมากขึ้น ความต้องการของอินโดนีเซียจะเพิ่มขึ้นได้หรือไม่ในภายหลัง ขึ้นอยู่กับการจัดการโควตาล่าสุดในเดือนกรกฎาคมจากหน่วยงานด้านไฟฟ้า และความคืบหน้าของการประมูลโครงการที่รัฐบาลสนับสนุน
นโยบายในระดับภูมิภาคก็มีความคืบหน้าในช่วงครึ่งปีแรก กลไก Solar ATAP ของมาเลเซียเริ่มต้นอย่างเป็นทางการเมื่อวันที่ 1 มกราคม เปลี่ยนโซลาร์รูฟท็อปจากระบบวัดหน่วยไฟฟ้าสุทธิไปเป็นรูปแบบที่เน้นการใช้ไฟฟ้าเองเป็นหลัก เพดานการติดตั้งสำหรับภาคธุรกิจถูกปรับเพิ่มเป็น 100% ของความต้องการไฟฟ้าสูงสุด มาเลเซียยังเปิดตัวแผนเงินอุดหนุนโซลาร์สำหรับที่อยู่อาศัยในเดือนพฤษภาคม และประกาศในช่วงต้นเดือนมิถุนายนว่าโครงการโซลาร์ขนาดใหญ่รอบที่ 6 จะเปิดรับภายในปีนี้ โครงการในอนาคตจะต้องรวมระบบกักเก็บพลังงานด้วยแบตเตอรี่ ซึ่งแสดงให้เห็นว่าการพัฒนาโซลาร์ระดับสาธารณูปโภคกำลังเปลี่ยนจากโรงไฟฟ้าพลังงานแสงอาทิตย์แบบเดี่ยวไปเป็นระบบโซลาร์+กักเก็บพลังงาน
กฤษฎีกาฉบับใหม่ของเวียดนามมีผลบังคับใช้เมื่อวันที่ 26 มิถุนายน และผ่อนคลายข้อจำกัดการขายไฟฟ้าส่วนเกินสำหรับโซลาร์รูฟท็อปแบบใช้เอง ในบางกรณี อัตราส่วนการขายส่วนเกินเพิ่มขึ้นจาก 20% เป็น 50% ช่วยปรับปรุงความคาดหวังกระแสเงินสดสำหรับโครงการโซลาร์รูฟท็อปเชิงพาณิชย์และอุตสาหกรรม
สถาบันการลงทุนของรัฐอินโดนีเซียมีแผนลงทุนในการผลิตแผงเซลล์แสงอาทิตย์ เพื่อให้กำลังการผลิตในประเทศสามารถรองรับเป้าหมายพลังงานแสงอาทิตย์ 50 กิกะวัตต์ นอกจากนี้ยังส่งเสริมการจัดหาเงินทุนสำหรับโซลาร์เซลล์ในระดับหมู่บ้าน กัมพูชาลดภาษีนำเข้าสำหรับผลิตภัณฑ์เซลล์แสงอาทิตย์อย่างเป็นทางการ ขณะที่ฟิลิปปินส์เร่งดำเนินโครงการเซลล์แสงอาทิตย์ประมาณ 1.2 กิกะวัตต์
สถานการณ์การค้าเริ่มยากลำบากมากขึ้น การสอบสวนการทุ่มตลาดและภาษีตอบโต้การอุดหนุน (AD/CVD) ของสหรัฐฯ สำหรับเซลล์และแผงเซลล์แสงอาทิตย์ผลึกซิลิคอนจากอินเดีย อินโดนีเซีย และลาว ได้ออกคำวินิจฉัยเบื้องต้นเกี่ยวกับภาษีตอบโต้การอุดหนุนและการทุ่มตลาดในช่วงครึ่งปีแรก ประกอบกับข้อกล่าวหาการหลีกเลี่ยงกฎหมายที่เกี่ยวข้องกับการส่งออกผ่านเอธิโอเปีย ความเสี่ยงทางการค้ายังคงเพิ่มสูงขึ้นสำหรับเอเชียตะวันออกเฉียงใต้ในฐานะเส้นทางผ่านการส่งออกและฐานการผลิต สถานการณ์การใช้งานในต่างประเทศสำหรับกำลังการผลิตแผงเซลล์แสงอาทิตย์ในภูมิภาคกำลังค่อย ๆ แคบลง
ปากีสถาน: ระบบ Net Billing ผลักดันตลาดสู่การบริโภคเอง
ตัวแปรหลักในช่วงครึ่งปีแรกของปากีสถานคือการปรับพื้นฐานของการกำหนดราคาพลังงานแบบกระจายศูนย์ ในเดือนกุมภาพันธ์ NEPRA ได้ออกกฎเกณฑ์สำหรับผู้ผลิต-ผู้บริโภคปี 2026 โดยแทนที่กรอบการทำงาน Net Metering ที่ใช้มานานนับทศวรรษด้วย Net Billing ขณะนี้ระบบโครงข่ายไฟฟ้าซื้อไฟฟ้าส่วนเกินในราคาต้นทุนการซื้อไฟฟ้าเฉลี่ยของประเทศ และขายไฟฟ้าในอัตราค่าไฟฟ้าขายปลีก ซึ่งเป็นการยุติกลไกการหักลบแบบหนึ่งต่อหนึ่ง
สำหรับผู้ใช้ใหม่ อัตราค่าไฟฟ้าส่วนเกินที่รับซื้อลดลงจากประมาณ 0.09 ดอลลาร์/กิโลวัตต์ชั่วโมง (25 รูปี/กิโลวัตต์ชั่วโมง) เหลือประมาณ 0.029 ดอลลาร์/กิโลวัตต์ชั่วโมง (8 รูปี/กิโลวัตต์ชั่วโมง) ซึ่งลดลงมากกว่าสองในสาม ระยะเวลาสัญญายังถูกลดจากเจ็ดปีเป็นห้าปี ในเดือนเมษายน หน่วยงานกำกับดูแลได้แก้ไขกฎเพิ่มเติม โดยยืนยันว่าผู้ใช้เดิมจะคงการจัดเก็บค่าไฟฟ้าตามรูปแบบเดิมในช่วงอายุสัญญาที่มีผลบังคับใช้ แต่การขยายระบบจะไม่ได้รับสิทธิประโยชน์ด้านอัตราค่าไฟฟ้าเดิมอีกต่อไป
การเปลี่ยนแปลงกลไกนี้ไม่ได้เปลี่ยนแรงขับเคลื่อนพื้นฐานของตลาด ภายในต้นปี 2026 ปากีสถานนำเข้าแผงเซลล์แสงอาทิตย์จากจีนมากกว่า 51 กิกะวัตต์ เทียบกับน้อยกว่า 1 กิกะวัตต์ในปี 2018 นี่แสดงถึงการเปลี่ยนผ่านด้านพลังงานที่นำโดยผู้บริโภคที่รวดเร็วที่สุดเท่าที่มีการบันทึกไว้
ในปีงบประมาณล่าสุดเพียงปีเดียว การนำเข้าสูงถึง 18 กิกะวัตต์ และสถาบันการตลาดประมาณการว่ากำลังการผลิตติดตั้งจริงอาจอยู่ที่ประมาณ 33 กิกะวัตต์ทั่วประเทศแล้ว ตามตัวเลขทางการ กำลังการผลิตที่เชื่อมต่อกับโครงข่ายแบบ Net Metering อยู่ที่ประมาณ 7,000 เมกะวัตต์ โดยมีผู้ใช้ที่ลงทะเบียนประมาณ 466,000 รายระบบนอกกริดอีก 13,000-14,000 เมกะวัตต์ทำงานอย่างอิสระ
ราคาไฟฟ้าที่สูงและไฟฟ้าดับบ่อยครั้งยังคงเป็นปัจจัยหนุนพื้นฐานต่อความต้องการโซลาร์เซลล์ของปากีสถาน ในช่วงครึ่งปีแรก ความขัดแย้งระหว่างสหรัฐฯ-อิหร่านเพิ่มความเสี่ยงบริเวณช่องแคบฮอร์มุซและกดดันอุปทานพลังงานในภูมิภาค ยิ่งตอกย้ำคุณค่าของโซลาร์เซลล์แบบกระจายตัวในฐานะเครื่องมือป้องกันความมั่นคงด้านพลังงานของปากีสถาน
สำหรับผู้ส่งออกแผงโซลาร์เซลล์ ปากีสถานยังคงเป็นตลาดที่อ่อนไหวต่อราคาอย่างมาก ราคาต่ำมีให้เห็นบ่อยในช่วงครึ่งปีแรก และประเทศนี้เป็นหนึ่งในภูมิภาคหลักที่ผู้ผลิตแผงระดับรองลดราคาล่วงหน้าเพื่อแย่งคำสั่งซื้อ
เมื่อมองไปข้างหน้า ภายใต้ระบบการหักลบกลบหน่วย รายได้จากการส่งออกไฟฟ้าส่วนเกินจะลดลงอย่างรวดเร็ว โฟกัสของตลาดจะเปลี่ยนจากระบบที่เน้นส่งออกไปสู่การเพิ่มการใช้ไฟฟ้าด้วยตนเองสูงสุด สถานการณ์โหลดช่วงกลางวันของภาคพาณิชย์และอุตสาหกรรม รวมถึงระบบโซลาร์ร่วมกับแบตเตอรี่น่าจะมีเศรษฐศาสตร์ที่ดีขึ้น และความต้องการระบบกักเก็บพลังงานอาจกลายเป็นจุดเติบโตใหม่ อย่างไรก็ตาม ผลกระทบของนโยบายใหม่ต่อความเต็มใจติดตั้งโซลาร์ในบ้านเรือน และการเปลี่ยนความต้องการบางส่วนไปสู่ระบบนอกกริด ยังต้องจับตาในครึ่งปีหลัง
โดยรวมแล้ว การเติบโตของการติดตั้งในเอเชียแปซิฟิกได้รับการสนับสนุนจากเป้าหมายนโยบาย ความต้องการไฟฟ้าสะอาด และความคุ้มค่าทางเศรษฐศาสตร์ของโซลาร์แบบกระจายตัว แต่โครงการในเอเชียตะวันออกเฉียงใต้ยังคงเผชิญข้อจำกัดจากเงื่อนไขทางการเงิน การลงนามสัญญาซื้อขายไฟฟ้า การเชื่อมต่อโครงข่าย และประสิทธิภาพการอนุมัติ โครงสร้างพื้นฐานของโครงข่ายที่เสื่อมสภาพและความอิ่มตัวของกำลังการผลิตในประเทศเช่นเวียดนาม รวมถึงระบบโควตาติดตั้งที่เข้มงวดของอินโดนีเซีย จะยังคงจำกัดการเติบโตในระยะสั้น ปากีสถานยังคงต้องรับมือกับการเปลี่ยนแปลงโครงสร้างความต้องการที่เกิดจากการปฏิรูปค่าไฟฟ้า
การที่การนำเข้าของเอเชียแปซิฟิกจะยังคงสูงกว่ายุโรปต่อไปหรือไม่นั้นขึ้นอยู่กับการส่งมอบตามประมูลในเอเชียตะวันออกเฉียงใต้ในช่วงครึ่งปีหลัง และความยืดหยุ่นของความต้องการใช้ไฟฟ้าด้วยตนเองของปากีสถาน
ภูมิภาคตะวันออกกลางและแอฟริกา: ความปั่นป่วนทางภูมิรัฐศาสตร์ถ่วงการส่งมอบ แต่โครงการของรัฐหนุนการเติบโตระยะยาว
ในครึ่งปีแรก 2026 ภูมิภาคตะวันออกกลางและแอฟริกาได้รับผลกระทบทั้งจากความปั่นป่วนทางภูมิรัฐศาสตร์และความต้องการเปลี่ยนผ่านด้านพลังงาน ความขัดแย้งระหว่างสหรัฐฯ-อิหร่านและความเสี่ยงเป็นระยะๆ บริเวณช่องแคบฮอร์มุซได้ขัดขวางอุปทานแผงโซลาร์ในภูมิภาค โลจิสติกส์การขนส่งทางทะเล และกำหนดการส่งมอบโครงการ
ในช่วงกลางเดือนมิถุนายน ค่าขนส่งพุ่งสูงขึ้นชั่วคราวเป็นสองถึงสามเท่าของระดับก่อนหน้าค่าขนส่งสำหรับผลิตภัณฑ์พลังงานแสงอาทิตย์ที่ส่งไปยุโรปและตะวันออกกลางเพิ่มขึ้นประมาณ 2,000-3,000 ดอลลาร์สหรัฐต่อตู้คอนเทนเนอร์ไฮคิวบ์จากระดับก่อนหน้า โครงการในตะวันออกกลางบางแห่งที่เดิมกำหนดแล้วเสร็จก่อนฤดูร้อนต้องเลื่อนออกไป
เมื่อสถานการณ์คลี่คลายลงบ้าง ความต้องการด้านห่วงโซ่อุปทานที่ล่าช้าอาจถูกปลดปล่อยออกมา หากช่องแคบฮอร์มุซและเส้นทางเดินเรือโดยรอบยังคงเปิดอยู่ การจัดส่งแผงเซลล์แสงอาทิตย์ของจีนไปยังตะวันออกกลางก็อาจฟื้นตัวอย่างรวดเร็ว
แนวโน้มโครงการยังคงได้รับการสนับสนุนจากกลยุทธ์ด้านพลังงานตามอธิปไตย ซาอุดีอาระเบียประกาศรายชื่อผู้ผ่านคุณสมบัติในเดือนมกราคมสำหรับการประมูลรอบที่ 7 ของโครงการพลังงานทดแทนแห่งชาติ ครอบคลุมโครงการพลังงานแสงอาทิตย์ 4 โครงการ กำลังการผลิตรวมประมาณ 3.1 กิกะวัตต์ และโครงการพลังงานลม 2.2 กิกะวัตต์ ในเดือนเมษายน ซาอุดีอาระเบียเปิดการคัดเลือกเบื้องต้นสำหรับโครงการกักเก็บพลังงานอิสระชุดที่สอง กำลังการผลิตรวม 3 กิกะวัตต์/12 กิกะวัตต์-ชั่วโมง
การประมูล 6 รอบก่อนหน้านี้ได้มอบสัญญากำลังการผลิตพลังงานทดแทนมากกว่า 12.6 กิกะวัตต์ จากเป้าหมายพลังงานทดแทนของซาอุดีอาระเบีย 58.7 กิกะวัตต์ในปี 2030 นั้น 40 กิกะวัตต์เป็นพลังงานแสงอาทิตย์
โอมานเปิดการคัดเลือกเบื้องต้นสำหรับโครงการผู้ผลิตไฟฟ้าอิสระพลังงานแสงอาทิตย์ขนาด 1.5 กิกะวัตต์ในช่วงปลายเดือนมิถุนายน โดยบางโครงการรวมระบบกักเก็บพลังงาน แสดงให้เห็นว่าโครงการโซลาร์เซลล์แสงอาทิตย์ขนาดใหญ่ที่ผสมผสานการกักเก็บในตะวันออกกลางกำลังเร่งตัวขึ้น
ในแอฟริกา ธนาคารโลกอนุมัติเงิน 250 ล้านดอลลาร์สหรัฐในเดือนพฤษภาคมเพื่อสนับสนุนโครงการพลังงานในมาดากัสการ์ การเงินเพื่อการพัฒนาระหว่างประเทศยังคงปรับปรุงเงื่อนไขสำหรับโครงข่ายไฟฟ้า การจ่ายไฟนอกโครงข่าย และการบูรณาการพลังงานทดแทนทั่วแอฟริกา
ในโครงสร้างการติดตั้ง ตะวันออกกลางถูกครอบงำด้วยโรงไฟฟ้าพลังงานแสงอาทิตย์แบบติดตั้งบนพื้นดินขนาดใหญ่และโครงการโซลาร์เซลล์ผสมการกักเก็บ โดยซาอุดีอาระเบียและสหรัฐอาหรับเอมิเรตส์เป็นกำลังหลักที่เพิ่มขึ้น แอฟริกาผสมผสานระบบกระจาย ระบบนอกโครงข่าย และโครงการระดับสาธารณูปโภคบางส่วน ตลาดที่มีโครงสร้างพื้นฐานด้านโครงข่ายแข็งแกร่งกว่า เช่น อียิปต์ แอฟริกาใต้ และโมร็อกโก อยู่ในตำแหน่งที่ดีกว่าในการพัฒนาโครงการขนาดใหญ่
โรงไฟฟ้าขนาดใหญ่ที่ประมูลหรือลงนามในสัญญาซื้อขายไฟฟ้าไปก่อนหน้านี้ คาดว่าจะเข้าสู่ขั้นตอนการก่อสร้างที่เข้มข้นและการเชื่อมต่อโครงข่ายตั้งแต่ปี 2027 เป็นต้นไป ศูนย์กลางการติดตั้งของภูมิภาคอาจเพิ่มขึ้นอย่างมีนัยสำคัญ พลังงานแสงอาทิตย์จะยิ่งมีบทบาทมากขึ้นในการผลิตไฮโดรเจนสีเขียว การแยกเกลือออกจากน้ำทะเล และการลดคาร์บอนในภาระไฟฟ้าขนาดใหญ่
การส่งมอบโครงการระยะสั้นยังคงถูกจำกัดด้วยหลายปัจจัย รวมถึงความเสี่ยงทางภูมิรัฐศาสตร์ เสถียรภาพของเส้นทางเดินเรือ ต้นทุนทางการเงิน ความผันผวนของอัตราแลกเปลี่ยน ความน่าเชื่อถือด้านเครดิตของประเทศ และความสามารถในการชำระเงินของหน่วยงานสาธารณูปโภคด้านไฟฟ้าความแน่นอนในการเติบโตระยะปานกลางและระยะยาวของตะวันออกกลางและแอฟริกายังคงแข็งแกร่ง แต่การติดตั้งในระยะสั้นยังคงมีความไม่แน่นอนสูง
แนวโน้ม: อุปสงค์ในช่วงครึ่งปีหลังอาจฟื้นตัว แต่แรงกดดันด้านราคายังคงอยู่
โดยรวม ราคาและอุปสงค์ของเซลล์แสงอาทิตย์ในต่างประเทศช่วงครึ่งแรกของปี 2026 ถูกขับเคลื่อนจากกรอบเวลานโยบาย การหยุดชะงักของต้นทุน และกำหนดส่งมอบโครงการในแต่ละภูมิภาค มากกว่าการปรับตัวดีขึ้นอย่างครอบคลุมของอุปสงค์ปลายทาง ราคาโมดูลที่เพิ่มขึ้นในไตรมาสแรกได้รับการหนุนจากการเปลี่ยนผ่านการคืนภาษีส่งออก การเร่งส่งออกและการสะสมสต็อก ต้นทุนค่าระวางที่สูงขึ้น และกลยุทธ์การพยุงราคาของผู้ผลิต
ในไตรมาสที่สอง เมื่อการหยุดชะงักของนโยบายคลี่คลายลง ตลาดกลับสู่การกำหนดราคาตามอุปสงค์ ผู้ผลิตทยอยลดราคาเพื่อปิดคำสั่งซื้อภายใต้แรงกดดันการส่งมอบครึ่งปี และจุดศูนย์กลางราคาโมดูลปรับตัวลดลง
ความแตกต่างในแต่ละภูมิภาคเป็นลักษณะโครงสร้างที่เด่นชัดที่สุดของครึ่งปีแรก การเร่งติดตั้งที่ขับเคลื่อนด้วยนโยบายของอินเดียดึงอุปสงค์ส่วนหนึ่งของครึ่งปีหลังมาใช้ก่อน ยุโรปเผชิญทั้งการระบายสต็อกและการตรวจสอบการปฏิบัติตามกฎระเบียบ โดยโครงการขนาดสาธารณูปโภคยังคงได้รับผลกระทบจากราคาไฟฟ้าติดลบและข้อจำกัดการเชื่อมต่อโครงข่าย เอเชียตะวันออกเฉียงใต้ยังคงรอให้การประมูล การจัดสรรโควตา และโครงการที่รัฐหนุนหลังให้เกิดผลเป็นรูปธรรม ปากีสถานเข้าสู่ระยะการปรับโครงสร้างอุปสงค์หลังการปฏิรูปค่าไฟฟ้า ตะวันออกกลางและแอฟริกาเผชิญการหยุดชะงักของการส่งมอบระยะสั้นจากภูมิรัฐศาสตร์และตารางการเดินเรือ แต่แผนงานโครงการของรัฐในระยะกลางยังคงสนับสนุนอยู่
ในครึ่งปีหลัง การเชื่อมต่อโครงข่ายเซลล์แสงอาทิตย์ในต่างประเทศอาจลดลงชั่วคราวในเดือนกรกฎาคมและสิงหาคม เนื่องจากการหยุดพักร้อน อุณหภูมิสูง และการก่อสร้างโครงการที่ชะลอตัวในบางภูมิภาค โดยคาดว่าอุปสงค์จะฟื้นตัวตั้งแต่เดือนกันยายน เมื่อสิ้นสุดวันหยุด การก่อสร้างโครงการกลับมาดำเนินการ และผลการประมูล การจัดสรรโควตา และการยกเว้นนโยบายทยอยนำไปปฏิบัติ อุปสงค์ในไตรมาสที่สี่ควรปรับตัวดีขึ้นภายใต้การประเมินการเชื่อมต่อโครงข่ายสิ้นปีและกำหนดเส้นตายของนโยบาย
อย่างไรก็ตาม การรับคำสั่งซื้อโดยรวมยังคงมีแนวโน้มอยู่ภายใต้แรงกดดัน อุปสงค์บางส่วนถูกดึงมาใช้ล่วงหน้าแล้วในครึ่งปีแรก สต็อกในต่างประเทศยังต้องถูกระบายออก อินเดียกำลังเข้าสู่ระยะปรับตัวทางนโยบาย โครงการในตลาดเกิดใหม่บางแห่งยังคงเปลี่ยนจากการวางแผนไปสู่การดำเนินการได้ช้า
ตัวแปรสำคัญที่ต้องติดตามรวมถึงการรับรองโครงการที่เติบโตเต็มที่ของสหภาพยุโรปก่อนเส้นตายที่เกี่ยวข้องกับอินเวอร์เตอร์ในเดือนพฤศจิกายน ทิศทางการแก้ไขกฎความปลอดภัยทางไซเบอร์ที่เกี่ยวข้อง การบังคับใช้ ALMM ของอินเดียและการปล่อยกำลังการผลิตเซลล์ในประเทศ การจัดสรรโควตาและการประมูลโครงการของรัฐในอินโดนีเซียในไตรมาสที่สาม สถานการณ์ในตะวันออกกลางและเสถียรภาพการสัญจรในช่องแคบฮอร์มุซ และการส่งผ่านการเปลี่ยนแปลงของค่าระวางและอัตราแลกเปลี่ยนไปยังต้นทุนสินค้าถึงมือ
ด้านราคา ราคาโมดูลส่งออกของจีนคาดว่าจะยังคงอยู่ภายใต้แรงกดดัน เนื่องจากแรงกดดันด้านต้นทุนโมดูลผ่อนคลายลง การฟื้นตัวของอุปสงค์ปลายทางในต่างประเทศยังคงจำกัด และผู้ผลิตยังคงเผชิญแรงกดดันด้านการจัดส่ง ในขณะเดียวกัน การแข็งค่าของเงินหยวนเมื่อเทียบกับดอลลาร์สหรัฐและยูโรในช่วงครึ่งแรกของปี 2026 บีบอัดกำไรจากอัตราแลกเปลี่ยนและอัตรากำไรของผู้ส่งออก ผู้ผลิตบางรายมีความเต็มใจจำกัดในการลดราคาครั้งใหญ่อีกครั้ง ซึ่งน่าจะให้การสนับสนุนบางส่วนแก่ข้อเสนอส่งออก SMM คาดว่าราคาโมดูลส่งออกของจีนในช่วงครึ่งหลังของปี 2026 จะเคลื่อนไหวในช่วงแคบภายใต้แรงกดดัน โดยจุดศูนย์กลางราคายังคงเผชิญความเสี่ยงขาลง
เขียนโดย:
Ryan Tey Tze Yang | นักวิเคราะห์ PV SMM
+60 127179370 | ryan.tey@metal.com
![[SMM PV News] ที่ระดับความสูง 4,700 เมตร! โครงการพลังงานแสงอาทิตย์ที่ใหญ่ที่สุดในบริเวณตอนกลางและตอนล่างของแม่น้ำยาร์ลุงซังโปในทิเบตได้สร้างเสร็จสมบูรณ์แล้ว](https://imgqn.smm.cn/usercenter/rnXTf20251217171741.jpg)
![[SMM PV News] กระทรวงพลังงานสหรัฐฯ (DOE) ลงทุน 12 ล้านดอลลาร์เพื่อพัฒนาเทคโนโลยีโซลาร์เซลล์สำหรับอวกาศ](https://imgqn.smm.cn/usercenter/ZbnfH20251217171741.jpg)
![[SMM PV News] สร้างมาตรฐานยุโรป | โครงการระบบติดตามแสงอาทิตย์ 221 เมกะวัตต์ของ Chiko Solar Energy ในอิตาลีเปิดตัวอย่างเป็นทางการ](https://imgqn.smm.cn/usercenter/GOtTW20251217171740.jpg)