I. H1 Market Summary
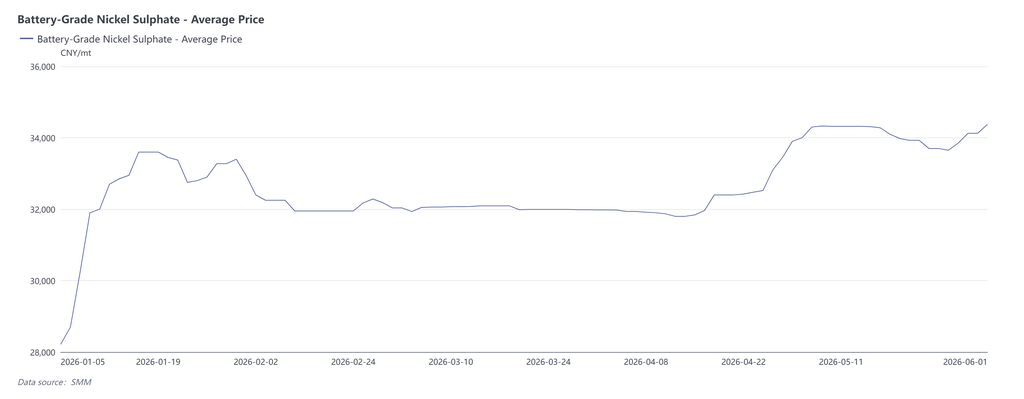
In H1 2026, the nickel salt (nickel sulphate) market experienced wild swings of "two rallies and two pullbacks," with price movements dominated by a pattern of cost support and demand-side drive. From an H1 perspective, the market can be divided into three distinct phases:
Phase 1: Weak Consolidation Under Cost Support, January-March
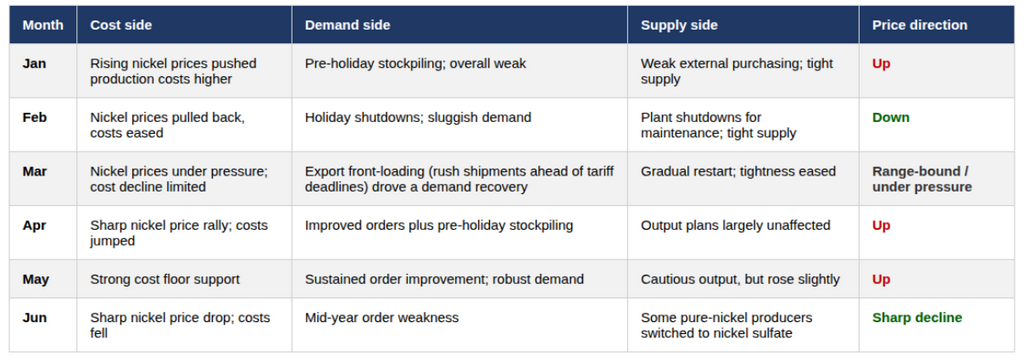
In January, nickel prices surged sharply, pushing costs higher and causing nickel salt prices to rise; from February to March, nickel prices pulled back and costs declined, coupled with persistently weak downstream demand, nickel salt prices fell under pressure. During this phase, the cost side was dominant, while the demand side continued to exert downward pressure.
Phase 2: Upward Resonance of Cost and Demand, April-May
In April, nickel prices climbed significantly, and expectations for intermediate product production cuts pushed up the coefficient, leading to a notable rise in costs; meanwhile, China's domestic demand improved beyond expectations, export orders recovered, and downstream purchasing sentiment bounced back. Driven by both cost and demand, nickel salt prices gained strong upward momentum.
Phase 3: Dual Suppression from Weakening Cost and Demand, June
In June, US economic data fueled interest rate hike expectations, compounded by nickel's own inventory buildup and weak fundamentals, nickel prices plummeted, and cost support weakened markedly; at the same time, downstream orders weakened during the mid-year period, and purchasing demand declined. With both cost and demand weakening, nickel salt prices fell sharply, giving back some of the gains from Q2.
A further review of costs and the supply-demand side will be provided below:
II. Cost Side: Intermediate Product Payables Game Dominated by Nickel Prices
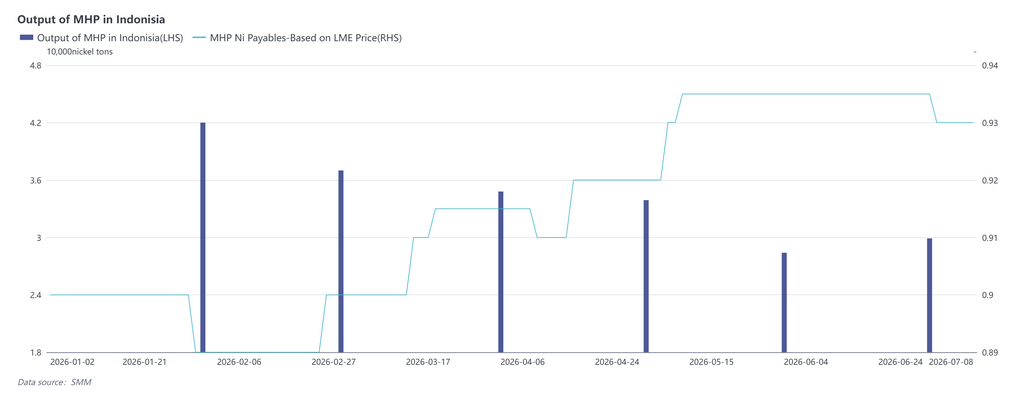
Tight supply of intermediate products remained the main theme throughout H1. MHP payables weakened slightly from January to February as downstream acceptance of high coefficients was low but then rose steadily from March, driven by disruptions such as landslides at industrial parks in Indonesia and expectations of tight sulfur supply. After production cuts caused by sulfur were gradually realized from April to May, payables stayed strong until June, when they pulled back somewhat as production schedules for certain intermediate product projects rebounded. High-grade nickel matte payables stayed high throughout the period, indicating that the tight availability of externally sold high-grade nickel matte did not ease substantively in H1.
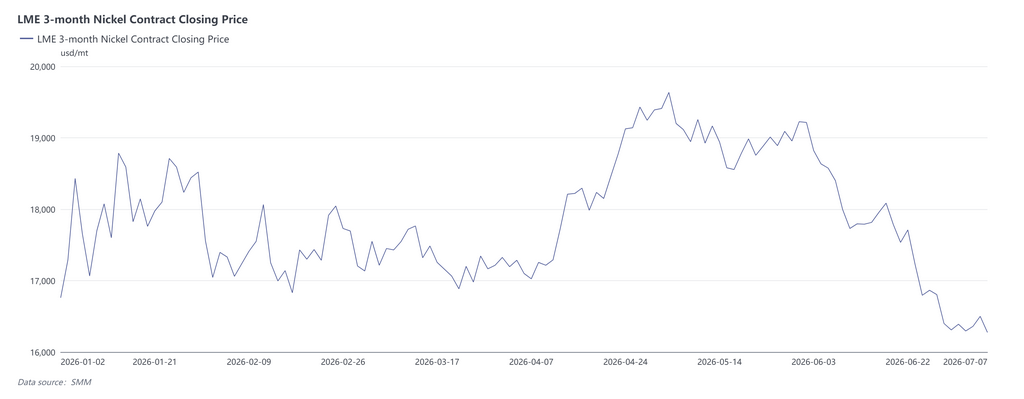
Nickel prices were the core variable driving fluctuations on the cost side, tracing a pattern of surging twice and pulling back twice in H1. In January, nickel prices surged sharply, propelled by expectations for Indonesia’s nickel ore quota policy and the high sentiment in commodity markets fuelled by expectations of loose liquidity. In February, prices dropped on expectations of liquidity tightening after the US Fed’s leadership change. In March, they fell further under pressure as the Middle East situation pushed up the US dollar and oil prices. In April, Indonesia’s revision of the HPM formula and expectations for intermediate product production cuts drove a sharp rise in nickel prices. After the holidays in May, nickel prices pulled back temporarily as US-Iran tensions eased, but high hydrometallurgical costs and intermediate product production cuts provided strong floor support. In June, prices plunged under the dual weight of US economic data reinforcing expectations for interest rate hikes and persistent inventory buildup in nickel’s own fundamentals.
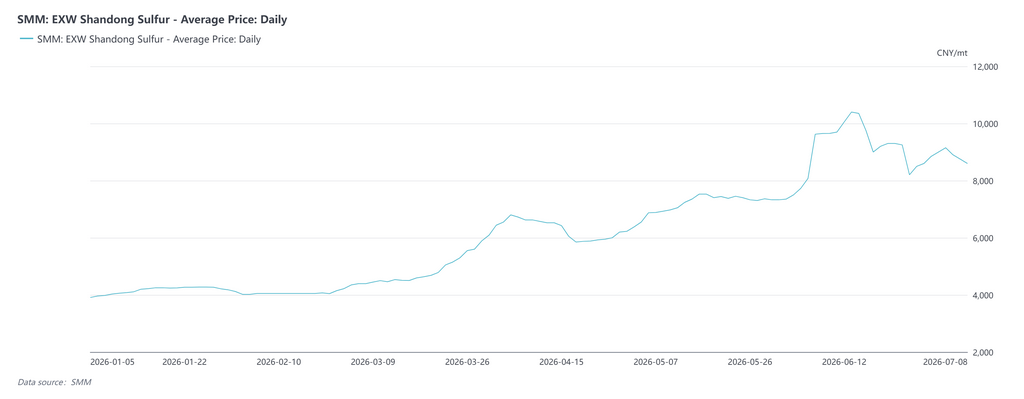
Sulphuric acid provided additional support to the cost curve from the auxiliary material side. The sharp rise in sulfur and sulphuric acid prices triggered by the Middle East situation this year has significantly lifted overall processing costs for nickel sulphate. According to SMM data, China’s spot sulfur transaction price once exceeded 10,000 yuan per mt, and Indonesia’s sulfur price once hit a high of $1,250-1,300 per mt. Against this backdrop, the price of sulphuric acid per mt has roughly doubled from the beginning of the year. Taking the processing of nickel sulphate from MHP as an example, the theoretical processing cost per mt in metal content has risen by more than 3,000 yuan from the start of the year, putting pressure on nickel sulphate producers.
III. Demand Side: Alternating Dynamics of Seasonal Weakness and Order Recovery
In H1, the demand side displayed a clear "seasonal switch" pattern:
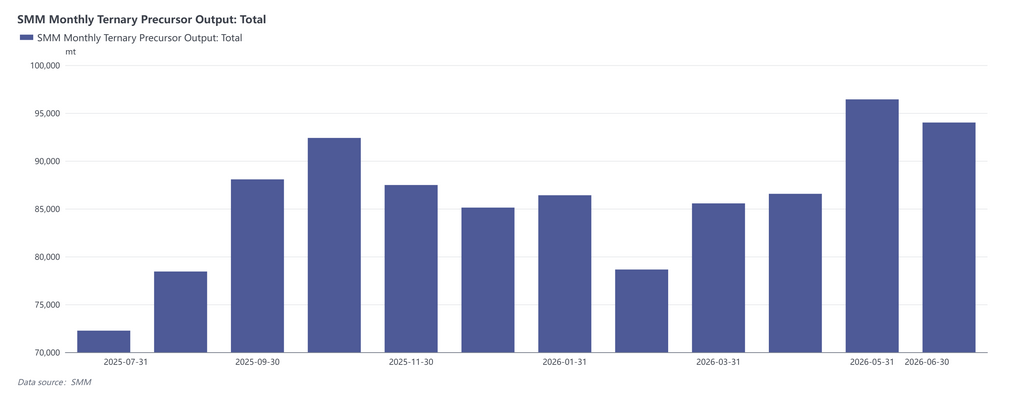
• January-February (Chinese New Year off-season): Downstream enterprises saw generally weak raw material procurement demand due to inventory accumulated at the end of last year combined with maintenance plans during the Chinese New Year shutdowns. Logistics suspensions further suppressed the procurement pace, driving a continuous decline in acceptance of high-priced nickel salts.
• March (gradual recovery): After the holiday, downstream enterprises gradually resumed production. The cancellation of export tax rebates further stimulated export orders for some enterprises, and acceptance of nickel salt prices steadily recovered.
• April-May (sustained order improvement): Domestic downstream orders continued to improve, and top-tier players performed well in export orders. This, together with the concentrated release of Labour Day holiday stockpiling demand, significantly amplified nickel salt procurement demand, becoming a key support for the price rise.
• June (mid-year weakening): At the mid-year period, some downstream enterprises saw their domestic orders weaken, and procurement demand subsequently declined, markedly weakening the demand-side support.
IV. Supply Side: Cautious Expansion Constrained by Intermediate Products
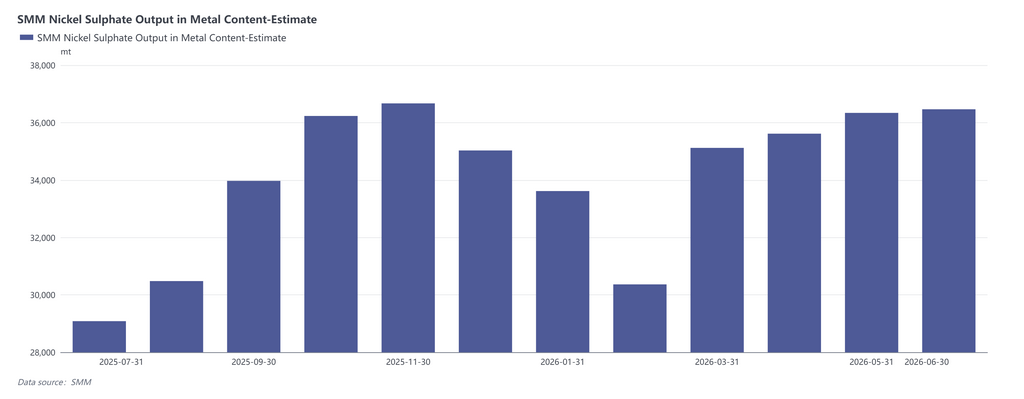
In H1, the overall supply of nickel sulphate was constrained by tight intermediate product supply, yet production still trended upward, driven by demand: In January-February, sellable supply tightened due to weak downstream external purchase demand and Chinese New Year maintenance shutdowns; from March, supply improved marginally as salt plants successively resumed production; in April, despite expectations for intermediate product production cuts, salt plant production schedules were not yet significantly affected, and supply still edged up, driven by demand; in May; in June, some refined nickel enterprises switched to producing nickel sulphate for external sales, driving a further slight increase in supply. However, the overall supply-demand pattern had yet to shift to a notable surplus.
V.Monthly Supply-Demand Pattern Summary
VI. Conclusion and Outlook
Overall, the nickel sulphate price trend in H1 was fundamentally a cost-driven market: changes in nickel prices and intermediate product payables dictated directional price fluctuations, while seasonal demand strength determined the speed and magnitude of cost transmission to end-user prices. In H2 2026, intermediate product supply is expected to loosen, and coupled with expectations that weak forward nickel fundamentals will keep prices in the doldrums, cost support for nickel salt production will gradually weaken. From the downstream demand perspective, the cancellation of tax rebates and incremental downstream demand jointly stimulate ternary cathode precursor production schedules, and nickel sulphate consumption is expected to stay high. On the supply side, after intermediate product supply loosens in H2, nickel salt supply elasticity is expected to strengthen; on the supply side, as intermediate product production gradually recovers, nickel salt supply elasticity is expected to improve somewhat, while sales volumes from refined nickel producers can also provide incremental supply. Therefore, the supply-demand tightness in nickel sulphate is expected to improve in H2 compared to Q2. After cost support weakens, although a temporary rebound may occur during the September-October peak season, overall prices will trend downward relative to H1.

![[SMM Stainless Steel Flash] CBAM Expansion to Everyday Products: EU Cost Wave Looms for SMEs and Consumers](https://imgqn.smm.cn/usercenter/LNpBh20251217171732.jpeg)
![[SMM Stainless Steel Flash] Turkey Launches Sunset Review of AD Duties on Stainless Steel Products from Vietnam](https://imgqn.smm.cn/usercenter/JjbtE20251217171732.jpeg)