Executive Summary (Conclusion-First)
Based on the full annual data from 2022 to 2025 and the latest export details for January–April 2026 (covering full-dimensional data including export value, tonnage, average unit price, exporting provinces, and destination markets), Canada’s sulfur export industry presents five core characteristics: cyclical recovery and upward momentum, simultaneous surge in volume and price, highly concentrated production origins, extreme market stratification, and distinct price differentials across regions. All conclusions are supported by authoritative official statistics.
1. Industry Cycle: Bottom reversal and continuous growth, hitting a new historical high expected in 2026. The industry experienced a sustained downturn from 2022 to 2024, with export value, tonnage, and unit price declining year by year and bottoming out in 2024. A strong industry reversal occurred in 2025, with both export volume and price jumping to a multi-year peak. The explosive growth continued in 2026: export value and average unit price rose sharply in the first four months. The annualized export tonnage is estimated to reach 5.22 million tons, pointing to a new full-year export record.
2. Production Pattern: Dual-province absolute monopoly with highly concentrated industrial resources. Over 95% of Canada’s total sulfur exports are contributed by Alberta and British Columbia. Alberta acts as the absolute core production region, accounting for more than 70% of exports for both major sulfur products. British Columbia serves as the secondary core region with a stable export share of 23%–25%. All other provinces hold negligible export shares with no substantive market influence.
3. Market Pattern: Dominated by top four destinations with extreme regional differentiation. The United States, Indonesia, China, and Australia are the four core export destinations, jointly capturing 73.6% of total export tonnage and forming a highly concentrated market structure. The U.S. is the largest rigid-demand market; Indonesia represents a low-price incremental market; China and Australia are stable mid-to-high value markets; and Africa constitutes a niche high-premium high-end market.
4. Price Trend: Unit price nearly doubled with significant regional and product-specific price gaps. The industry average unit price has skyrocketed since bottoming out in 2024, with the average price of mainstream sulfur products in the first four months of 2026 nearly double the 2022 level. Market stratification is evident: Africa records the highest average unit price while Indonesia has the lowest among major markets. The U.S. shows multiple-fold price differences driven by product specification gaps. The traditional high-value sublimed/colloidal sulfur segment has practically exited the global market.
5. Product Iteration: Shrinkage of high-end niche products, mainstream products dominating industrial growth. Sublimed/colloidal sulfur, once a high-value product with an average price exceeding USD 5,000 per ton, has witnessed continuous output shrinkage. Only negligible export volume was recorded in January–April 2026, resulting in zero contribution to the high-end market. The industry’s growth is now fully driven by two mainstream products: crude sulfur and other sulfur.
I. Review of Historical Export Volume & Value: A Four-Year Cycle and Super Boom in 2025–2026
This statistical analysis covers three Canadian sulfur HS code categories: HS 2503.00.10 (crude sulfur), HS 2503.00.90 (other sulfur), and HS 2802.00.00 (sublimed/colloidal sulfur). By integrating full-year data from 2022 to 2025 and phased data for January–April 2026 across three core dimensions—export value, tonnage, and weighted average unit price—the complete cyclical trend of the industry is fully restored.
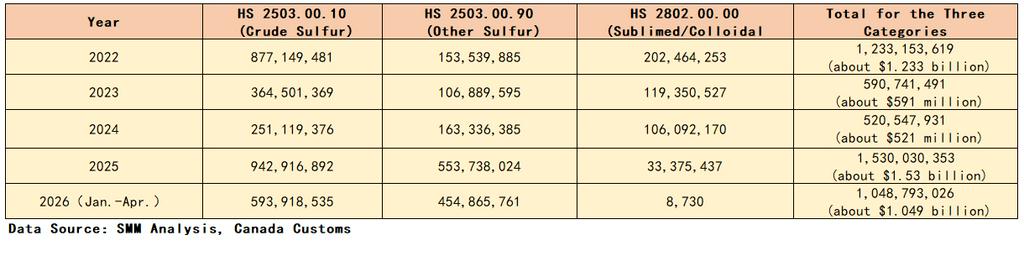
1.1 Annual Export Value Trend (Unit: USD)
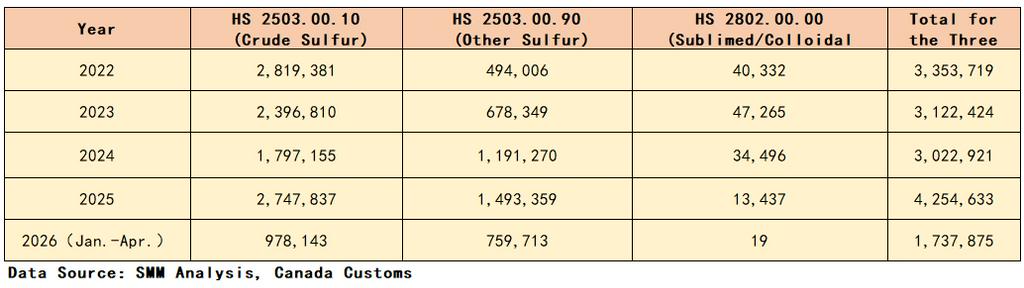
1.2 Annual Export Tonnage Trend (Unit: Ton)
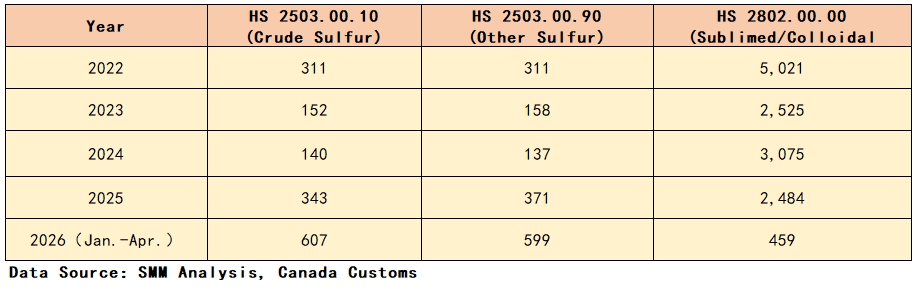
1.3 Annual Weighted Average Unit Price by Product (Unit: USD/Ton)
1.4 Overall Volume & Value Trend Summary
The industry stayed at a cyclical high in 2022, with annual exports of USD 1.233 billion and 3.35 million tons, and a mainstream product average price of USD 311/ton. The industry cooled sharply in 2023, with export value nearly halved, accompanied by synchronized declines in tonnage and unit price. The downturn continued in 2024, hitting a five-year low in export value and unit price and bringing overall industrial profit pressure.
A strong market reversal took place in 2025 with a simultaneous surge in volume and price. Full-year exports reached USD 1.53 billion and 4.25 million tons, representing a substantial year-on-year tonnage growth of 40.7% and a sharp rebound in mainstream product unit prices. The industry prosperity continued to rise in 2026: exports reached USD 1.049 billion and 1.74 million tons in the first four months, with the crude sulfur average unit price jumping to USD 607/ton, nearly twice the 2022 level. The annualized tonnage is estimated at 5.22 million tons, setting a new all-time high for full-year export scale.
Meanwhile, fundamental structural iteration has occurred in product categories. Sublimed/colloidal sulfur, which maintained an ultra-high premium with an average price above USD 5,000/ton in 2022, has shrunk consistently in both export tonnage and unit price. It recorded merely 19 tons of exports at an average price of USD 459/ton in January–April 2026, essentially withdrawing from the global high-end market. Current industrial growth is entirely driven by crude sulfur and other sulfur.
II. Export Provincial Pattern: Dual-Province Oligopoly and Highly Geographically Concentrated Production Capacity
Based on the aggregated export data of two mainstream sulfur products for January–April 2026, Canada’s sulfur exports show an extreme geographic clustering feature. National production capacity and overseas sales channels are highly concentrated in two core provinces, while all other provinces only achieve negligible supplementary exports with no industrial influence.
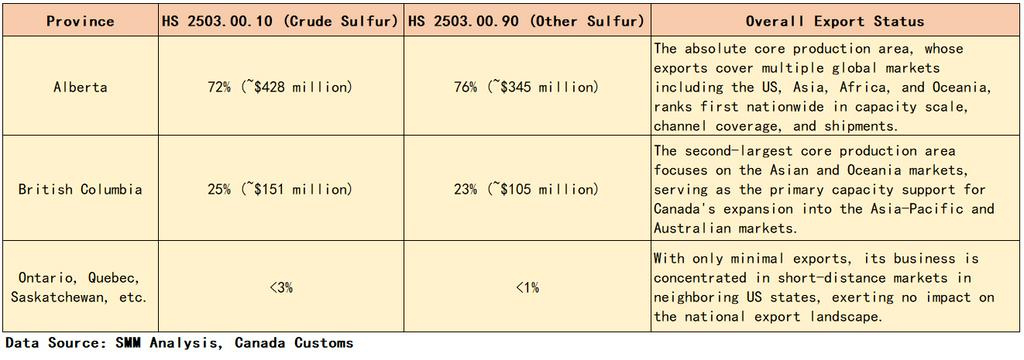
Core Conclusion: Alberta and British Columbia jointly account for more than 95% of Canada’s total sulfur exports, forming a stable dual-province oligopoly pattern. Industrial production capacity, resources, and overseas channels are highly concentrated, ensuring long-term stability of the market landscape.
III. Export Destination Pattern: Top Four Markets Leading Global Trade with Stratified Regional Price Differentials
Based on January–April 2026 export details (excluding the trivial volume of sublimed/colloidal sulfur), this section ranks exports by tonnage for crude sulfur and other sulfur, fully demonstrating the global distribution, scale, and pricing characteristics of Canada’s sulfur exports with high market concentration and prominent regional differentiation.
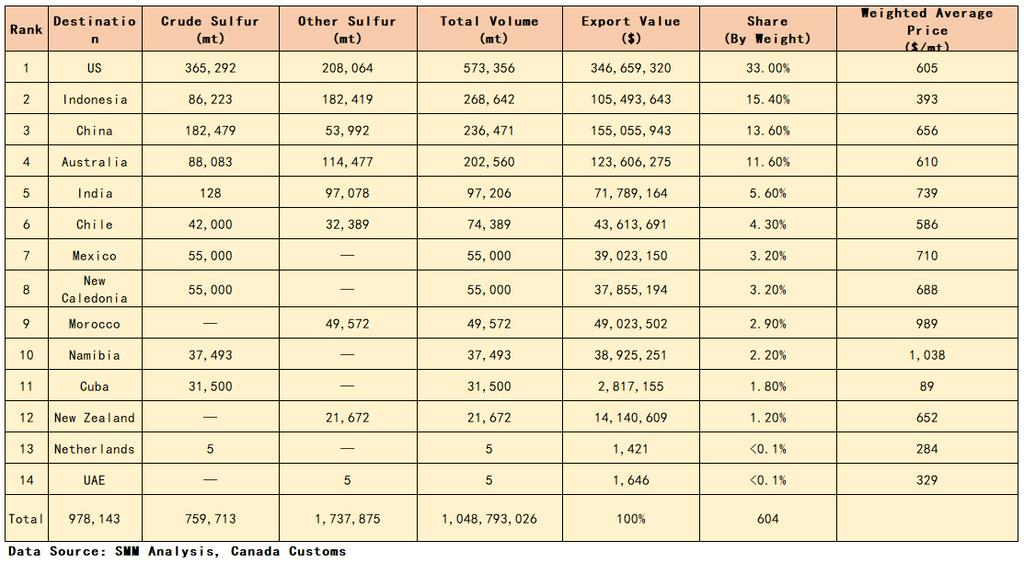
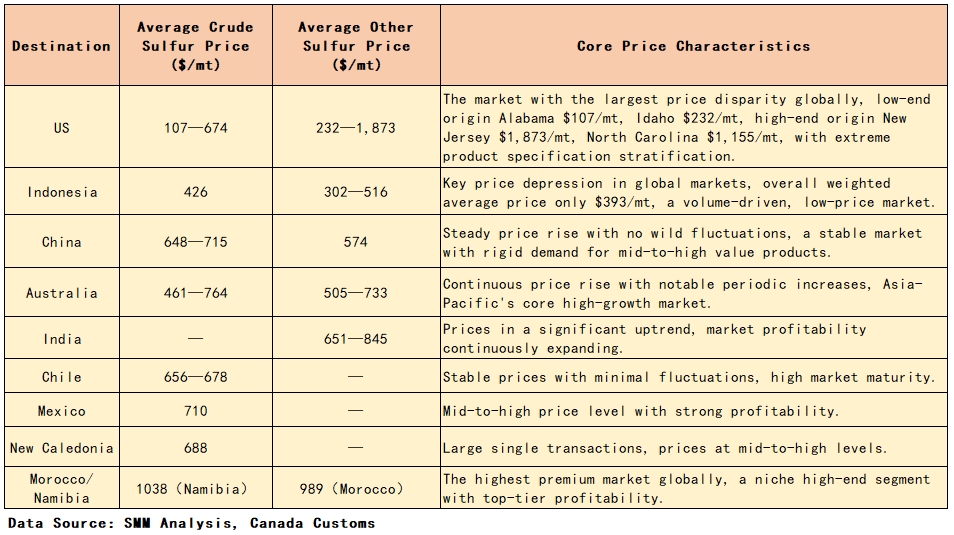
Core Market Characteristics: First, the market is highly concentrated, with the top four destinations (the U.S., Indonesia, China, and Australia) contributing 73.6% of total export tonnage and dominating industrial export trends. Second, scale and price are mismatched: the U.S. is the largest market by volume, while Indonesia ranks second in tonnage but features the lowest price. Third, high-end niche markets stand out: African markets (Morocco and Namibia) only account for 5.1% of total tonnage but maintain the world’s highest unit prices with significant premium margins. Fourth, rigid-demand markets deliver steady value growth: average prices in Asia-Pacific markets including China, Australia, and India keep rising with stable profitability.
IV. In-Depth Analysis of Unit Price: Cyclical Reversal and Double-Digit Growth with Clear Global Price Stratification
4.1 Annual Unit Price Cyclical Trend
The average unit price of Canada’s mainstream sulfur products has completed a full cycle of peak plunge bottom rebound double surge. The industry maintained a high unit price of USD 311/ton in 2022. A sharp price decline occurred in 2023–2024, bottoming at USD 137–158/ton and squeezing overall industrial profits. Market rebounded strongly in 2025, with average prices of two mainstream sulfur products doubling to USD 343–371/ton. Industry prosperity continued to climb in 2026, with crude sulfur at USD 607/ton and other sulfur at USD 599/ton in the first four months, nearly double the 2022 level and hitting a five-year high in overall industrial profitability.
High-end product categories continue to be marginalized. Sublimed/colloidal sulfur has slumped from an ultra-high premium of USD 5,021/ton in 2022 to USD 459/ton in 2026. Combined with near-zero export tonnage, it has completely exited the high-end segmented market.
4.2 Price Stratification of Major Destinations (January–April 2026)
V. Answers to Core Industry Questions
1. What is the annual export capacity of Canadian sulfur? Canada’s sulfur export value presents a trend of “decline bottom outbreak”: USD 1.233 billion (2022), USD 0.591 billion (2023), USD 0.521 billion (2024, cyclical bottom), and USD 1.53 billion (2025, historical peak). Export tonnage fluctuated accordingly: 3.35 million tons (2022), 3.12 million tons (2023), 3.02 million tons (2024), and 4.25 million tons (2025, up 40.7% year-on-year, historical peak). In January–April 2026, exports reached 1.74 million tons valued at USD 1.049 billion, with an annualized tonnage of 5.22 million tons, expected to set a new full-year record.
2. What are Canada’s major sulfur-exporting provinces? The industry features a strict dual-province monopoly. Alberta is the core exporting region, accounting for 72% of crude sulfur exports and 76% of other sulfur exports. British Columbia is the second-largest producing region, holding 25% of crude sulfur exports and 23% of other sulfur exports. The two provinces jointly occupy over 95% of national export share, with all other provinces having negligible influence on the overall industry pattern.
3. How has the unit price evolved, and what is the global price differential pattern? The unit price cycle is distinct: crude sulfur dropped from USD 311/ton in 2022 to a bottom of USD 140/ton in 2024, rebounded to USD 343/ton in 2025, and surged to USD 607/ton in January–April 2026, nearly doubling the 2022 level. Other sulfur products followed the identical trend. In terms of product structure, high-end sublimed/colloidal sulfur has been completely marginalized. Globally, African markets (Namibia, Morocco) represent the highest-priced high-end segment; Indonesia is the lowest-priced high-volume market; the U.S. sees multi-fold price gaps driven by product specifications; Asia-Pacific and Latin American markets maintain stable and rising pricing trends.
4. What are the tonnage distribution characteristics of core export markets in 2026? The export market is highly concentrated. The top four markets—the U.S. (573,000 tons, 33% share), Indonesia (269,000 tons, 15.4% share), China (236,000 tons, 13.6% share), and Australia (203,000 tons, 11.6% share)—jointly account for 73.6% of total export tonnage. The U.S. ranks first in both export volume and value as the core rigid-demand market; Indonesia is the second-largest tonnage market with the lowest pricing; African niche markets have small tonnage shares but the strongest premium capability.
![[SMM Analysis] Premier African Minerals Releases Operational and Corporate Update](https://imgqn.smm.cn/usercenter/AYpRQ20251217171727.jpg)
![[Brazil's Critical Minerals Progress Depends on Government Support, Industry Says]](https://imgqn.smm.cn/usercenter/yfoxV20251217171727.jpg)
![[Rongjie Energy Signs 3GWh LFP Cell Supply Deal with Lineage Power]](https://imgqn.smm.cn/usercenter/MyEcZ20251217171727.jpg)