Chapitre 1 : La crise énergétique redéfinit la valeur du charbon à coke
En 2026, alors que la guerre russo-ukrainienne se poursuit et que le conflit américano-iranien se ravive, les prix de référence du pétrole brut continuent de se déplacer vers le haut. Conjugués aux conflits géopolitiques persistants dans d'autres régions du monde, les besoins en sécurité énergétique augmentent, entraînant une réévaluation systématique de la valeur du charbon à coke. De plus, dans un contexte de prix pétroliers élevés, les avantages en termes de coûts de la chimie à base de charbon par rapport à la chimie à base de pétrole commencent à se manifester, améliorant la rentabilité de la substitution charbon-pétrole et élargissant la demande de charbon à coke.
Le charbon à coke possède la double nature de matière première industrielle et de produit énergétique, soutenu à la fois par une demande rigide et une forte élasticité aux prix de l'énergie, avec une capacité de valorisation dépassant largement celle des produits industriels ordinaires. La perception du marché a connu un changement fondamental : le charbon à coke s'est progressivement affranchi de son positionnement subordonné au sein de la chaîne industrielle sidérurgique pour être reclassé comme actif énergétique stratégique rare.
La crise énergétique a restructuré sa logique de valorisation. La tarification s'est libérée du cadre unique de l'offre et de la demande sidérurgique pour être intégrée au système mondial de comparaison des prix de l'énergie. Les primes énergétiques et de sécurité ont élevé le centre de valorisation, en faisant une cible importante pour la couverture des risques géopolitiques et l'allocation de ressources stratégiques.
Chapitre 2 : Panorama du marché mondial du charbon à coke
(I) Répartition mondiale des ressources de charbon à coke
Source des données : données publiques
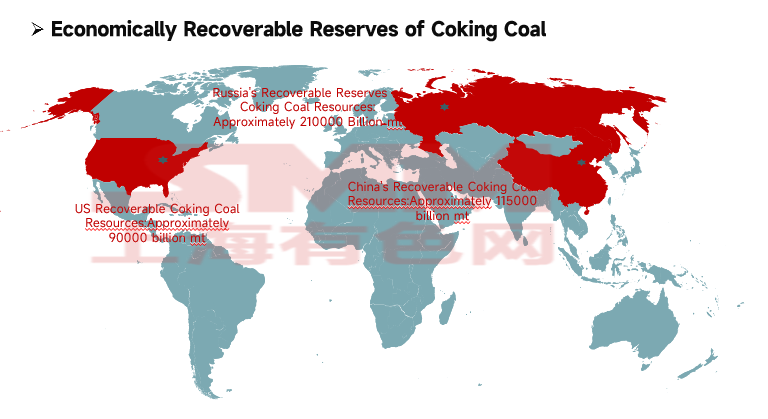
Les ressources mondiales de charbon à coke représentent 13 % des ressources totales mondiales de charbon, soit environ 1 140 milliards de tonnes. Environ 49 % sont réparties en Europe, 29 % en Asie et 19 % en Amérique du Nord. Les réserves économiquement récupérables de charbon à coke s'élèvent à environ 500 milliards de tonnes, dont le charbon à coke de haute qualité à faible teneur en cendres et en soufre ne représente qu'environ 60 milliards de tonnes.
Les ressources de charbon à coke économiquement récupérables sont principalement concentrées dans trois pays : la Russie (42 %, environ 210 milliards de tonnes), la Chine (23 %, environ 115 milliards de tonnes) et les États-Unis (18 %, environ 90 milliards de tonnes), les autres pays représentant des parts relativement faibles.
(II) Répartition mondiale de la production de charbon à coke
Source des données : données publiques
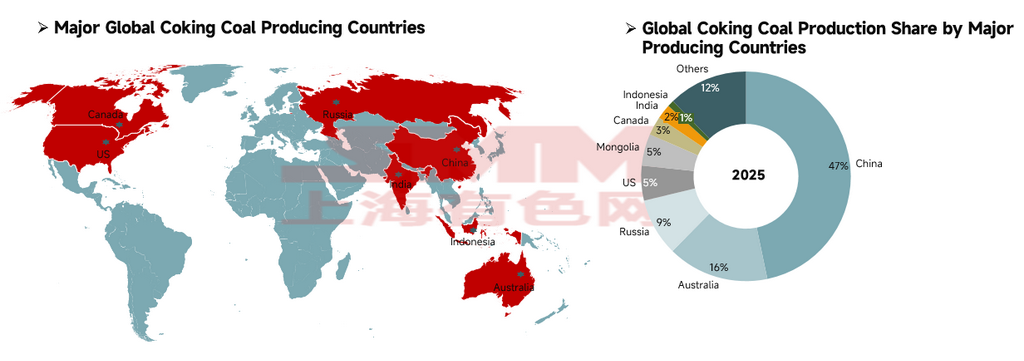
La production mondiale de charbon à coke en 2025 s'élevait à environ 1,1 milliard de tonnes, avec un paysage de production très concentré. La Chine occupait la première place avec 514 millions de tonnes, représentant 47 % de la production mondiale et servant de pilier central de l'approvisionnement, bien que la quasi-totalité de la production soit consommée sur le marché intérieur. L'Australie (172 millions de tonnes) et la Russie (98 millions de tonnes) se classaient respectivement deuxième et troisième, suivies de près par les États-Unis (59 millions de tonnes), la Mongolie (54 millions de tonnes) et le Canada (32 millions de tonnes), tandis que l'Inde produisait 25 millions de tonnes et l'Indonésie 11 millions de tonnes. Ces huit pays représentaient collectivement 88 % de la production mondiale de charbon à coke.
Source des données : World Steel Association, AIE
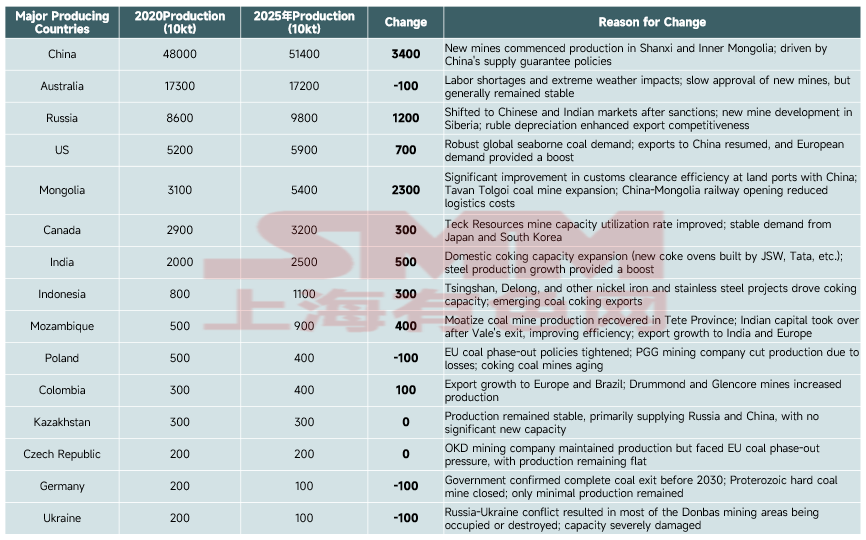
Principaux pays producteurs : la Chine a fermement maintenu sa première place mondiale avec des volumes absolus passant de 480 millions de tonnes (2020) à 514 millions de tonnes (2025), réalisant la plus forte augmentation mondiale de 34 millions de tonnes, principalement portée par la mise en service de nouvelles mines nationales et les politiques de sécurité d'approvisionnement. La Russie et la Mongolie sont devenues des contributeurs clés à la croissance avec des augmentations respectives de 12 millions et 23 millions de tonnes — la première bénéficiant de la réorientation des marchés post-sanctions et du développement de nouvelles mines, tandis que la seconde a réalisé des augmentations substantielles de production grâce à l'amélioration du dédouanement frontalier avec la Chine et à la réduction des coûts ferroviaires. La capacité de l'Australie est restée globalement stable.
Les pays de l'UE (Allemagne, Pologne) et l'Ukraine ont continué à réduire leur production en raison de facteurs tels que les politiques de sortie du charbon, le vieillissement des mines et les conflits géopolitiques, tandis que les États-Unis, l'Inde, le Mozambique et d'autres pays ont réalisé une croissance de capacité portée par la demande à l'exportation et le dynamisme des industries en aval.
(III) Analyse du commerce mondial d'exportation de charbon à coke
Source des données : données publiques
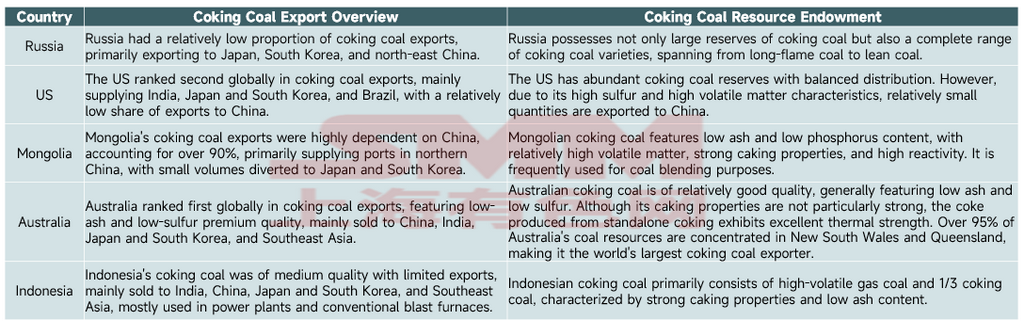
Le commerce mondial d'exportation de charbon à coke est fortement concentré dans cinq pays — l'Australie, la Russie, la Mongolie, les États-Unis et l'Indonésie — principalement pour les raisons suivantes :
Dotation monopolistique en ressources : la Russie représente 42 % des réserves mondiales récupérables de charbon à coke, et les États-Unis 18 %. L'Australie possède des ressources de charbon à coke de haute qualité, rares à l'échelle mondiale, à faible teneur en cendres et en soufre. La Mongolie et l'Indonésie disposent également de variétés de charbon distinctives adaptées aux besoins de mélange. Ces barrières liées aux ressources créent un monopole du côté de l'offre.
Avantages de localisation et de coûts logistiques : les régions productrices de charbon à coke en Australie sont adjacentes aux ports de la côte est, permettant un accès maritime à faible coût aux principales régions sidérurgiques mondiales. Les zones minières de Mongolie sont frontalières de la Chine, avec une logistique terrestre offrant un accès direct au marché chinois. La Russie, les États-Unis et l'Indonésie s'appuient sur des réseaux maritimes et ferroviaires transfrontaliers matures pour couvrir efficacement les marchés de demande mondiaux.
Structure industrielle et inadéquation offre-demande : bien que la Chine détienne 23 % des réserves mondiales de charbon à coke, en tant que premier producteur mondial d'acier, la demande de consommation de charbon à coke de la Chine est extrêmement rigide, ce qui en fait le plus grand importateur mondial de charbon à coke. En revanche, les cinq pays mentionnés ci-dessus ont une consommation intérieure limitée et un excédent d'offre de charbon à coke. Leurs structures industrielles sont centrées sur l'exportation de ressources, fournissant une base d'approvisionnement pour des exportations à grande échelle.
Qualité du charbon et adéquation avec la demande mondiale : les variétés de charbon de ces pays forment un système d'approvisionnement complémentaire. Le charbon australien est adapté à la demande de coke haut de gamme, le charbon mongol sert de matière première de mélange de qualité supérieure, le charbon russe couvre toute la gamme des variétés, et les charbons américain et indonésien répondent aux besoins de mélange des différents procédés sidérurgiques. Cela correspond précisément aux besoins rigides de mélange des entreprises sidérurgiques mondiales, formant un schéma d'exportation stable.
Chapitre 3 : Le marché chinois du charbon à coke
(1) Offre et demande actuelles de charbon à coke en Chine
Sources des données : Bureau national des statistiques (NBS), Administration générale des douanes de Chine, données publiques
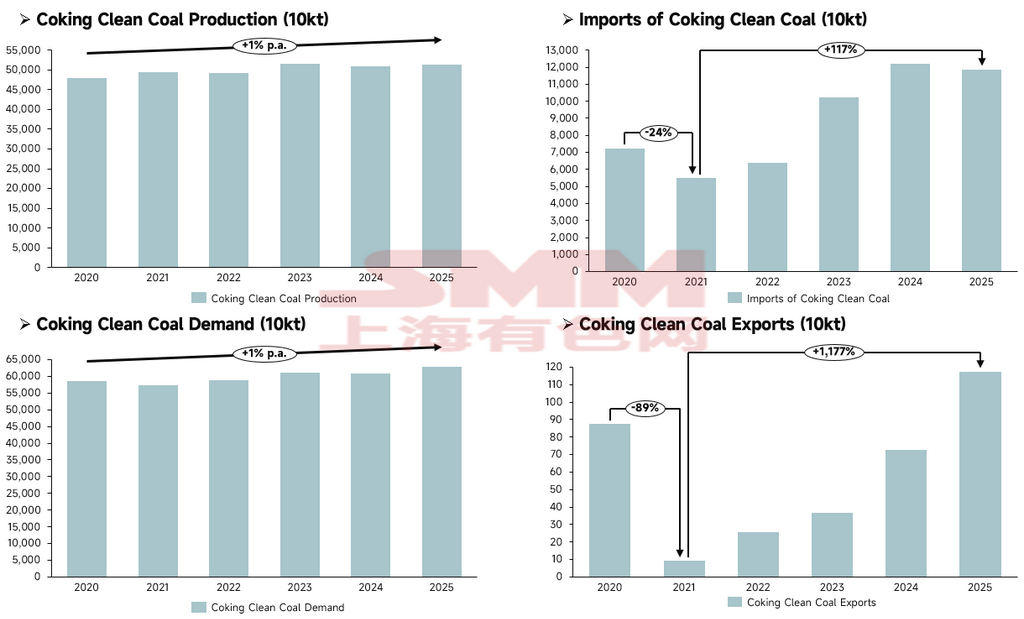
Côté offre, la production chinoise de concentré de charbon à coke a connu une croissance régulière, passant progressivement de 480 millions de tonnes en 2020 à 514 millions de tonnes en 2025, avec une échelle d'approvisionnement globale restant stable et sans fluctuations brutales observées.
Du côté des importations et exportations, les importations sont devenues la variable centrale complétant l'offre intérieure chinoise : les importations ont brièvement diminué de 24 % en glissement annuel à 54,768 millions de tonnes en 2021, puis sont entrées dans une trajectoire d'expansion soutenue, avec des importations en 2025 en hausse de 117 % par rapport à 2021 à 118 millions de tonnes ; les exportations sont restées à des niveaux faibles sur le long terme, plongeant de 89 % en glissement annuel à 92 000 tonnes en 2021, puis rebondissant progressivement, mais le volume d'exportation de 1,175 million de tonnes en 2025 a eu un impact minimal sur le marché global.
Du côté de la demande, la demande en concentré de charbon à coke a également maintenu une croissance modérée, atteignant 628 millions de tonnes en 2025, en légère hausse par rapport à 2020. La croissance de la demande a été principalement soutenue par l'expansion concomitante de la production de coke (la production de coke a atteint 502 millions de tonnes en 2025). Globalement, la croissance de la production intérieure chinoise de charbon à coke n'a pas pu pleinement répondre à l'expansion de la demande, les ressources importées comblant efficacement l'écart entre l'offre et la demande.
(II) Bilan offre-demande du charbon à coke en Chine
Source des données : Bureau national des statistiques (NBS), données publiques
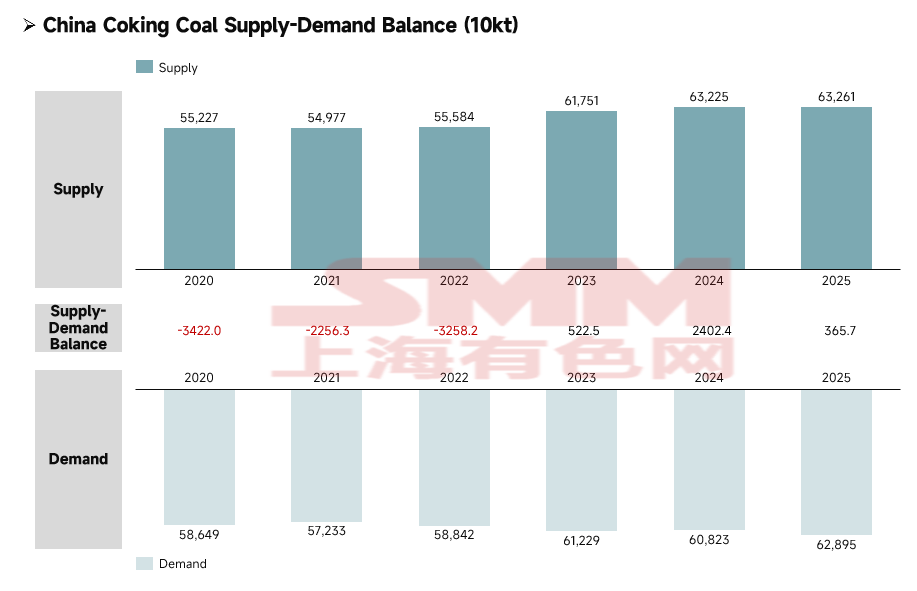
De 2020 à 2025, le marché chinois du concentré de charbon à coke a achevé une transition d'une offre tendue vers un équilibre serré avec un léger excédent, l'offre et la demande s'étant développées simultanément et la stabilité opérationnelle du marché s'étant considérablement améliorée.
Le côté offre a affiché une tendance de croissance soutenue et régulière, la libération des capacités nationales combinée aux ressources d'importation complémentaires ayant conjointement favorisé l'amélioration continue des capacités d'approvisionnement. Le côté demande a maintenu une expansion modérée, principalement soutenue par la demande de production rigide des industries du coke et de l'acier, avec une croissance globale nettement plus lente que celle de l'offre.
Par phase, de 2020 à 2022, le marché était en état de sous-approvisionnement persistant, avec des déficits d'offre apparaissant sur les trois années, et l'industrie était fortement dépendante des ressources importées pour combler l'écart offre-demande. En 2023, le marché a atteint un point de retournement structurel, réalisant un excédent d'offre pour la première fois ; en 2024, l'ampleur de l'excédent s'est considérablement élargie ; en 2025, l'excédent s'est réduit, mais le marché s'était définitivement affranchi de son statut prolongé de déficit. Avec l'amélioration continue de la capacité de garantie d'approvisionnement en concentré de charbon à coke de la Chine, combinée à l'ajustement flexible des canaux d'importation, le marché est entré dans une fourchette saine d'équilibre serré où l'offre était légèrement supérieure à la demande.
Chapitre 4 : Bilan offre-demande mondial du charbon à coke
Source des données : AIE, données publiques
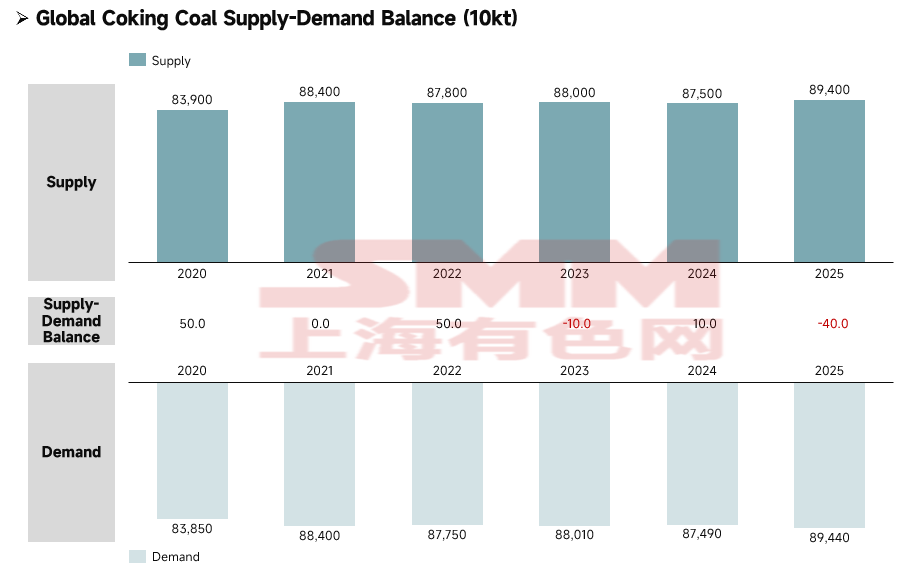
De 2020 à 2025, le marché mondial du charbon à coke est progressivement passé d'un léger excédent à un léger déficit offre-demande. Le resserrement à long terme des ressources mondiales de charbon à coke premium, aggravé par de multiples facteurs externes tels que la restructuration du paysage énergétique mondial déclenchée par la crise énergétique et les changements de politiques énergétiques nationales, a finalement conduit le marché mondial du charbon à coke d'un état relativement détendu dans la période antérieure à un léger déficit.
Chapitre 5 : Résumé
Sous l'effet des conflits géopolitiques et de la transition énergétique, la valeur stratégique du charbon à coke a continué de croître, avec des primes de sécurité énergétique devenues prépondérantes, et le paysage global de l'industrie évoluant progressivement vers un équilibre offre-demande tendu. La production mondiale de charbon à coke est limitée, les ressources premium à faible teneur en cendres et en soufre étant particulièrement rares. Les réserves, les capacités et le commerce d'exportation sont tous fortement concentrés, quelques pays tels que la Russie, la Chine, les États-Unis et l'Australie contrôlant le côté offre, formant un paysage monopolistique grâce à des avantages en matière de ressources, de logistique et de complémentarité des qualités de charbon, tandis que la crise énergétique apporte de nouvelles opportunités et de nouveaux défis.
Globalement, les marchés du charbon à coke en Chine et hors de Chine se sont orientés vers un équilibre tendu, les pénuries structurelles de qualités premium constituant un enjeu majeur. Le marché du charbon à coke devrait bien résister tout au long de l'année 2026.
![[Analyse SMM] Le point d'inflexion des stocks de matériaux de construction apparaît](https://imgqn.smm.cn/usercenter/MhPNV20251217171716.jpg)
![[SMM Conference] AASC 2026 : Naviguer la transformation des véhicules électriques de l'ASEAN à un carrefour stratégique](https://imgqn.smm.cn/usercenter/nkdst20251217171652.jpg)
![[SMM Steel] Les prix des bobines laminées à chaud de l'ASEAN ont baissé mais n'ont pas encore attiré les acheteurs vietnamiens](https://imgqn.smm.cn/usercenter/bkAyC20251217171720.jpg)