The International Copper Study Group (ICSG) released preliminary data on global copper supply and demand for March 2026 in its monthly bulletin published in May 2026.
Preliminary data indicated that global copper mine production in Q1 2026 was basically flat, with copper concentrates production declining by 1.1%, offset by a 3.3% increase in solvent extraction-electrodeposition (SX-EW) production.
Although global mine production benefited from additional output driven by capacity ramp-up of projects in several countries, significant declines in copper concentrates production in Chile, the DRC, and Indonesia offset global growth.
In Indonesia, copper concentrates production at the Grasberg mine fell by 42%, as the severe mud inflow incident that occurred in September last year continued to affect the mine's production.
Chile's mine production declined by 5.8%, with increased production at the Collahuasi and Quebrada Blanca mines offset by production cuts at the Spence, El Teniente, Escondida, and Los Pelambres mines.
The DRC's mine production is estimated to have grown by only 0.5%: SX-EW production increased by approximately 10%, but was partially offset by a 36% decline in copper concentrates production due to reduced output at the Kamoa mine (affected by the 2025 earthquake event).
In Peru, copper mine production grew by 3.3%, primarily driven by increased production at the Antamina, Las Bambas, and Antapaccay mines, which more than offset production declines at Southern Peru Copper, Quellaveco, and Marcobre.
Mongolia's copper concentrates production is estimated to have grown by approximately 36%, benefiting from the capacity ramp-up of the Oyu Tolgoi underground project.
Preliminary data indicated that global copper cathode production grew by approximately 4.5% in Q1 2026, with primary copper (electrolysis and ore electrodeposition) production increasing by 3.8% and secondary copper (from scrap) production increasing by 7.6%.
China and the DRC, which currently account for approximately 60% of global production, saw their combined production increase by an estimated 9% (China 8.8%, DRC 10%). Excluding these two countries, global copper cathode production declined by approximately 1.4%.
Chile's copper cathode production fell by 11.7%, with copper cathode (from concentrates) production declining by 24% due to smelter operational constraints and maintenance, and electrodeposition copper production declining by 5.7%.
Production in Asia (excluding China) is estimated to have declined by 4%, mainly due to production decreases in Japan, Indonesia, and the Philippines. India's production is estimated to have grown by 25%, benefiting from improved capacity utilization rates and the capacity ramp-up of the Adani smelter.
Global secondary refined copper production (from scrap) increased by 7.6%, mainly driven by growth in China.
Preliminary data indicated that global apparent refined copper usage grew by 0.8% in Q1 2026.
Although global usage excluding China was estimated to have grown by 1.7%, China's apparent demand (excluding bonded warehouse/unreported inventory changes) was estimated to be basically flat, affected by a 40% decline in China's net imports of copper cathode.
China currently accounts for approximately 58% of total global refined copper usage.
The preliminary global refined copper supply-demand balance indicated an oversupply of 396,000 mt in Q1 2026.
In compiling the global market balance, ICSG used China's apparent demand calculation method, which does not account for changes in unreported inventories. However, to facilitate global market analysis, an adjustment item has been added to the attached tables — "Global refined copper balance adjusted for Chinese bonded warehouse inventory changes" — which adjusts the global refined copper balance based on the average bonded warehouse inventory change estimates from two Chinese copper market consultancies.
In Q1 2026, the global refined copper balance based on China's apparent usage (excluding bonded warehouse/unreported inventory changes) showed a preliminary oversupply of approximately 396,000 mt, compared with an oversupply of approximately 135,000 mt in the same period of 2025. The global refined copper balance adjusted for estimated changes in Chinese bonded warehouse inventories showed a market oversupply of approximately 386,000 mt.
Copper Prices and Inventories:
Based on the average estimates from two independent consultancies, Chinese bonded warehouse inventories were estimated to have decreased by approximately 10,000 mt from the end of 2025 levels during the first three months of 2026.
As of the end of April 2026, copper inventories at major metal exchanges (LME, COMEX, SHFE) totaled 1,148,760 mt, the highest level since January 2003. Inventories increased by 404,648 mt, or 55%, from the end of December 2025, with LME up 253,350 mt, Shanghai Futures Exchange up 46,683 mt, and COMEX up 104,615 mt.
The LME spot copper average price in April was $12,891.38 per mt, up 3% from the March average price of $12,498.98 per mt. The 2026 copper price high and low were $14,097 per mt (May 13) and $11,826 per mt (March 19), respectively, with a year-to-date average price of $12,947.22 per mt, up 30% from the 2025 average price.
Global Refined Copper Supply and Demand Trends
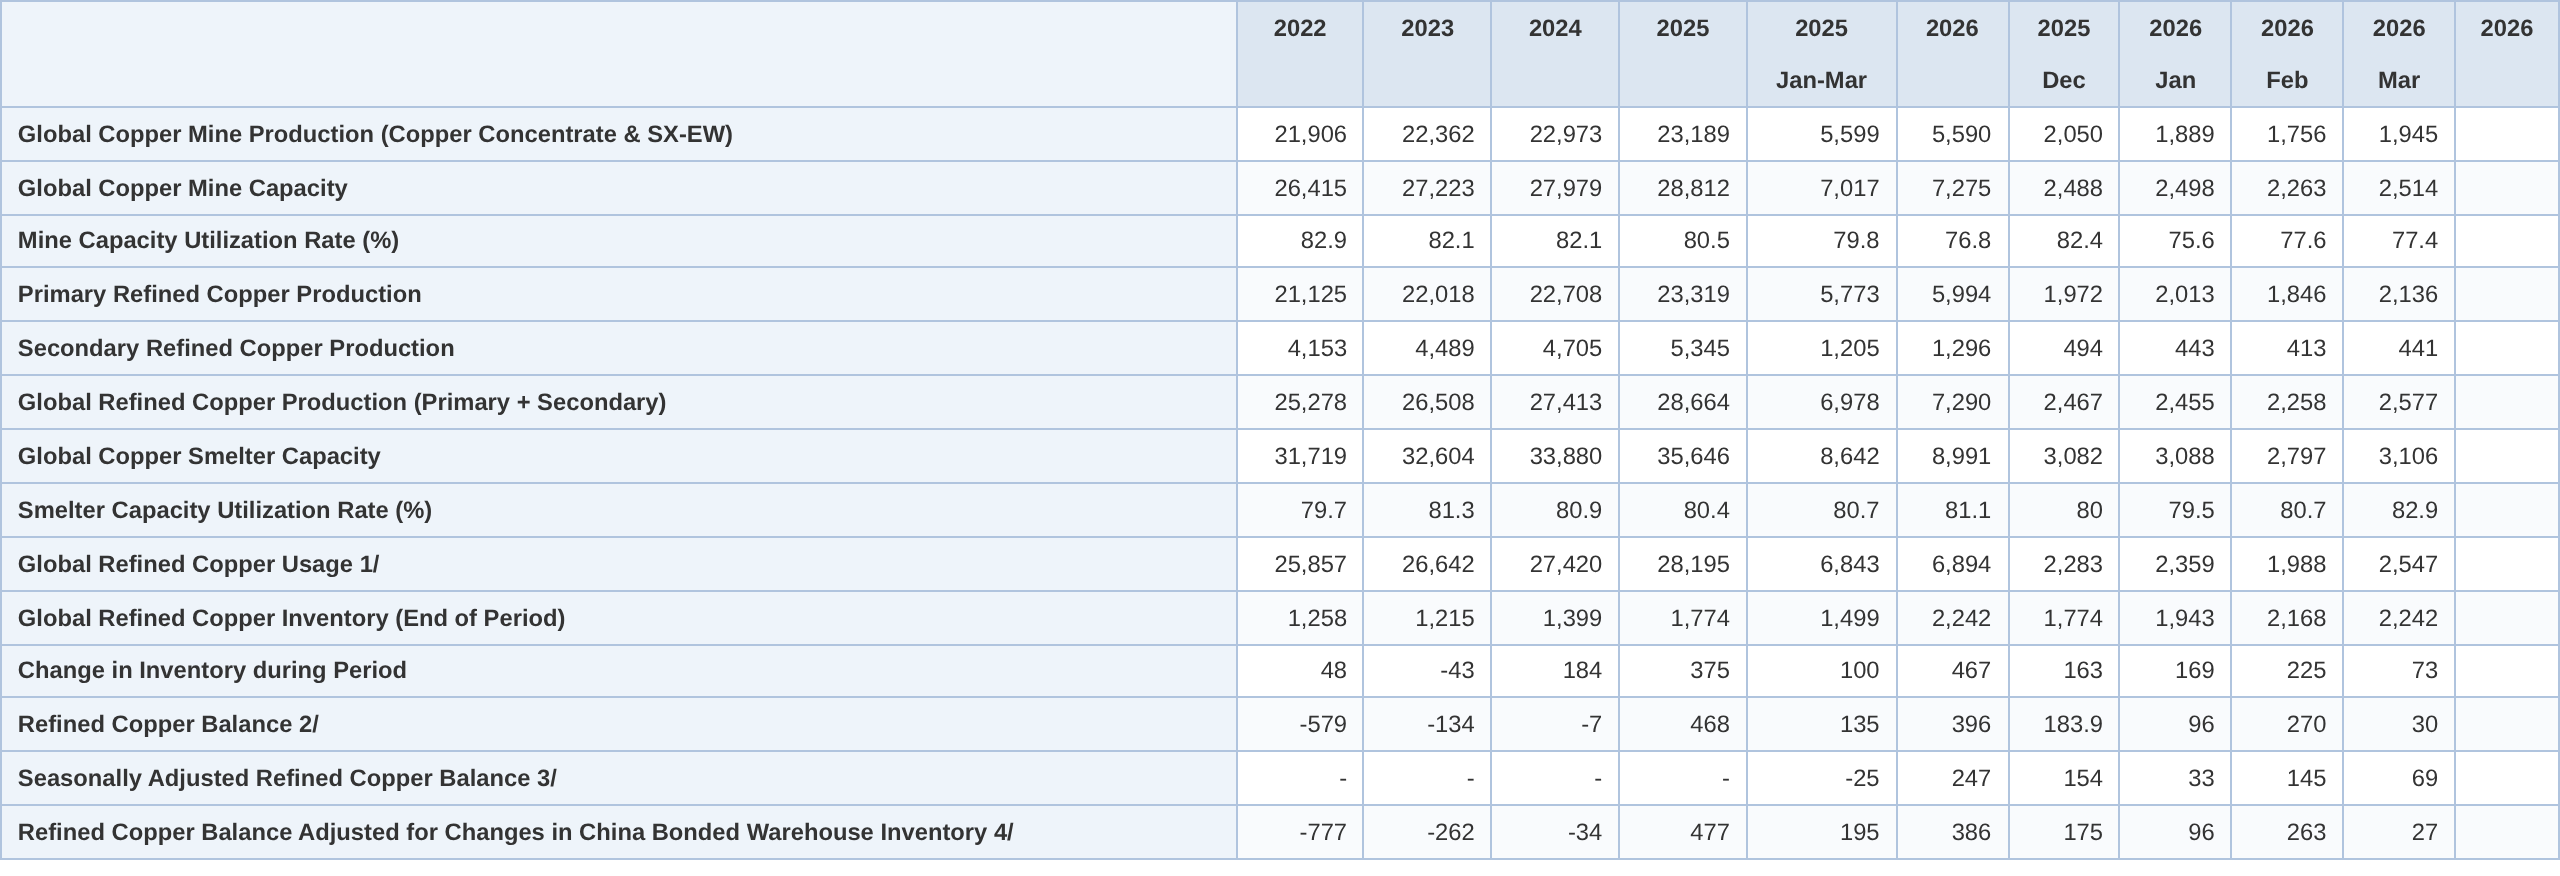
Notes:
1/ Refers to apparent usage
2/ Refined copper balance = production - usage
3/ Seasonally adjusted balance data
4/ Global refined copper balance adjusted for estimated changes in Chinese bonded warehouse inventories
(Wenhua Composite)
![Tight supply coupled with rising sentiment to hold back from selling kept secondary copper prices resilient at high levels [SMM Weekly Review on Secondary Copper Raw Materials Outside China]](https://imgqn.smm.cn/usercenter/HhNHP20251217171708.jpg)
![[Mingyi Electronics Launches High-Aspect-Ratio Gantry Line Electroplating Equipment for AI Servers and IC Substrates]](https://imgqn.smm.cn/usercenter/CaDcj20251217171711.jpg)
![US Inflation Exceeds Expectations, Combined with Inventory Buildup in China, Copper Prices Rebound Under Pressure [SMM Macro Weekly Review]](https://imgqn.smm.cn/usercenter/JnFuh20251217171711.jpg)