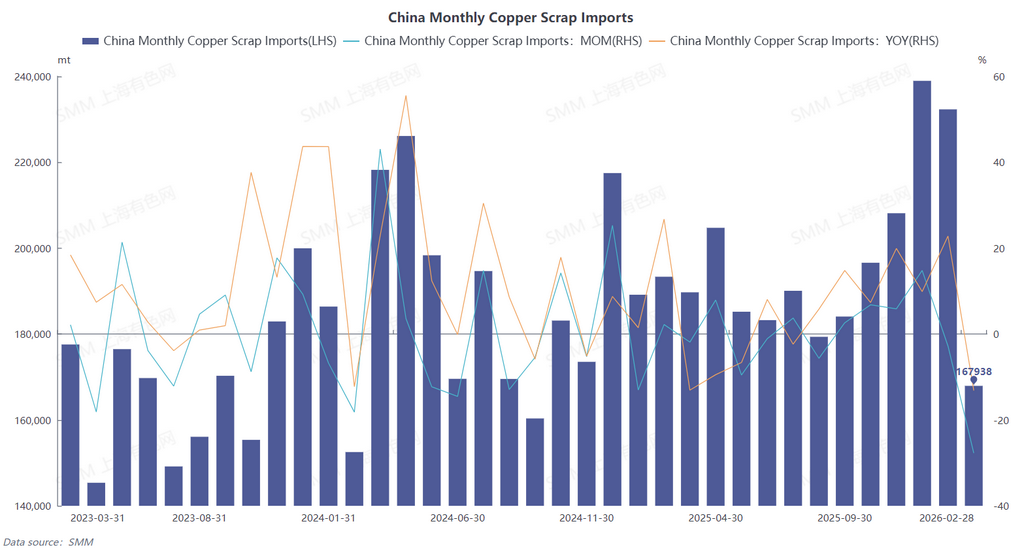
According to the latest data from the General Administration of Customs, China imported 232,300 mt in physical content of copper scrap and shredded copper scrap in January 2026, down 2.78% MoM and up 22.82% YoY. Imports were 167,900 mt in physical content in February, down 27.72% MoM and down 13.14% YoY. Cumulative imports in January-February 2026 reached 400,300 mt in physical content, up 4.64% YoY on a cumulative basis. (HS code: 74040000)
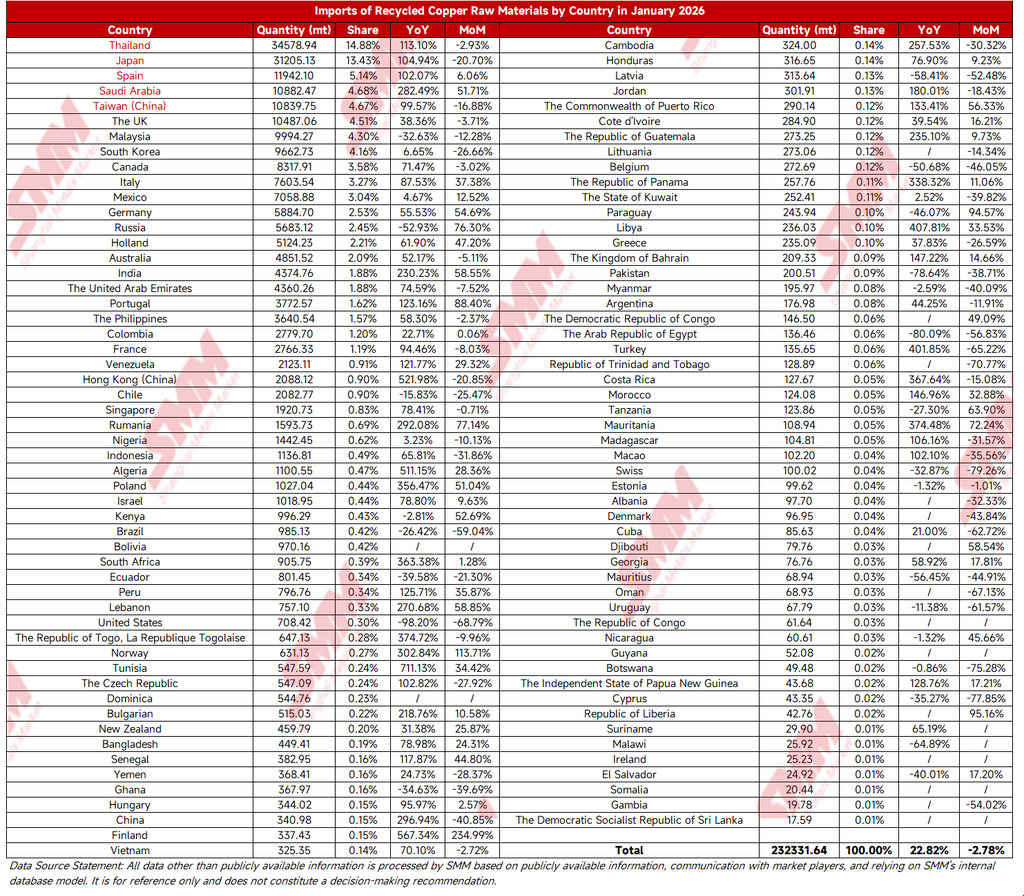
China's copper scrap import sources showed clear characteristics of “one dominant supplier with several strong suppliers, and diversified sourcing.” Japan, Thailand, and Spain remained firmly in the top three over the long term, with solid core supplier positions. Japan: exports to China were 31,200 mt in January, accounting for 13.43%, up 104.94% YoY; exports were 26,600 mt in February, with the share rising to 15.81%, still up 13.93% YoY. Although both months saw MoM declines, its core supplier position remained unshaken. Thailand: exports were 34,600 mt in January, making it the largest supplier that month, with a 14.88% share, up 113.1% YoY; exports were 26,400 mt in February, accounting for 15.69%, up 27.53% YoY, together with Japan forming the top two sources of supply. Spain, Saudi Arabia, and others also maintained relatively high growth rates, becoming important support for diversified supply.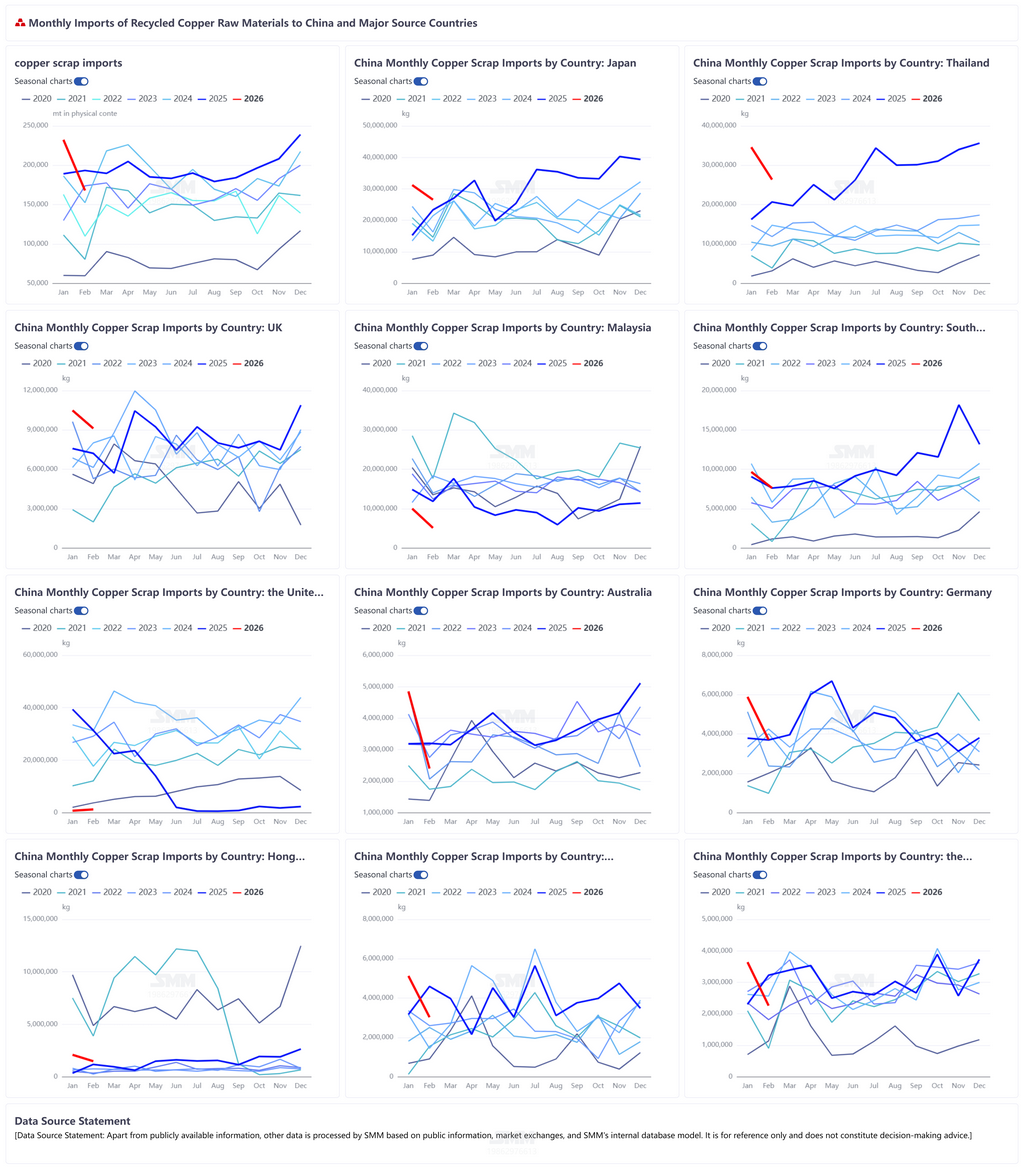
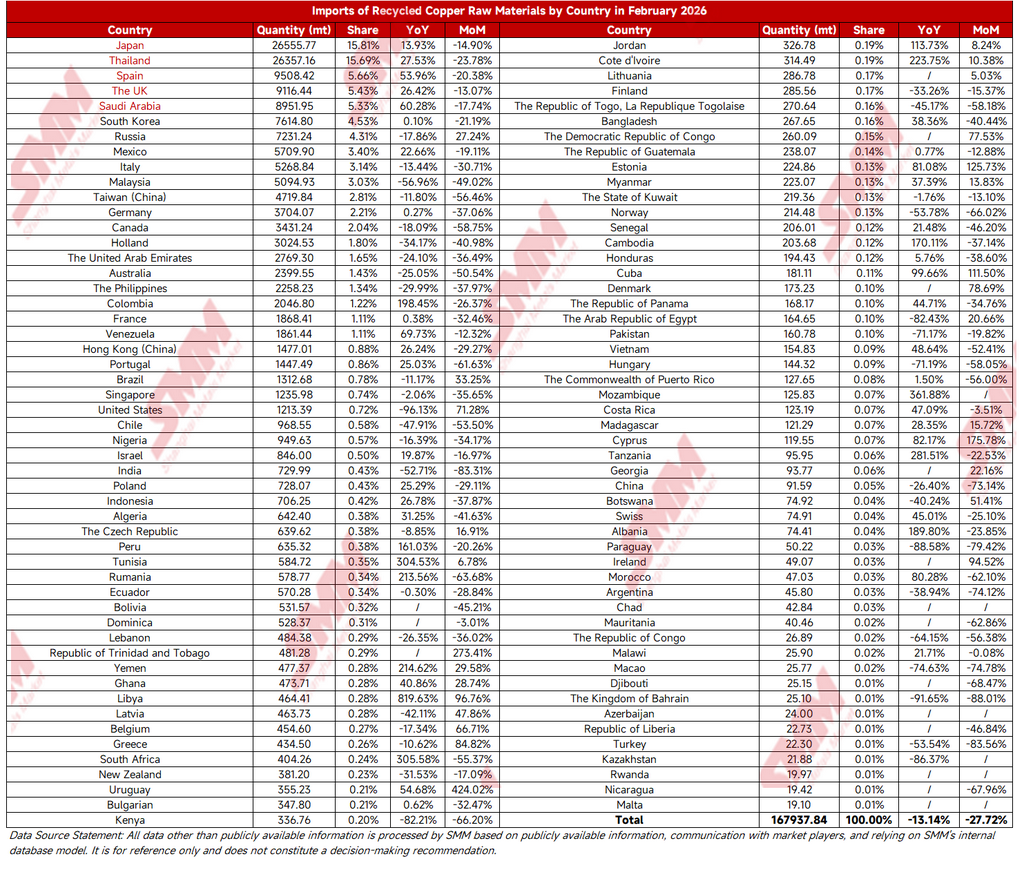
February coincided with China's traditional Chinese New Year holiday, when copper processing enterprises in China generally entered shutdown and maintenance periods, downstream demand contracted temporarily, and enterprises' purchase willingness for raw materials declined significantly. At the same time, port logistics and customs clearance efficiency slowed down temporarily due to the holiday, further leading February imports to fall 27.72% MoM. This fluctuation was in line with the import pattern seen around Chinese New Year in previous years. In addition, judging from country-level data, all core supplier countries posted MoM declines of varying degrees in February, directly dragging down overall imports.
Short term, as enterprises in China fully resumed work and production after Chinese New Year, downstream demand gradually recovered, and port logistics returned to normal, copper scrap imports are expected to repair significantly MoM in March. Long term, the supply landscape of “one dominant supplier with several strong suppliers, and diversified sourcing” will continue. As global capacity of copper scrap is released, copper scrap imports will likely maintain stable growth, providing important raw material support for China's copper industry chain.