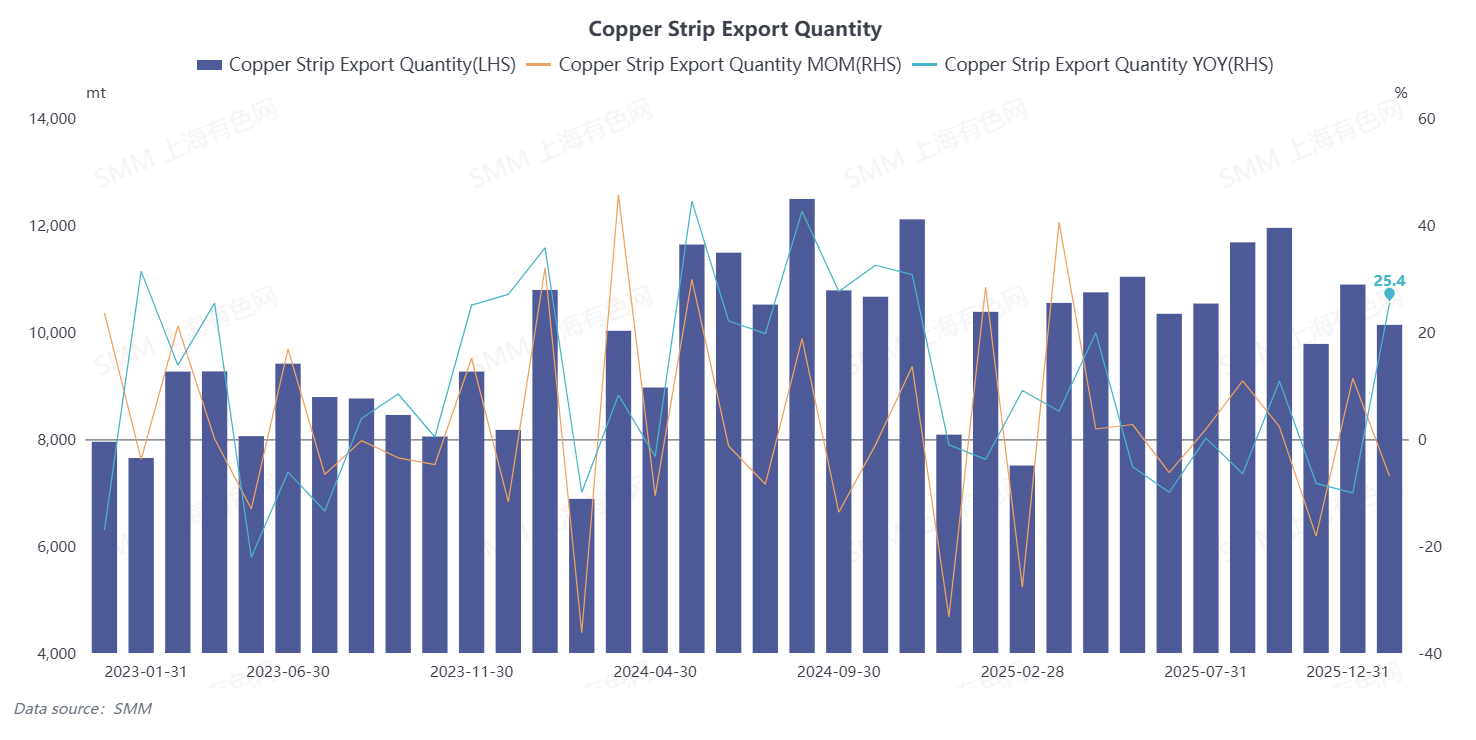
According to data from the General Administration of Customs, China's exports of copper plate/sheet and strip totaled 10,133.46 mt in December 2025, down 6.92% MoM but up 25.4% YoY. From January to December, cumulative exports of copper plate/sheet and strip reached 125,489.3 mt, with a cumulative increase of 0.88% YoY.
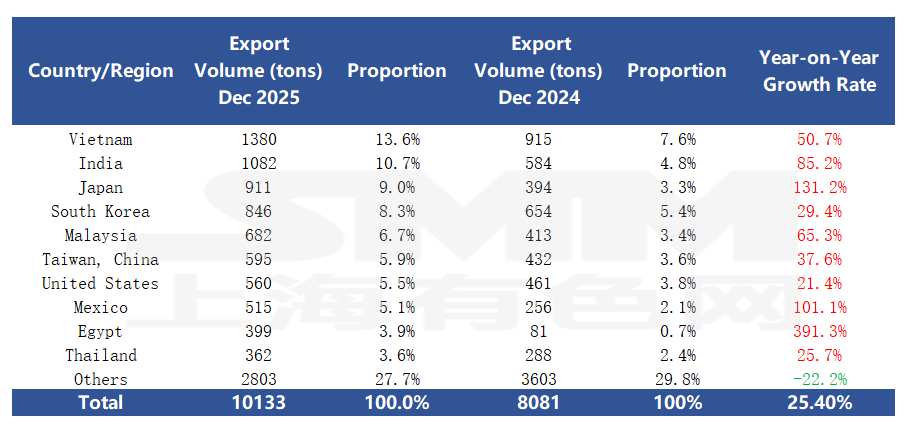
 In December, China's copper plate/sheet and strip exports performed impressively, reaching 92 countries and regions, with major export destinations all achieving YoY growth in exports. In terms of rankings, the top-tier landscape shifted: Vietnam retained the top position with exports of 1,380 mt; the Indian market continued its steady momentum, with a YoY growth rate of 85.2%, rising to second place; Japan, with a substantial YoY increase of 131.2%, successfully climbed to third place. From a growth perspective, besides Japan, Egypt and Mexico also stood out, with YoY growth rates reaching 391% and 101% respectively, becoming highlights of copper plate/sheet and strip exports for the month.
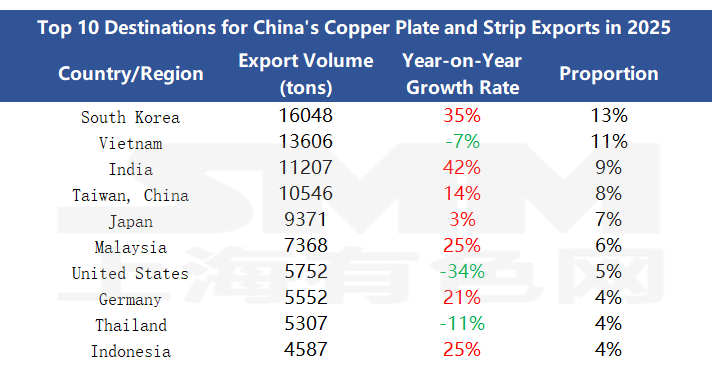
From a full-year perspective, China's total exports of copper plate/sheet and strip reached 125,500 mt in 2025, up 0.88% YoY, characterized by overall stable volume and structural divergence. Export market concentration remained high, with the top ten countries and regions collectively contributing over 70% of exports, forming the core foundation. Among them, South Korea ranked first with exports of 16,000 mt, up 35% YoY; India followed closely, with exports surging 42% YoY, becoming a key driver of growth; markets such as Malaysia, Germany, and Indonesia also achieved steady growth in the range of 21%–25%. Some traditional markets experienced significant adjustments: exports to the US fell sharply by 34% YoY, Thailand dropped 11% YoY, and Vietnam also saw a slight pullback of 7%, reflecting the impact of localized demand changes and overseas tariff adjustments on the market.
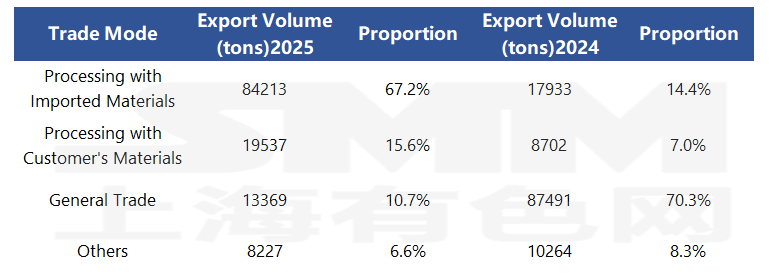
The export tax rebate policy for copper plate/sheet and strip was officially canceled from December 1, 2024, which had an immediate impact on the industry's export structure. A comparison of annual data shows that before the policy adjustment, Ordinary Trade was the primary export method, accounting for 70.3% in 2024. After the policy took effect, enterprises quickly shifted to bonded trade methods such as Processing Trade with Imported Materials and Processing Trade with Supplied Materials, with their combined proportion surging to 82.8% in 2025, a sharp increase of 61.4 percentage points from 21.4% in 2024. Among them, exports under Processing Trade with Imported Materials surged from 17,900 mt to 84,200 mt, and its share soared from 14.4% to 67.2%, becoming the core strategy for enterprises to cope with the cancellation of the tax rebate. This directly reflects the adaptive optimization of trade structures by enterprises in response to the policy adjustment.
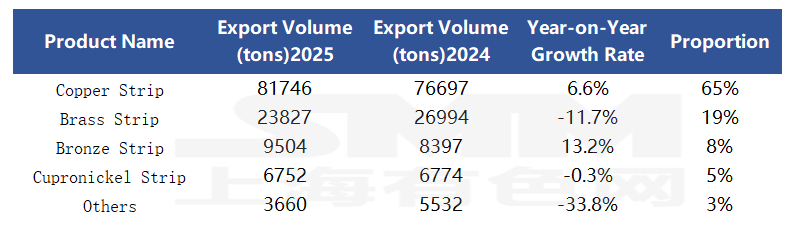
From the breakdown of product structure, China's copper plate/sheet and strip exports in 2025 were still dominated by copper strip, with exports reaching 81,700 mt, accounting for 65% of total exports, and achieving a 6.6% increase YoY, making it the core category boosting exports; bronze strip performed remarkably, with exports up 13.2% YoY, showing strong growth momentum; however, affected by factors such as export policy adjustments and intense homogeneous competition, brass strip exports in 2025 showed a declining trend, down 11.7% YoY. In addition, other categories of plate/sheet and strip saw a decline as high as 33.8%, reflecting the continued import dependence of China's high-end copper plate/sheet and strip products.
Data Source: General Administration of Customs, SMM compilation
(HS Codes: 74091110, 74091190, 74091900, 74092100, 74092900, 74093100, 74093900, 74094000, 74099000)