According to data from the National Bureau of Statistics (NBS),in December 2025, the national consumer price index (CPI) rose 0.8% YoY.Specifically, prices in urban areas increased by 0.9%, while those in rural areas increased by 0.6%; food prices rose by 1.1%, and non-food prices rose by 0.8%; prices of consumer goods increased by 1.0%, and prices of services increased by 0.6%. For the full year of 2025, the national consumer price index remained flat compared with the previous year.
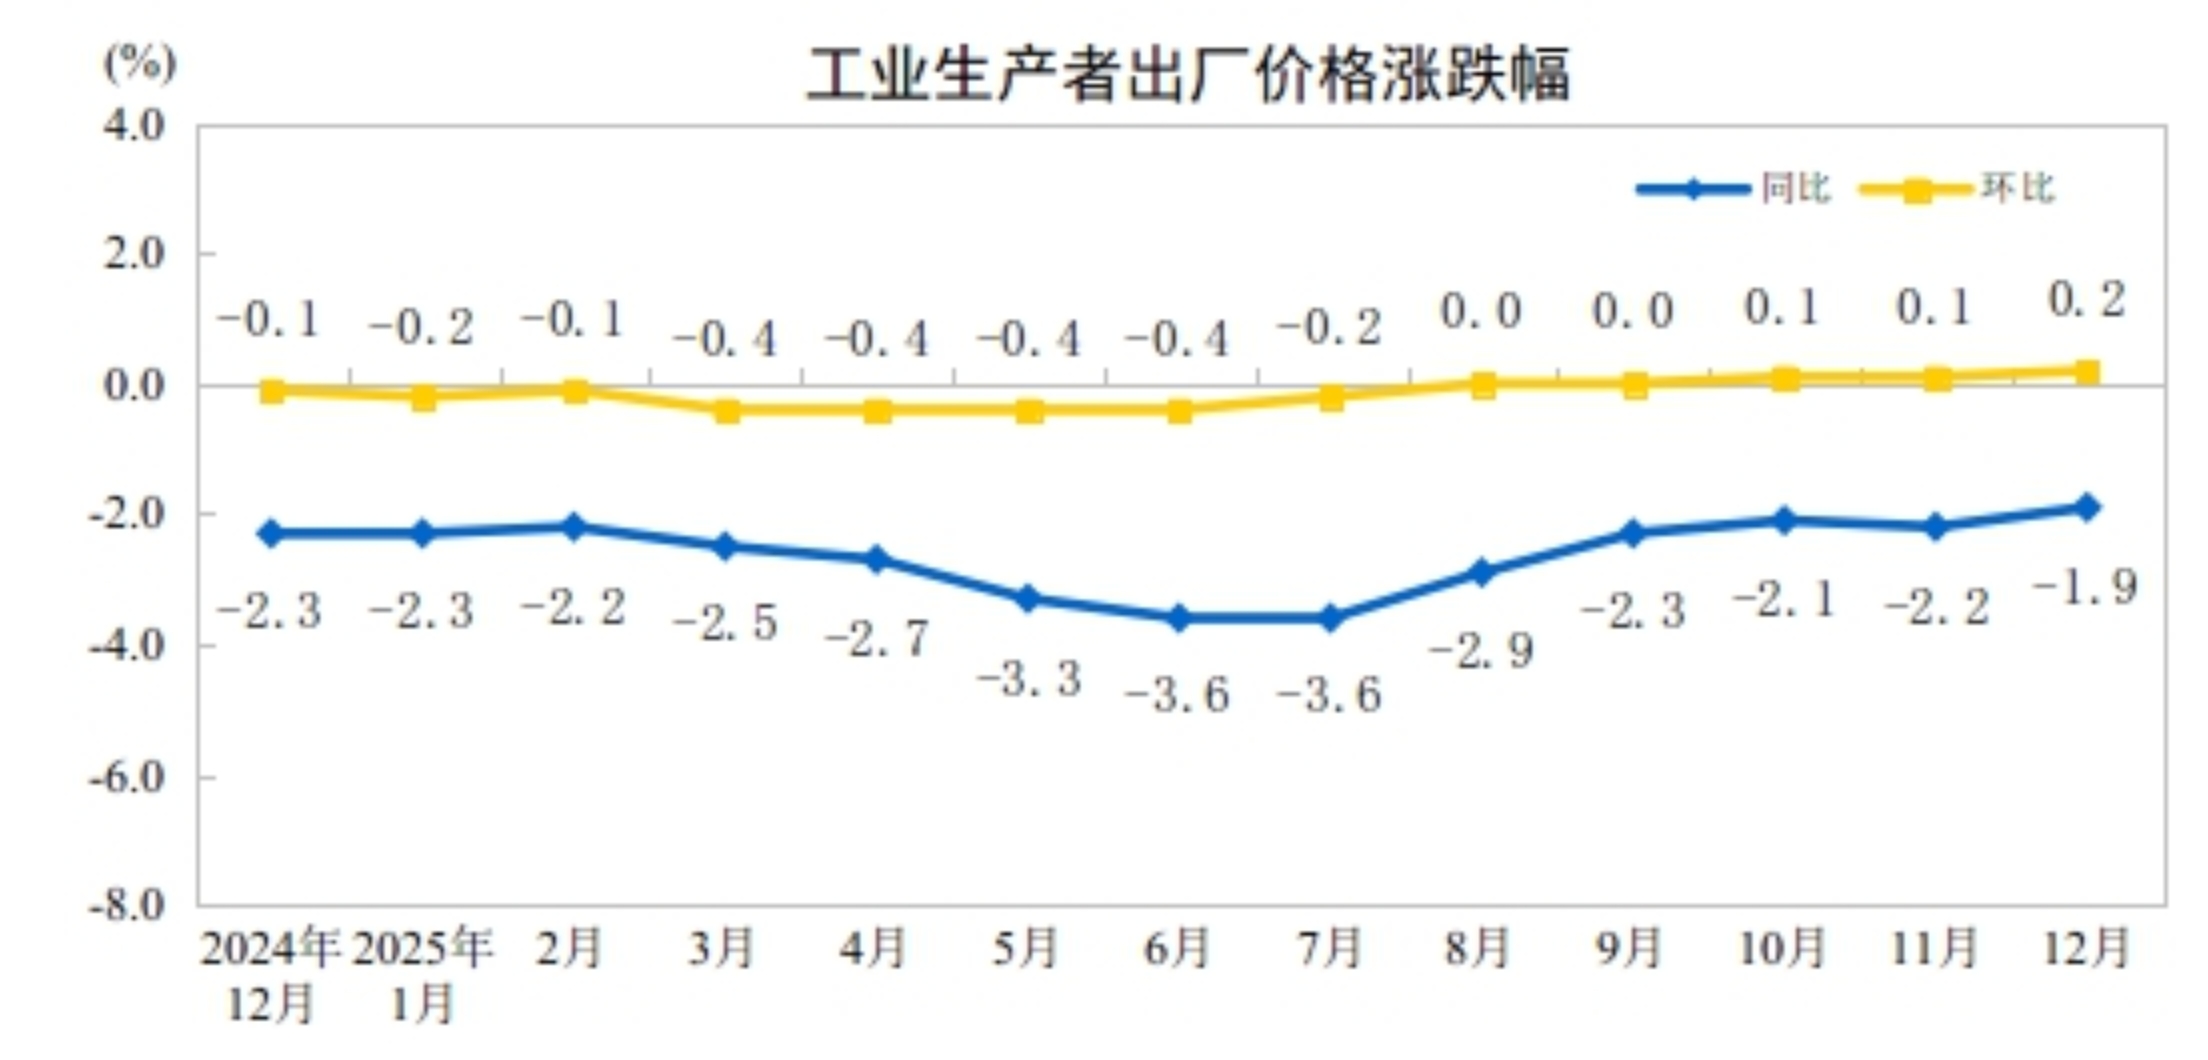
In December 2025, the ex-factory prices of industrial producers nationwide fell by 1.9% YoY, with the rate of decline narrowing by 0.3 percentage points compared with the previous month;on a monthly basis, they increased by 0.2% MoM, with the rate of increase expanding by 0.1 percentage points from the previous month. The purchase prices of industrial producers decreased by 2.1% YoY, with the rate of decline narrowing by 0.4 percentage points compared with the previous month; they rose by 0.4% MoM, with the rate of increase expanding by 0.3 percentage points from the previous month. For the full year of 2025, the ex-factory prices of industrial producers decreased by 2.6%, and the purchase prices of industrial producers fell by 3.0%.
Dong Lijuan, Chief Statistician of the Urban Department of the National Bureau of Statistics (NBS), interpreted the CPI and PPI data for December 2025.
Consumer Prices Rose 0.8% YoY in December 2025
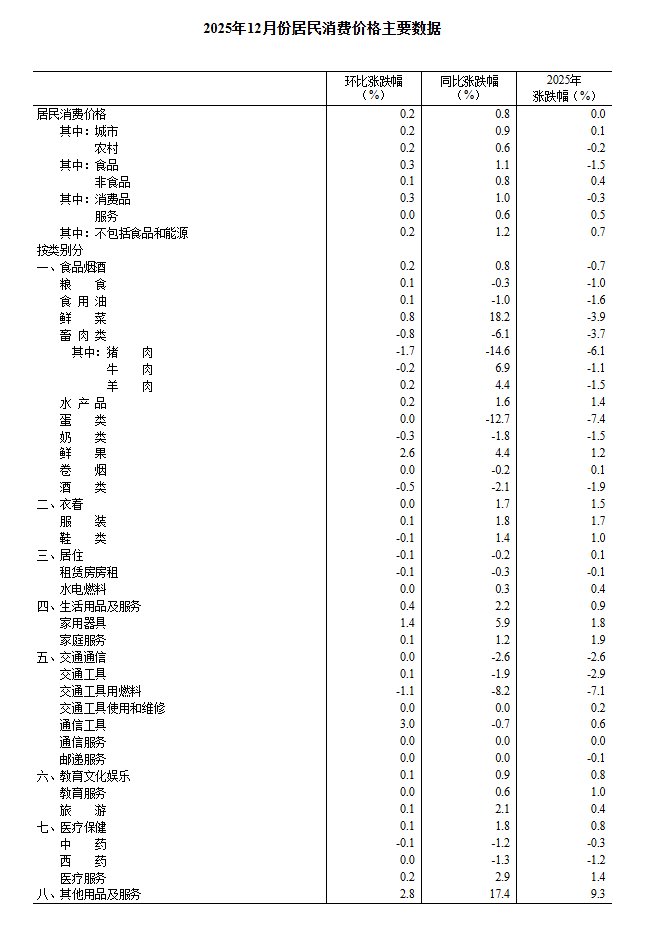
In December 2025, the national consumer price index (CPI) increased by 0.8% year-on-year. Specifically, prices in urban areas rose by 0.9%, while those in rural areas rose by 0.6%; food prices increased by 1.1%, and non-food prices increased by 0.8%; prices of consumer goods went up by 1.0%, and prices of services increased by 0.6%.
In December, the national consumer price index rose by 0.2% month-on-month. Specifically, prices in urban areas increased by 0.2%, and those in rural areas increased by 0.2%; food prices rose by 0.3%, and non-food prices rose by 0.1%; prices of consumer goods increased by 0.3%, while service prices remained flat.
For the full year of 2025, the national consumer price index remained unchanged compared with the previous year.

I. Year-on-Year Changes in Prices of Various Goods and Services
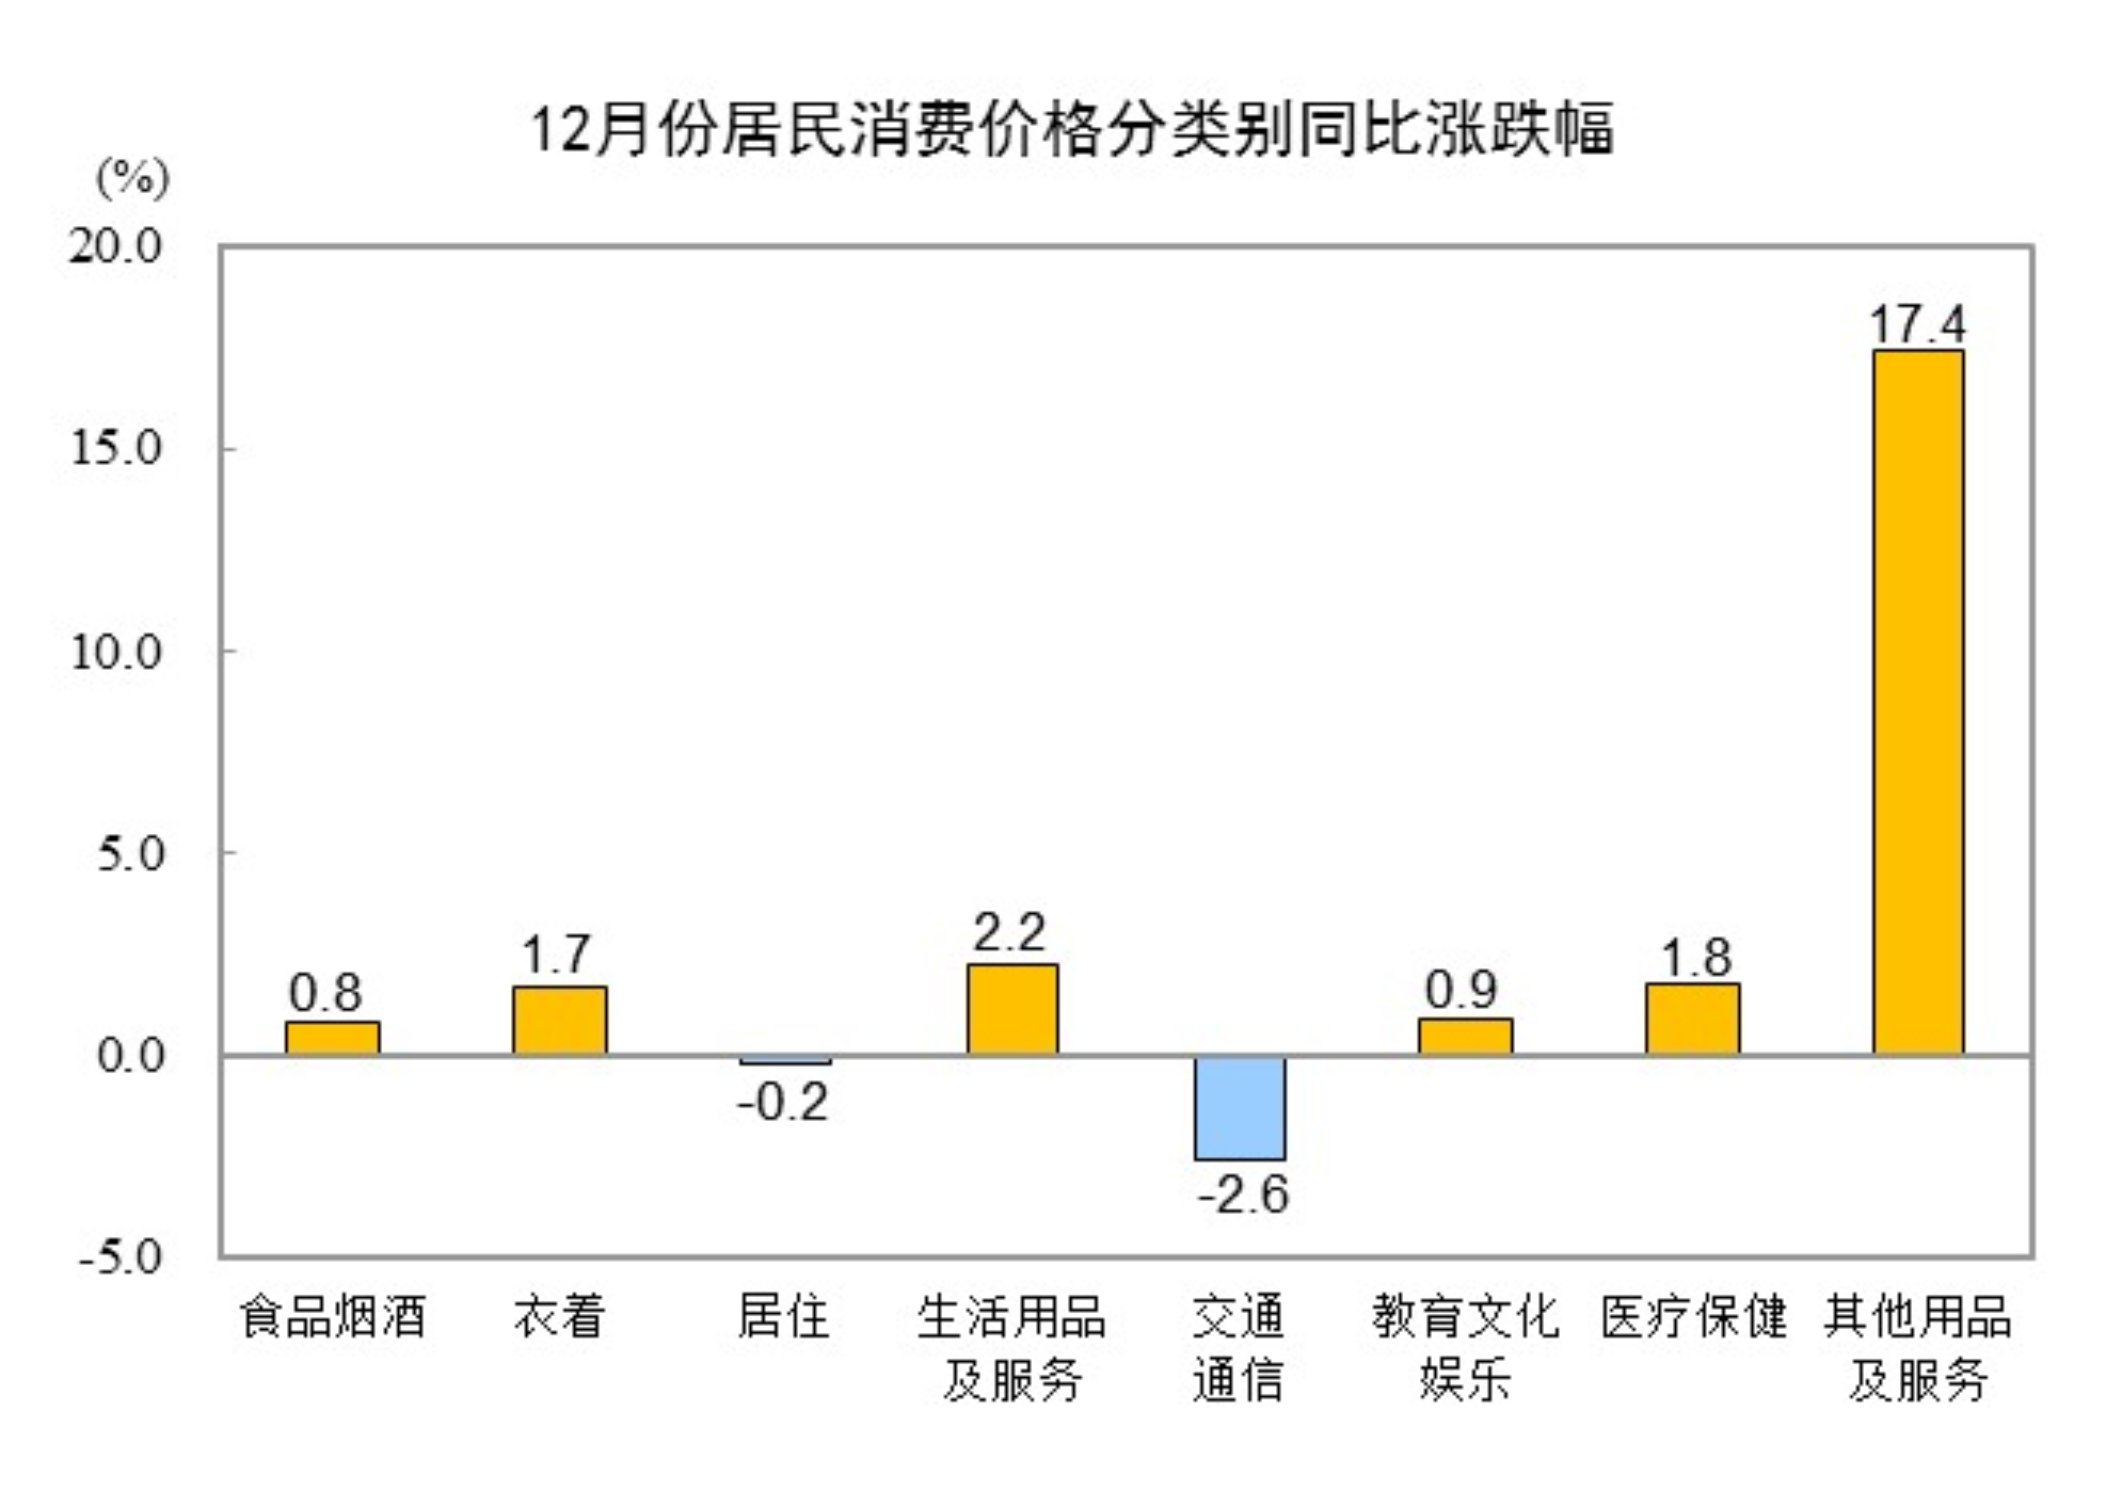
In December, prices of food, tobacco, and alcohol increased by 0.8% year-on-year, contributing approximately 0.24 percentage points to the rise in the CPI. Within the food category, prices of fresh vegetables increased by 18.2%, contributing about 0.39 percentage points to the CPI increase; prices of fresh fruits rose by 4.4%, contributing about 0.09 percentage points; prices of aquatic products increased by 1.6%, contributing about 0.03 percentage points; prices of eggs decreased by 12.7%, dragging down the CPI by approximately 0.09 percentage points; prices of livestock meat fell by 6.1%, dragging down the CPI by about 0.19 percentage points (with pork prices down 14.6%, contributing to a 0.20 percentage point decline in the CPI); and prices of grains decreased by 0.3%, dragging down the CPI by about 0.01 percentage points.
Among the other seven categories, five saw price increases and two experienced decreases on a YoY basis. Specifically, prices for other articles and services, household articles and services, and healthcare rose by 17.4%, 2.2%, and 1.8%, respectively, while prices for clothing, and education, culture, and recreation increased by 1.7% and 0.9%, respectively; prices for transportation and communication, and housing dropped by 2.6% and 0.2%, respectively.
II. Month-over-Month Changes in Prices of Various Goods and Services
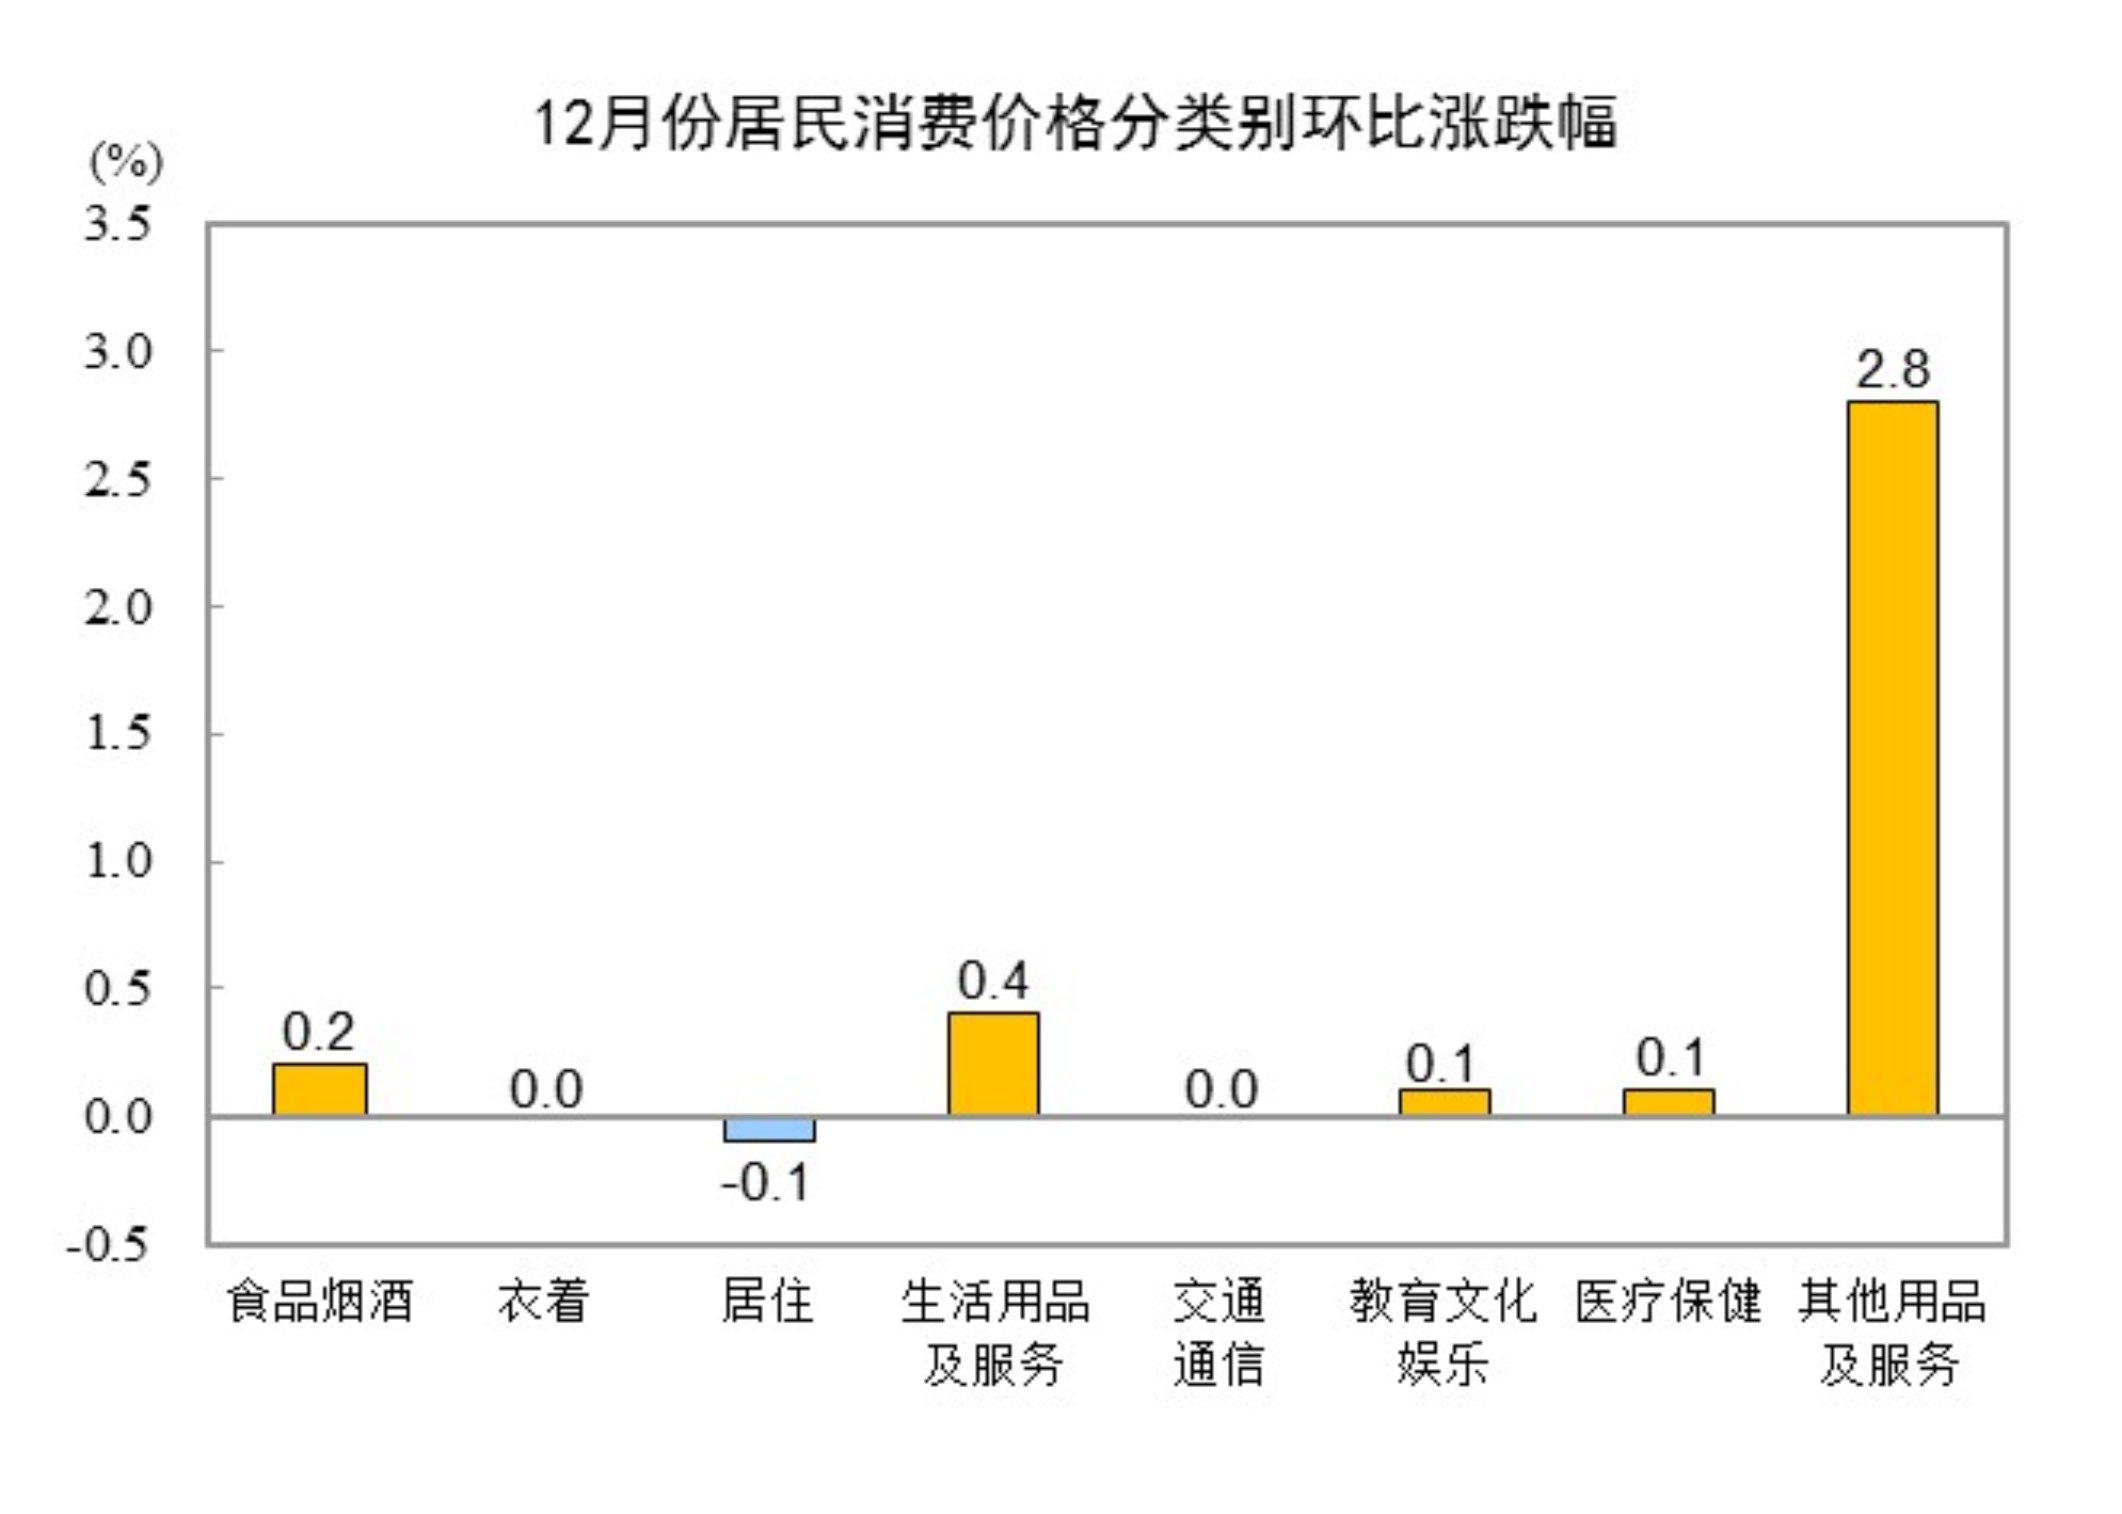
In December, prices for food, tobacco, and alcohol increased by 0.2% MoM, contributing approximately 0.05 percentage points to the rise in the CPI. Within the food category, fresh fruit prices rose by 2.6%, contributing about 0.05 percentage points to the CPI increase; fresh vegetable prices increased by 0.8%, contributing about 0.02 percentage points; prices for livestock meat decreased by 0.8%, contributing about 0.02 percentage points to the CPI decline, among which pork prices fell by 1.7%, contributing about 0.02 percentage points to the CPI decrease.
Among the other seven categories, four saw price increases, two remained flat, and one decreased on a MoM basis. Specifically, prices for other articles and services and household articles and services rose by 2.8% and 0.4%, respectively, while prices for education, culture, and recreation and healthcare both increased by 0.1%; prices for clothing and transportation and communication remained unchanged; housing prices declined by 0.1%.
In December 2025, the YoY Decline in Industrial Producer Ex-Factory Prices Narrowed, While the MoM Increase Expanded
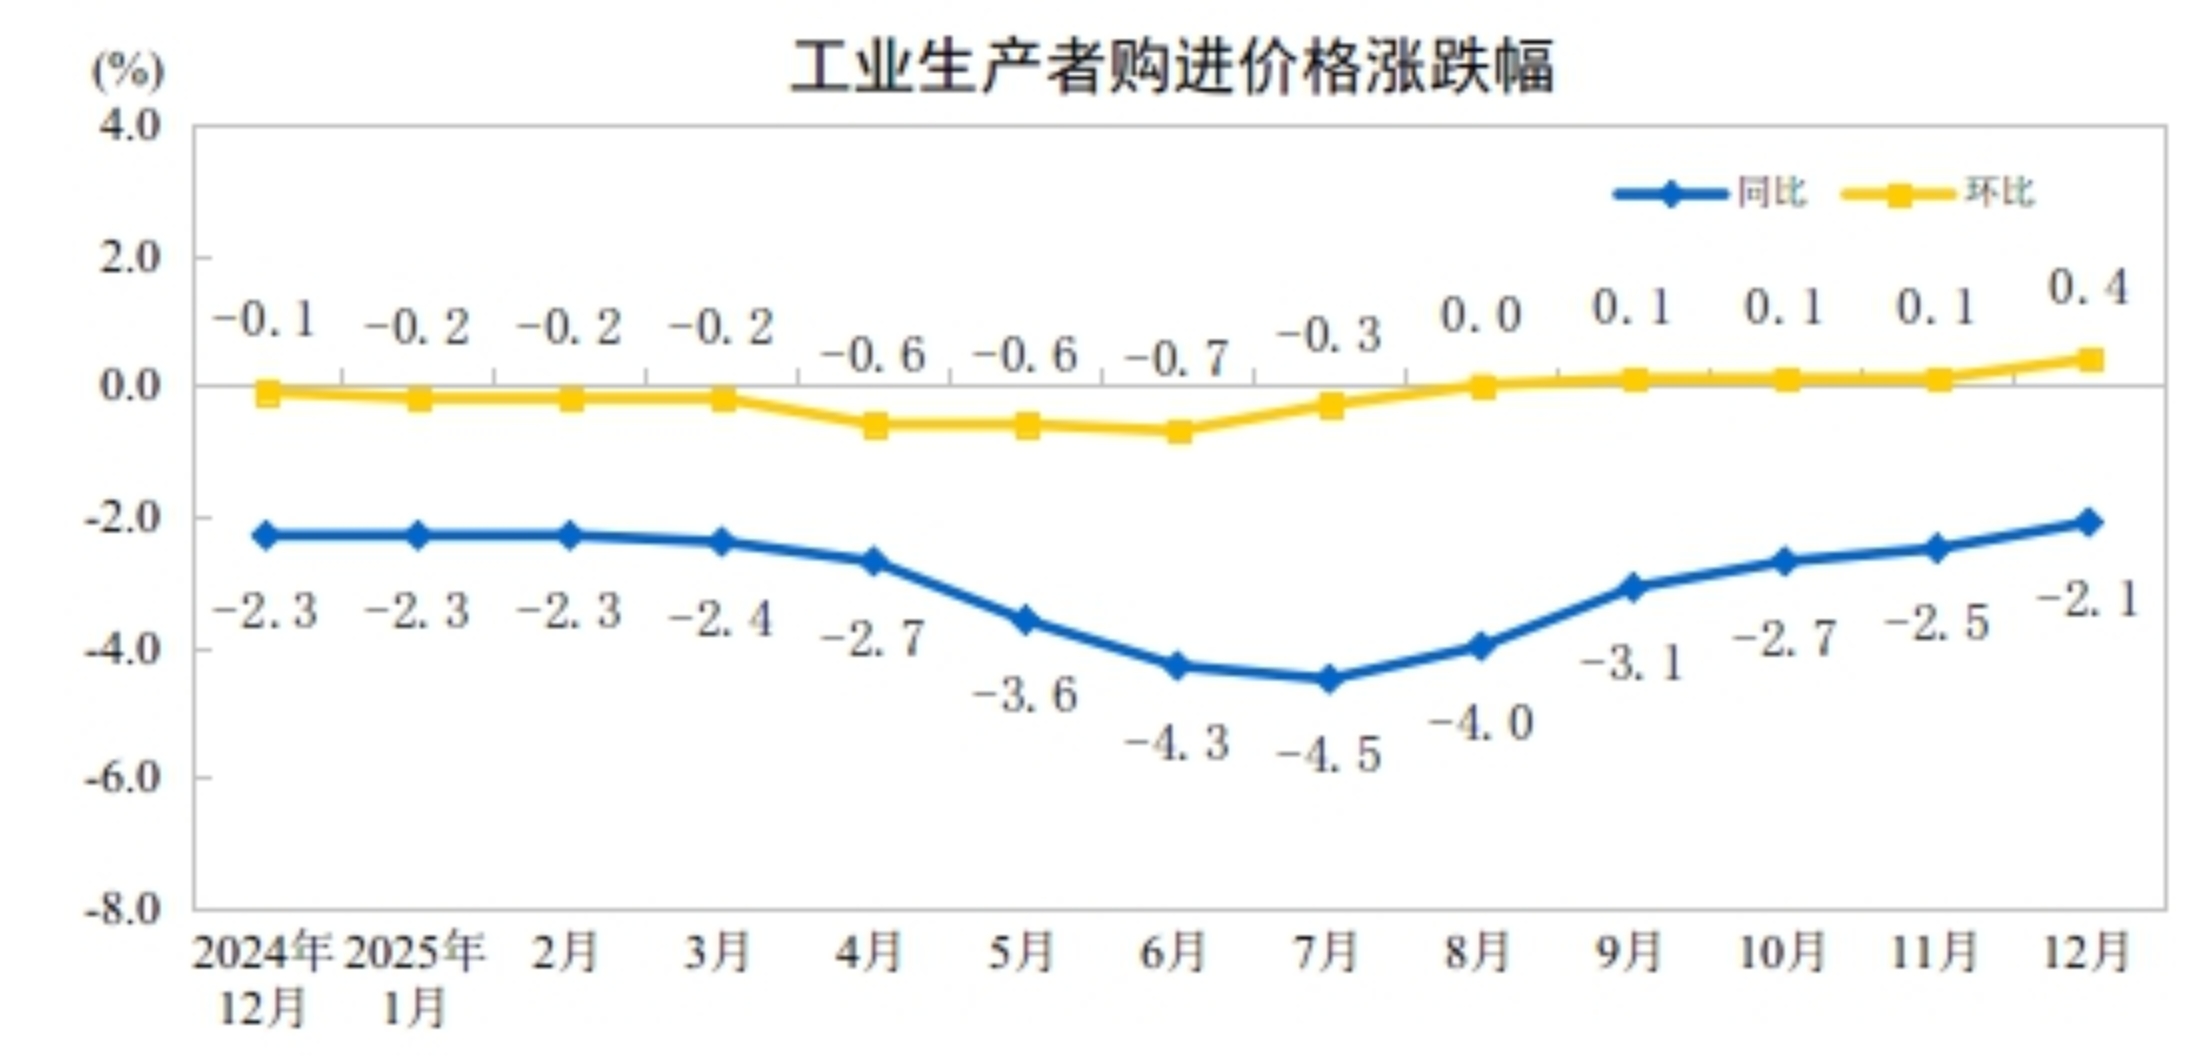
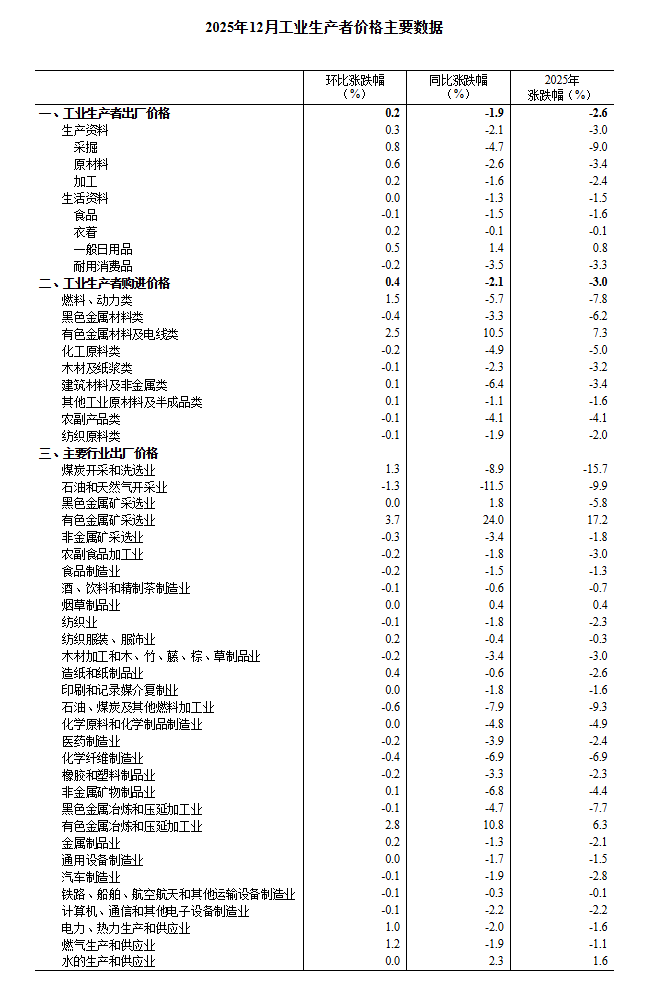
In December 2025, the ex-factory prices of industrial producers nationwide decreased by 1.9% YoY, with the decline narrowing by 0.3 percentage points from the previous month; they increased by 0.2% MoM, with the rise expanding by 0.1 percentage points from the previous month. The purchase prices of industrial producers fell by 2.1% YoY, with the decline narrowing by 0.4 percentage points from the previous month; they rose by 0.4% MoM, with the increase expanding by 0.3 percentage points from the previous month. For the full year of 2025, the ex-factory prices of industrial producers decreased by 2.6%, and the purchase prices of industrial producers dropped by 3.0%.
I. Year-over-Year Changes in Industrial Producer Prices
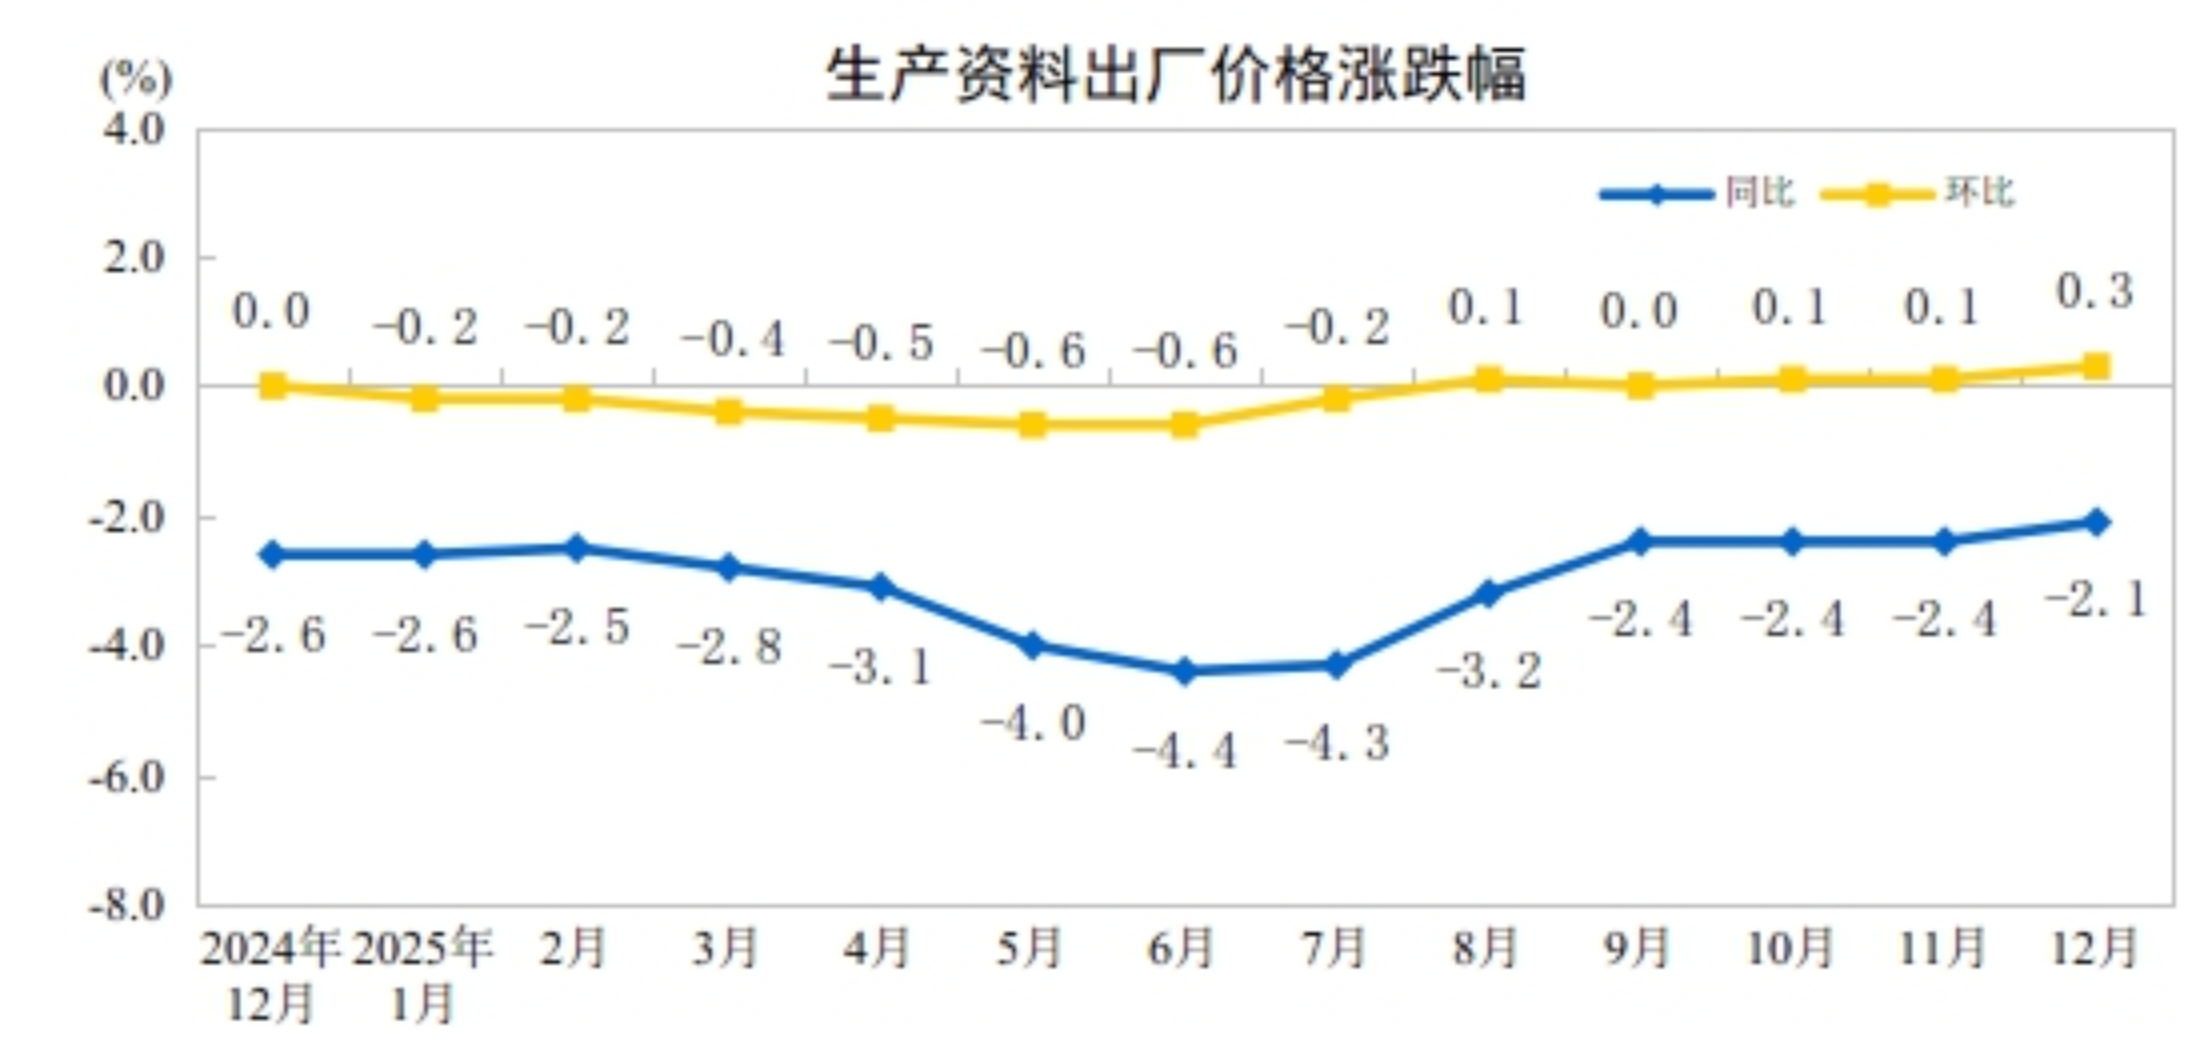
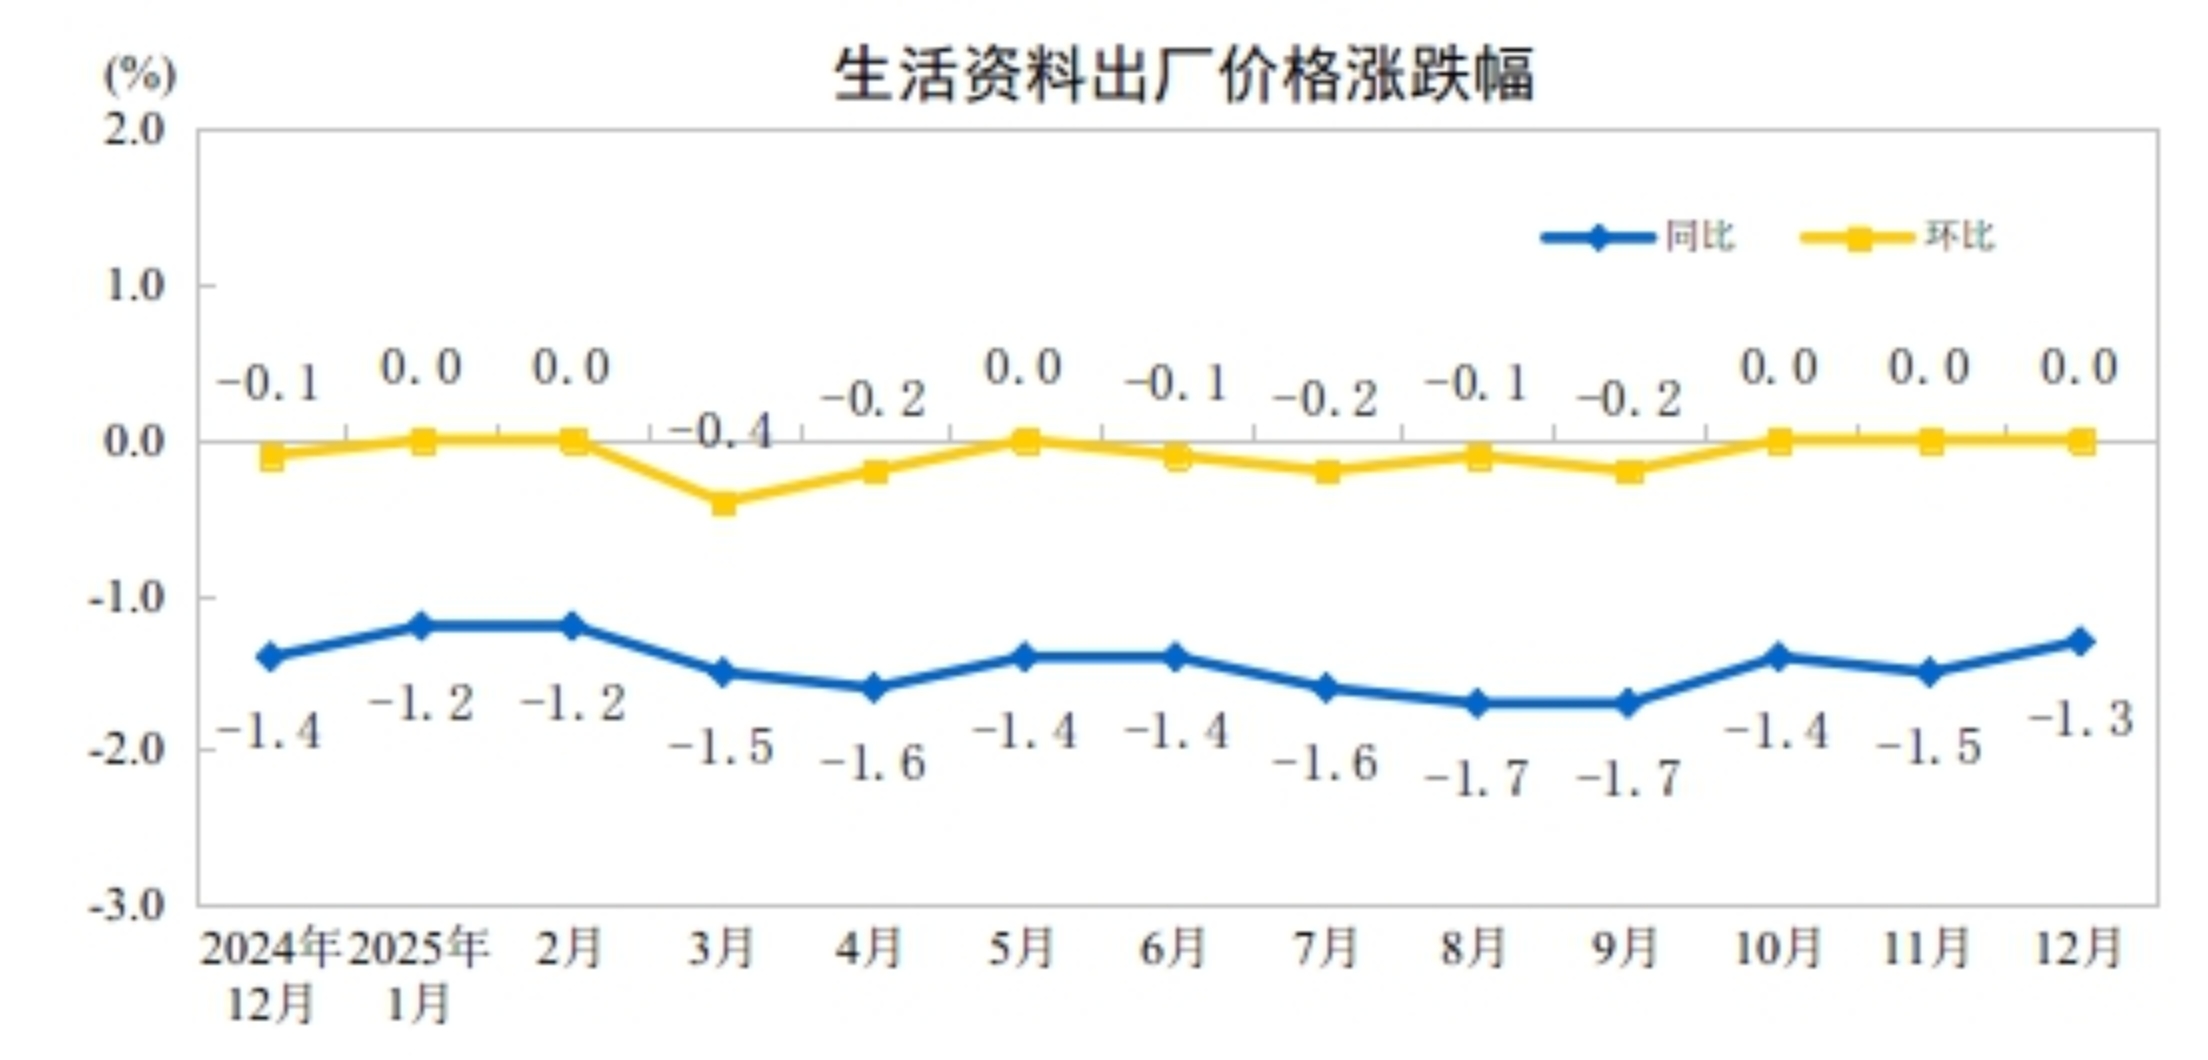
In December, within the ex-factory prices of industrial producers, the price of means of production decreased by 2.1%, contributing approximately 1.53 percentage points to the overall decline in the ex-factory price index. Among these, mining industry prices fell by 4.7%, raw material industry prices dropped by 2.6%, and processing industry prices declined by 1.6%. The price of means of subsistence decreased by 1.3%, contributing approximately 0.35 percentage points to the overall decline in the ex-factory price index. Among these, food prices fell by 1.5%, clothing prices decreased by 0.1%, prices of general daily necessities increased by 1.4%, and prices of durable consumer goods dropped by 3.5%.
Within the purchase prices of industrial producers, prices for building materials and non-metallic products decreased by 6.4%, fuel and power prices fell by 5.7%, chemical raw material prices dropped by 4.9%, agricultural and sideline product prices declined by 4.1%, ferrous metals prices decreased by 3.3%, and textile raw material prices fell by 1.9%; prices for non-ferrous metals and wires increased by 10.5%.
II. MoM Changes in Producer Prices for Industrial Products
In December, ex-factory prices for means of production rose 0.3% MoM, boosting the overall ex-factory price index by approximately 0.24 percentage points. Specifically, prices for mining products increased 0.8%, raw material industry prices rose 0.6%, and processing industry prices edged up 0.2%. Prices for consumer goods remained flat. Within this category, food prices fell 0.1%, clothing prices increased 0.2%, prices for general daily necessities rose 0.5%, and prices for durable consumer goods declined 0.2%.
Among purchased prices for industrial producers, prices for non-ferrous metals and wires climbed 2.5%, prices for fuel and power increased 1.5%, and prices for building materials and non-metals rose 0.1%. Conversely, prices for ferrous metals dropped 0.4%, prices for chemical raw materials decreased 0.2%, and prices for agricultural by-products and textile raw materials both fell 0.1%.
CPI YoY Growth Continued to Widen, PPI YoY Decline Narrowed in December 2025
—Dong Lijuan, Chief Statistician of the Urban Department of the National Bureau of Statistics (NBS), Interprets CPI and PPI Data for December 2025
In December, policies and measures to expand domestic demand and promote consumption continued to take effect, coupled with the approaching New Year's Day, leading to increased consumer demand. The consumer price index (CPI) rose 0.2% MoM and 0.8% YoY. The core CPI, which excludes food and energy prices, increased 1.2% YoY. Influenced by factors such as the transmission effect of international commodity prices and the ongoing effectiveness of policies related to capacity management in key domestic industries, the producer price index (PPI) increased 0.2% MoM but declined 1.9% YoY.
I. CPI Turned from Decline to Increase MoM, YoY Growth Continued to Widen, Core CPI Rose 1.2%
The CPI shifted from a 0.1% decline the previous month to a 0.2% increase MoM. The MoM increase was mainly driven by rising prices of industrial consumer goods excluding energy. Prices for industrial consumer goods excluding energy rose 0.6%, contributing approximately 0.16 percentage points to the MoM increase in CPI. Specifically, the effects of policies to boost consumption continued to show, and with the New Year's Day holiday approaching, residents' shopping and entertainment demand increased, leading to price increases for communication devices, maternal and child products, recreational durable goods, and household appliances, with gains ranging between 1.4% and 3.0%. Influenced by rising international gold prices, domestic gold jewelry prices surged 5.6%. Energy prices fell 0.5%; affected by changes in international oil prices, domestic gasoline prices dropped 1.2%, dragging the CPI down by about 0.04 percentage points MoM. Food prices increased 0.3%, contributing approximately 0.05 percentage points to the MoM rise in CPI. Among them, pre-holiday consumer demand increased, with prices of fresh fruits and shrimp/crab rising by 2.6% and 2.5%, respectively; weather conditions were relatively favorable, and fresh vegetable prices rose by 0.8%, with the increase being 3.3 percentage points lower than the seasonal level; hog capacity remained relatively ample, and pork prices fell by 1.7%.
CPI rose by 0.8% YoY, with the increase expanding by 0.1 percentage points from the previous month, rebounding to the highest level since March 2023. The expansion in the YoY increase was mainly driven by a larger rise in food prices. Food prices increased by 1.1%, with the growth rate widening by 0.9 percentage points from the previous month, contributing approximately 0.17 percentage points more to the YoY CPI increase compared to the prior month. Within food items, price increases for fresh vegetables and fresh fruits expanded to 18.2% and 4.4%, respectively, jointly contributing about 0.16 percentage points more to the YoY CPI increase than the previous month; prices of beef, mutton, and aquatic products rose by 6.9%, 4.4%, and 1.6%, respectively, with all seeing expanded increases; pork prices fell by 14.6%, with the decline narrowing slightly. Energy prices dropped by 3.8%, with the decline widening by 0.4 percentage points from the previous month, among which gasoline prices fell by 8.4%, with the decline expanding. Core CPI, excluding food and energy, rose by 1.2% YoY, maintaining an increase above 1% for the fourth consecutive month. Service prices increased by 0.6%, contributing about 0.25 percentage points to the YoY CPI increase. Among these, household service prices rose by 1.2%; rental prices fell by 0.3%. Prices of industrial consumer goods, excluding energy, increased by 2.5%, contributing about 0.63 percentage points to the YoY CPI increase. Among these, gold jewelry prices continued to expand, rising by 68.5%; prices of household appliances and daily household articles increased by 5.9% and 3.2%, respectively, with both seeing expanded growth; prices of fuel-powered cars and new energy cars fell by 2.4% and 2.2%, respectively, with the declines narrowing.
II. PPI MoM Increase Expanded, YoY Decline Narrowed
PPI rose by 0.2% MoM, marking the third consecutive month of increase, with the growth rate expanding by 0.1 percentage points from the previous month. The main characteristics of this month's PPI MoM performance: First, improved supply-demand structure drove price increases in some industries. The ongoing effects of capacity management and comprehensive rectification of market competition order in key industries continued to show results, with coal mining and washing, and coal processing prices rising by 1.3% and 0.8% MoM, respectively, both increasing for the fifth consecutive month; lithium-ion battery manufacturing prices rose by 1.0%, and cement manufacturing prices increased by 0.5%, both rising for the third consecutive month; new energy vehicle manufacturing prices shifted from a 0.2% decline in the previous month to a 0.1% increase. Seasonal demand increases drove prices in gas production and supply, and production and supply of electric power and heat power to rise by 1.2% and 1.0%, respectively; down processing and wool textile dyeing and finishing processing prices increased by 1.2% and 1.0%, respectively. Second, imported factors led to divergent price trends in domestic non-ferrous metals and petroleum-related industries. Rising international non-ferrous metal prices boosted domestic non-ferrous metal mining and dressing, as well as smelting and pressing prices, up 3.7% and 2.8% MoM, respectively, with silver smelting, gold smelting, copper smelting, and aluminum smelting prices rising 13.5%, 4.8%, 4.6%, and 0.9%, respectively. Falling international crude oil prices led to declines of 2.3% and 0.9% in domestic petroleum extraction and refined petroleum product manufacturing prices, respectively.
The PPI fell 1.9% YoY, with the decline narrowing by 0.3 percentage points from the previous month. Domestic macro policies continued to take effect, with some industries showing positive price changes. First, the development of a unified national market advanced, with YoY declines in related industry prices narrowing for several consecutive months. As market competition order continued to improve, the declines in coal mining and washing, lithium-ion battery manufacturing, and PV equipment and components manufacturing prices narrowed by 2.9, 1.2, and 0.4 percentage points from the previous month, respectively, marking the fifth, fourth, and ninth consecutive months of narrowing. Second, the cultivation of new quality productive fuels drove YoY price increases in related industries. With robust growth in digital economy-related industries, rapid expansion in new raw materials and materials production, and continuous empowerment from green transformation, prices rose for external storage devices and components (15.3%), biomass liquid fuels (9.0%), graphite and carbon product manufacturing (5.5%), finished integrated circuits (2.4%), comprehensive utilization of waste resources (0.9%), and service consumer robot manufacturing (0.4%). Third, effective release of consumption potential boosted YoY price increases in relevant industries. As initiatives to boost consumption were implemented, cultural, sports, and quality consumption grew rapidly, driving price increases for arts, crafts, and ceremonial product manufacturing (23.3%), sports ball manufacturing (4.0%), traditional Chinese musical instrument manufacturing (2.0%), and nutritional food manufacturing (1.5%).