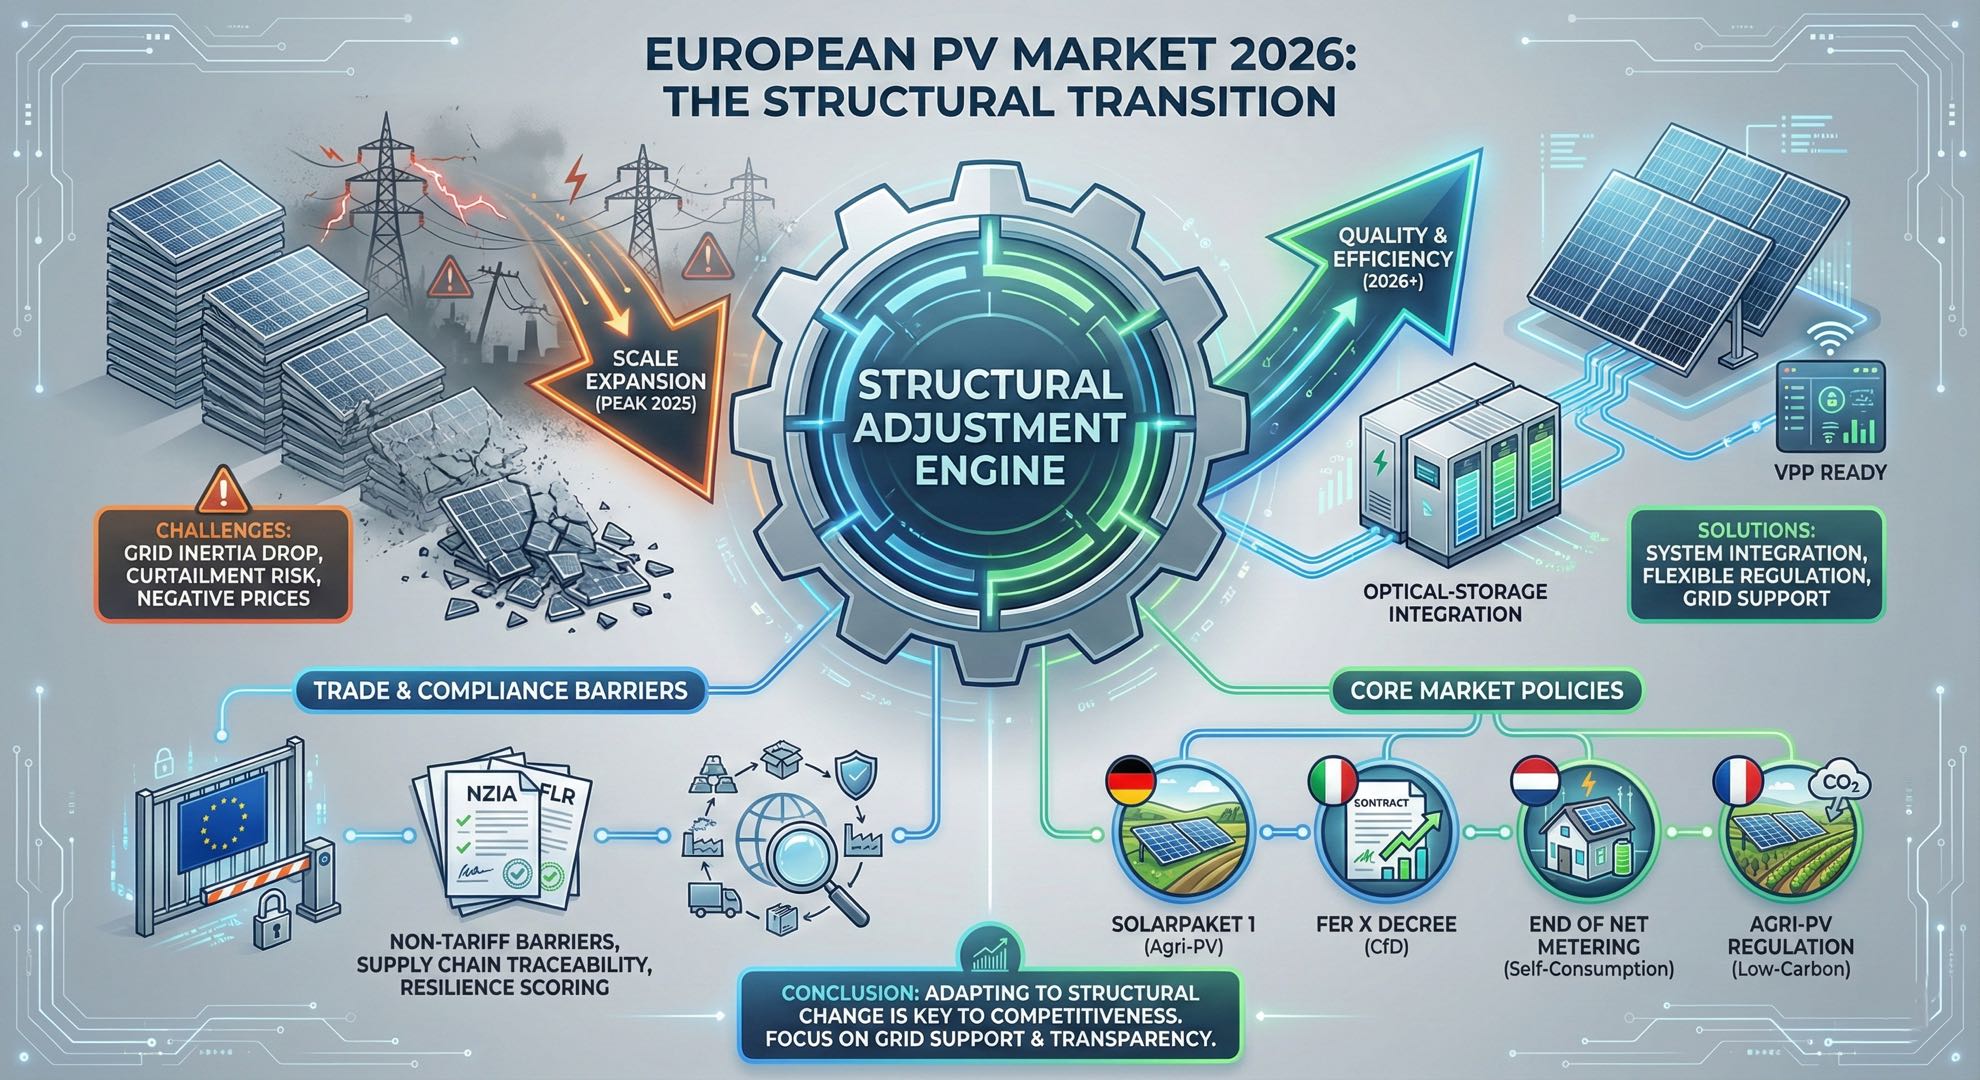
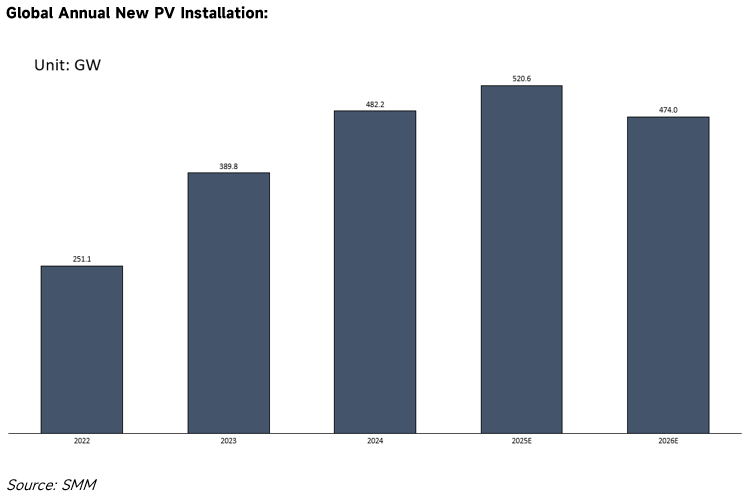
The global photovoltaic (PV) industry is currently on the eve of a cyclical adjustment. According to SMM forecasts, after the peak at 520.6 GW in 2025, global new PV installations are expected to decline to 474 GW in 2026. Against this macroeconomic backdrop, the core driving logic of the European PV market has shifted: the market focus is moving from singular capacity growth to grid operational safety, structural adjustments in trade flows, and the establishment of supply chain compliance.
1.0 Market Status: Breaking Physical Boundaries and System Operational Risks
As the penetration rate of renewable energy increases, the physical characteristics of the European power grid have changed significantly, making system stability a primary factor constraining further market expansion.
Stability Accidents Triggered by Declining Grid Inertia
The blackout incident on the Iberian Peninsula on April 28, 2025, concretely demonstrated the grid vulnerability caused by high proportions of renewable energy integration. Due to the retirement of a large number of traditional thermal power units, system rotational inertia dropped significantly. Under conditions where wind power output decreased sharply (down 58%) and solar power fluctuated due to cloud cover, the grid failed due to a lack of sufficient dynamic voltage control and reactive power support. This resulted in an instantaneous loss of approximately 15 GW of power in Spain and Portugal (accounting for about 60% of the total load). This incident indicates that when renewable energy penetration exceeds 40%, traditional grid regulation mechanisms are difficult to maintain.
Decline in Asset Yields Due to Curtailment
Consumption issues in the Greek market have directly affected project economics. According to data from the Hellenic Association of Photovoltaic Energy Producers (POSPIEF), curtailment volume reached 1.85 TWh in 2025, a ten-fold increase year-on-year, concentrated primarily during the peak generation hours of 9:00 to 16:00. This non-technical power loss has reduced the Internal Rate of Return (IRR) of projects, causing some existing projects to fail to cover financing costs. Consequently, financial institutions have tightened credit issuance for standalone PV generation projects.
2.0 Trade Patterns: Concentration and Inventory Dynamics
Against the backdrop of slowing demand growth, European PV trade presents highly concentrated regional characteristics and has experienced significant inventory fluctuations.
Import Concentration: Divergence in Top Five Core Markets
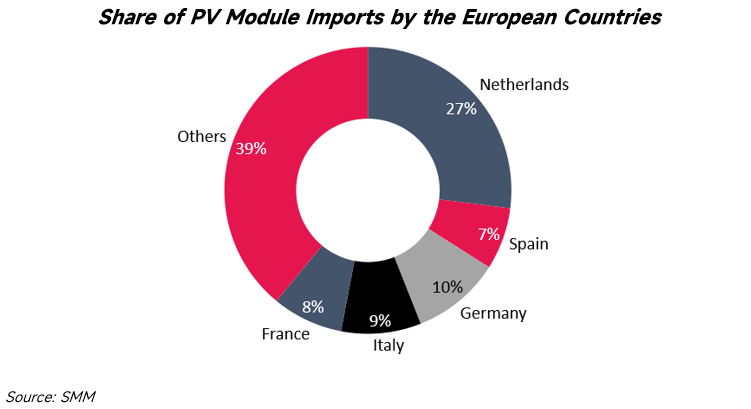
PV product imports and installations are highly concentrated in the following five countries, which determine the supply-demand balance and product flow for the whole of Europe:
- Netherlands: As Europe's largest PV importer, the Netherlands primarily functions as a transit hub. Throughput data from the Port of Rotterdam shows that approximately 60% of imported modules are not installed locally but are transferred via bonded warehouses to Germany and Central/Eastern European markets.
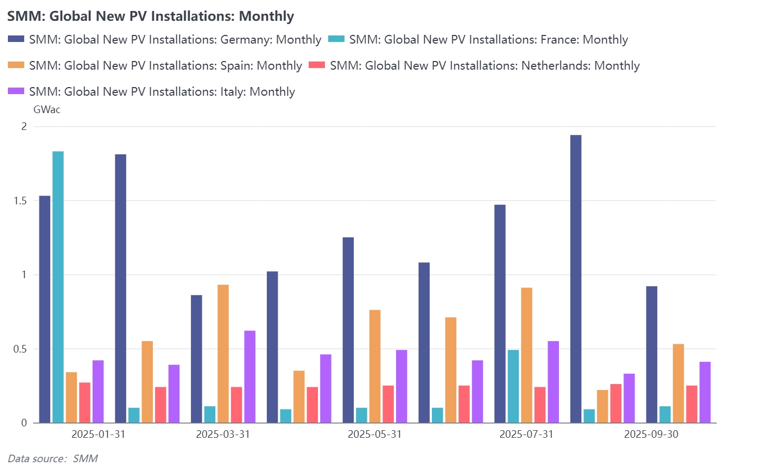
- Germany: Germany's massive installation demand maintains strong import absorption capabilities, driven primarily by continuous growth in Commercial & Industrial (C&I) rooftops and balcony solar systems.
- Spain: Import demand is mainly driven by large Utility-scale projects. However, constrained by the speed of grid connection approvals, module procurement shows distinct cyclical fluctuations.
- Italy: With policy support for residential and C&I sectors, Italy has returned to the ranks of the top five PV markets, with a significantly increased share of demand for high-efficiency N-type modules.
- France: Constrained by Carbon Footprint (ECS) certification requirements, France has the strictest import standards. Market share primarily flows to products with low-carbon certification, creating a segment distinct from the general circulation market.
Inventory Dynamic Analysis: From Peak Accumulation to Oscillating Balance
According to SMM data, the European market experienced a complete "Accumulation-Destocking-Rebalancing" cycle between 2024 and 2025.
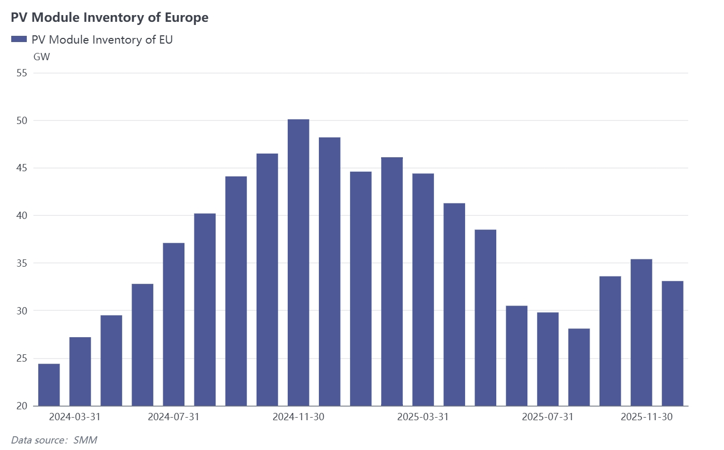
- 2024: Continuous Accumulation Phase. Data shows that European module inventory presented a unilateral upward trend in 2024. Total inventory grew continuously from approximately 25 GW at the beginning of the year to a peak exceeding 50 GW in November 2024. This data reflects that distribution channels adopted aggressive stocking strategies during this period, resulting in supply far exceeding actual installation demand.
- First half of 2025: Deep Destocking Phase. Entering 2025, market inventory levels fell rapidly. By June 2025, total inventory dropped to an annual low of approximately 30 GW. The quarter-on-quarter growth curve shows that inventory fell by nearly 20% in the second quarter, indicating that distributors significantly reduced new procurement during this period to prioritize clearing accumulated stock.
- Second Half of 2025: Oscillation and On-Demand Procurement. Starting from the third quarter of 2025, inventory trends began to fluctuate. In September, the month-on-month inventory growth rate rebounded to nearly 20%, with volumes rising back to around 35 GW, before falling again in November. This fluctuation indicates that the market has ended the pure destocking mode and shifted to dynamic adjustments based on project progress. Current inventory levels (approximately 33 GW) are significantly lower than the 2024 peak, showing that supply-demand relations have tended towards rationality, though monthly fluctuations reflect increased supply chain sensitivity to policy and demand changes.
3.0 Policy Environment: Non-Tariff Barriers and Compliance Frameworks
Between 2024 and 2025, the EU established a regulatory framework centered on the Net-Zero Industry Act (NZIA) and the Forced Labour Regulation (FLR). This policy combination alters supply chain entry rules by setting compliance thresholds, directly impacting China-EU trade flows.
Net-Zero Industry Act (NZIA): Adjusting Procurement Standards
The NZIA modifies review standards for public procurement and renewable energy auctions, reducing the weight of price factors.
- Non-Price Criteria: The Act mandates the introduction of indicators such as environmental sustainability and supply chain resilience in tender scoring, with the weight of these indicators required to exceed 30%.
- Supply Chain Concentration Limit: If more than 50% of the tendered products originate from a single non-EU country, the supply chain resilience score will be negatively adjusted.
- Market Impact: This mechanism leads to increased system costs. Taking the 2025 tender in Italy as an example, winning bid prices rose by approximately 17% year-on-year due to supply chain origin requirements, indicating that the market is paying a premium to meet supply chain diversification and safety requirements.
Forced Labour Regulation (FLR): Mandatory Supply Chain Traceability
This regulation imposes strict traceability requirements on global supply chains. As 2025 serves as a critical window for companies to perfect their traceability systems, entities unable to provide complete proof of supply chain transparency face administrative penalties, including product bans or mandatory withdrawal from the market. Compliance costs have become a necessary operating expense for entering the European market, extending the decision-making cycle for European buyers and shifting the trend from mass stocking to on-demand procurement.
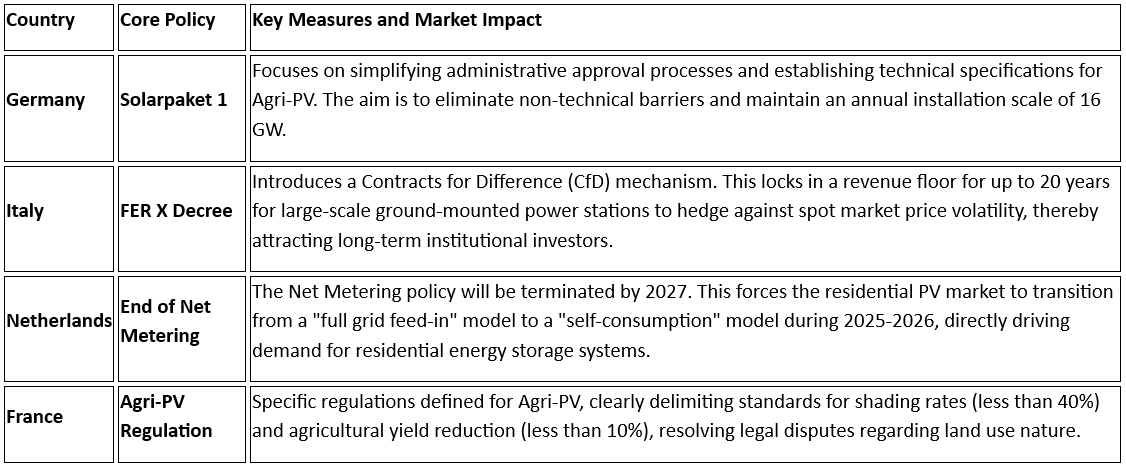
4.0 Differentiated Policies of Core Member States
To address the aforementioned challenges, major European nations have implemented targeted policy adjustments based on their specific stage of energy transition:
5.0 Technical Trends: Optical-Storage Integration and System Integration
Operating data from the European power market indicates that the standalone PV generation model is no longer adequate for current grid regulation needs. Energy storage and system integration technologies have become necessary conditions for market access.
The European power market faces a time mismatch between peak daytime PV generation and actual electricity load, leading to electricity surpluses around noon and frequent negative electricity price phenomena. This causes direct economic losses for PV power stations without storage systems that feed into the grid during these periods. Influenced by this market price mechanism, demand for storage configuration has risen rapidly, driving significant growth in installed capacity.
According to International Energy Agency (IEA) data, new energy storage installations in Europe approached 30 GWh in 2025, a year-on-year increase of 39%; notably, large-scale storage installations in Germany grew by 180%. Accompanying this trend, the focus of market demand is shifting from standalone PV module products to integrated systems containing PV, energy storage, and Virtual Power Plant (VPP) interfaces. In the electricity spot market, assets that possess flexible regulation capabilities and can respond to grid dispatch instructions will maintain competitiveness, while pure PV projects lacking regulation functions face the risk of being eliminated by the market.
The European PV market in 2026 is poised to undergo a critical period of transition from scale expansion to quality and efficiency. Under the dual constraints of physical grid safety and compliance barriers, market requirements for products have extended to include grid support capabilities and supply chain transparency. For market participants, adapting to this structural change is the key to maintaining competitiveness.
Written by: Ryan Tey
![[SMM PV News] Armenia Hits 1.1 GW Solar Capacity,](https://imgqn.smm.cn/usercenter/qQwIB20251217171741.jpg)
![Spot Market and Domestic Inventory Brief Review (February 5, 2026) [SMM Silver Market Weekly Review]](https://imgqn.smm.cn/usercenter/tSwaX20251217171735.jpg)