1. Introduction
The European Union’s Carbon Border Adjustment Mechanism (EU’s CBAM) took a decisive step from its pilot phase towards actual enforcement in December 2025, only a month before it becomes effective January 2026. The aluminium sector, with a total trade value of USD 448 billion in 2024, faces CBAM's carbon-accounting requirements alongside five other high-carbon sectors. Changes look to favour low-carbon production through responsible sourcing of raw materials and energy usage, as well as rewarding countries taking initiatives to implement equivalents to CBAM. On the flip side, CBAM imposes higher costs on trading partners of aluminium products with high-carbon emission. This series of policies will likely raise aluminium products prices for consumers in the EU in the short-term, and reshape aluminium’s trade flow for years to come. This article will cover CBAM basics and frameworks, incorporate the newest updates of the December 17 package and provide aluminium sector-specific implications and outlooks.
2. CBAM Operational Framework and Compliance Timeline
Quoted from the EU’s webpage, CBAM is “the EU’s tool to put a fair price on carbon emitted during the production of carbon-intensive goods that are entering the EU, and to encourage cleaner industrial production in non-EU countries.” Running parallel to the EU Emissions Trading System (ETS), CBAM steps in as ETS free allowances are phased out to level the playing field between local producers in Europe and foreign imports, alongside pushing global players towards sustainable players through prevention of carbon leakage.
Currently, the EU CBAM is still within its pilot phase, or commonly known as its transitional period, which lasts from October 2023 up until December 2025. During this phase, importers need to report embedded carbon of certain goods every quarter, but are not required to buy any CBAM certificates in relation to amount of imported carbon, meaning no financial obligations during this time frame. As the timeline rolls into January 2026, CBAM enters its implementation phase. Now instead of quarterly reports and no financial obligations, importers will have to buy and surrender CBAM certificates. In 2026, importers need to accumulate reporting data and purchase certificates retroactively in early 2027. By 2027, importers will need to have enough CBAM certificates to cover at least 50% of embedded emissions since the start of the same calendar year by every quarter. In addition to embedded emissions, starting from 2026, there will also be phase-in percentages to be considered, as well as any relevant and recognised equivalents to CBAM in the origin country that have already been paid.
3. 2025 December CBAM Package Updates and Overview
Briefly, important changes to CBAM announced in December 2025 include the expansion of included products to downstream products, anti-circumvention and pre-consumer scrap rules, and the introduction of a temporary decarbonisation fund:
- Expansion of products covered: 180 new steel and aluminium related downstream products will be introduced into CBAM starting 2028, such as automotive components and machinery.
- Anti-circumvention and pre-consumer scrap rules: The embedded emissions from pre-consumer scrap (especially for aluminium) is now included within calculations, closing certain loopholes that importers/exporters could take to wrongful claims of low-carbon material usage.
- Temporary decarbonisation fund: 25% of CBAM revenue in 2026 to 2027 will be placed into a temporary decarbonisation fund for smelters and processors at risk of carbon leakage, which will reimburse a portion of the EU-ETS carbon costs for goods still facing carbon leakage risks, with support contingent upon demonstrated decarbonisation efforts.
4. Embedded Emissions and Calculation Rules
Prior to any calculation mechanisms, it is crucial to know which aluminium products (or materials) are included within CBAM’s scope for 2026. Following are the HS/CN codes of affected aluminium products starting January 2026:
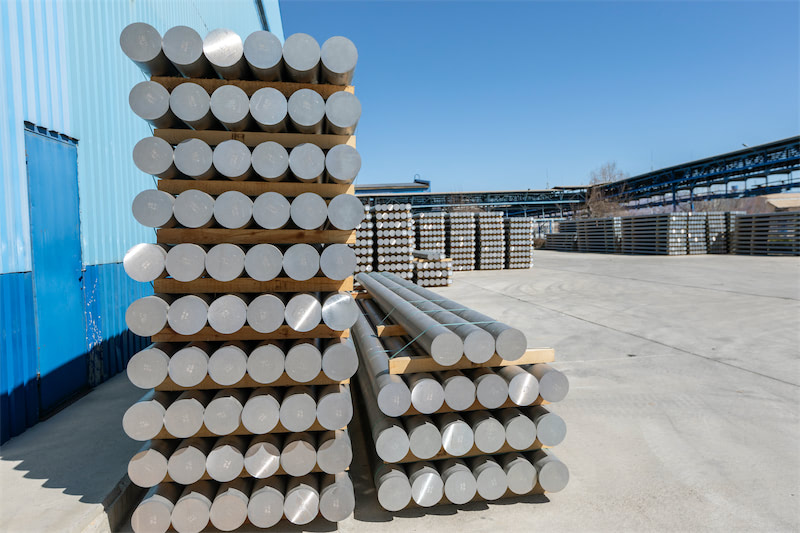
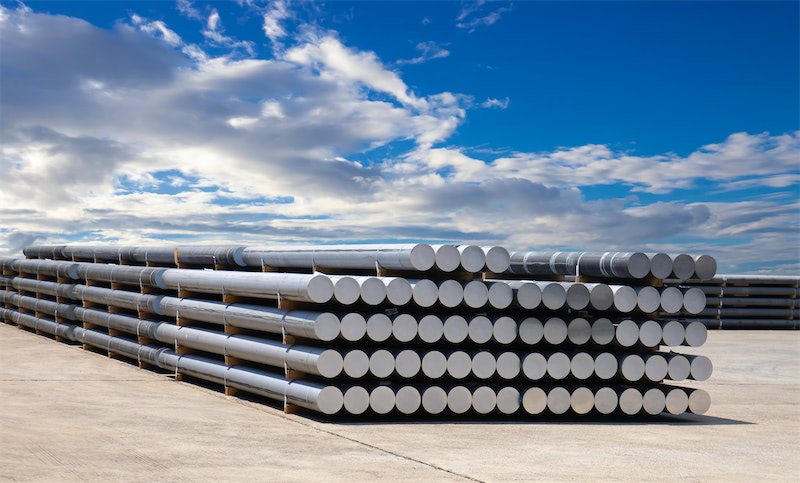
- 7601 Unwrought aluminium
- 7603 Aluminium powders and flakes
- 7604 Aluminium bars, rods and profiles
- 7605 Aluminium wire
- 7606 Aluminium plates, sheets and strip, of a thickness exceeding 0,2 mm
- 7607 Aluminium foil of a thickness (excluding any backing) not exceeding 0,2 mm
- 7608 Aluminium tubes and pipes
- 7609 00 00 Aluminium tube or pipe fittings
- 7610 Aluminium structures and parts of structures; aluminium plates, rods, profiles, tubes and the like, prepared for use in structures
- 7611 00 00 Aluminium reservoirs, tanks, vats and similar containers, for any material of a capacity exceeding 300 litres
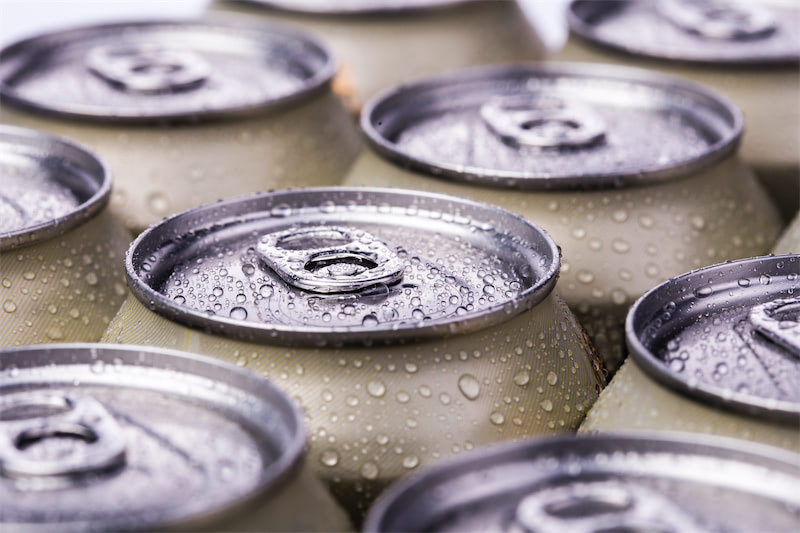
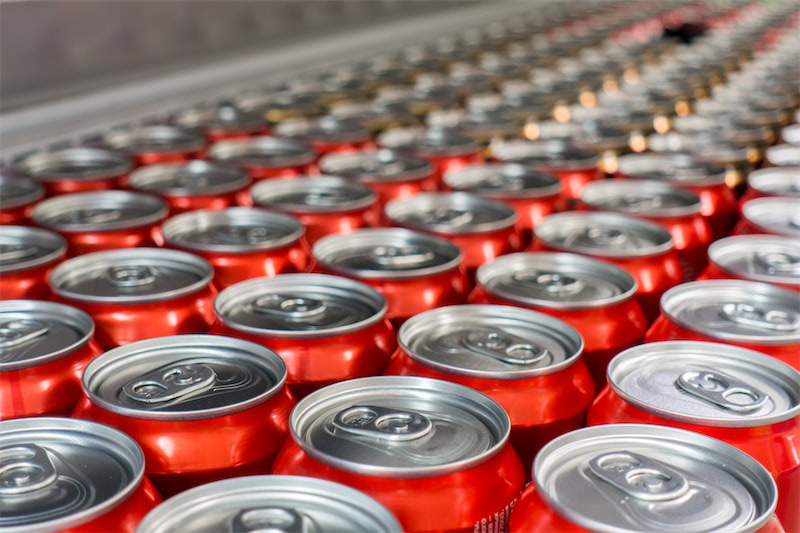
- 7612 Aluminium casks, drums, cans, boxes and similar containers for any material of a capacity not exceeding 300 litres
- 7613 00 00 Aluminium containers for compressed or liquefied gas
- 7614 Stranded wire, cables, plaited bands and the like, of aluminium, not electrically insulated
- 7616 Other articles of aluminium
By 2026, in its very first implementation phase, most primary and semi-finished aluminium products are included within CBAM’s framework, whereas scrap aluminium and certain complex downstream goods (7602, 7615) are not included. By 2028, pre-consumer scrap should be incorporated into CBAM’s frameworks, as well as certain downstream, complex, assembled goods such as car doors, but most of the latter falls into other HS categories and not 7615.
In response to this carbon leakage, the EU came up with CBAM to cover embedded carbon emissions from raw materials, semis and end-products imported into the EU not under the EU’s ETS system. CBAM will cover Scope 1 emissions, Scope 2 emissions and emissions from certain precursors, each starting at different chronological points based on new expansions of CBAM in 2028 and revisions due 2030.
- Scope 1 emissions: Direct emissions generated from “activities a manufacturer owns or controls” during production, including process emissions from alumina electrolysis and fuel combustion in melting/casting processes for secondary aluminium and semis. This will be the main emissions calculations for CBAM in 2026.
- Scope 2 emissions: Indirect emissions from electricity in production, including hydro, solar and coal which is a large factor accounting for total embedded carbon, especially for primary aluminium production. The calculations for Scope 2 emissions will not start in 2026, and will start from a later date.
- Emissions from certain precursors: Direct and indirect emissions of materials used in production. This includes alumina for primary production, scrap for secondary production and semis used in the assembly of complex products (car doors, washing machines etc.). Emissions from pre-consumer scrap and alumina among other precursors will not yet be included by 2026. By 2026, only precursor semis/materials that are already included in CBAM’s definite list for 2026 will be calculated.
Scope 1 emissions rarely have big differences across geographical regions, and remain relatively stable. In comparison, Scope 2 indirect emissions are mostly going to be one of the key decisive competitive variables for aluminium in CBAM, as different smelters adopt different power sources. In hydropower grids compared to coal grids, indirect emissions differ by a huge margin, leading to most of the competitive difference in between products being imported into the EU through CBAM from different geographical regions. Smelters and producers globally are then incentivised to invest in renewable and sustainable energy practices, especially if Europe remains as an important export market for said country. New rules regarding pre-consumer scrap have also been introduced, holding pre-consumer scrap and its embedded carbon emissions responsible within the calculations as well. This prevents producers from purchasing pre-consumer scrap from a high-carbon production line and falsely claiming “zero emissions” from usage of said material.
Within the EU, there is also the ETS (Emissions Trading System) which is currently in implementation. When CBAM is officially launched and implemented in 2026, the problem of having to pay both the EU ETS and EU CBAM costs. circumvent this, CBAM obligation is reduced by the amount of free allocation under EU ETS, this is reflected under the phase-out value, which will be explained later in more detail. In order to prevent issues of CBAM and ETS costs overlapping and being calculated on top of each other, the EU set a phase-in value for CBAM directly mirroring the EU ETS’s reduction in free allocations. This ensures that locally produced goods are not charged under both carbon-related frameworks, which could lead to high costs.
5. Benchmark Values for Aluminium
Benchmarks are the basis for CBAM’s policy, being the baseline value of embedded carbon emissions within each tonne of a product. CBAM benchmarks are calculated by the European Commission through a methodology: in brief the EU collects data - from installations across covered sectors, and takes the 90th percentile (or close to the 90th percentile) to represent “efficient modern installation” performance. In the December 2025 package, benchmarks for many aluminium codes were lowered, and the benchmarks will stay effective for the implementation phase 2026-2030, to be reviewed again by 2030 for 2031-2035. The table below are the newest benchmark values for aluminium products affected by CBAM, updated as of 17th December 2025. BMg* is used when actual emission values are provided, and BMg is used when default values (explained in the next section) are used for calculations. K is used when most of the product is produced by primary aluminium, and L is used for carbon emission calculations when more than 50% of the product is produced using secondary aluminium, such as scrap.
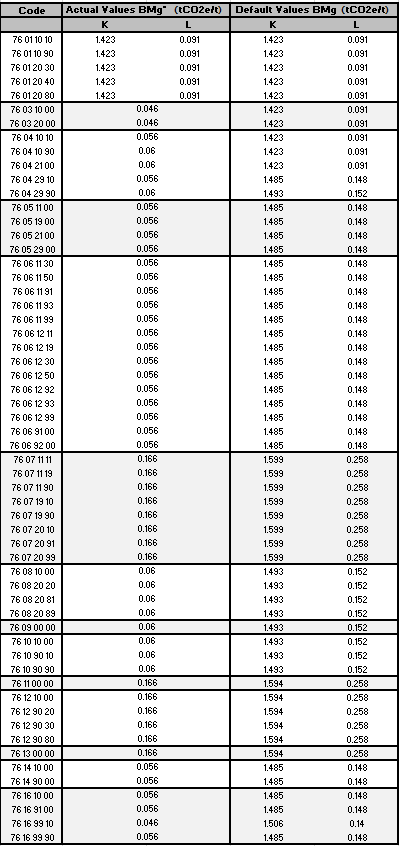
Table 1: CBAM Aluminium Materials/Products Benchmark Values
6. EU Default Values for Aluminium: Design and Application
Before diving in, what are default values? These are newly introduced conservative estimates of embedded emissions provided by the European Union when an importer within the EU is unable to obtain actual or certified emissions data from their suppliers, published as of December 2025. Default values can also be used when the framework permits its usage during the calculation of carbon emissions of components of complex, assembled end-products (such as machinery and automotive parts). This is used to prevent underestimation of embedded emissions, as well as to provide an alternative for importers to trade if they or their overseas suppliers lack sufficient certifications or access to certify the embedded carbon emissions of a certain product. Different countries and product have different default values, all estimated by the EU through calculations of approximate product embedded emissions and national grid carbon intensity values; defaults are usually skewed higher to prevent underestimation and to promote other nations to pivot towards cleaner and more sustainable energy grids for production. These default values are set for 2026-2027, and will be reviewed again by December 2027 based on actual emissions data collected throughout the first two years of implementation. For aluminium specifically, there will also be a mark-up value for defaults, starting at 10% for 2026, 20% in 2027 and 30% when the CBAM scope is expanded by 2028. This allows for importers and non-EU exporters to slowly transition from defaults to actual data if they aren’t able to obtain relevant certificates right in 2026.
Detailed information can be obtained from the “Annex to Implementing Act on Default Values” published on the EU Taxation and Customs Union’s CBAM page. Below are certain default values for selected products and countries outside the EU:
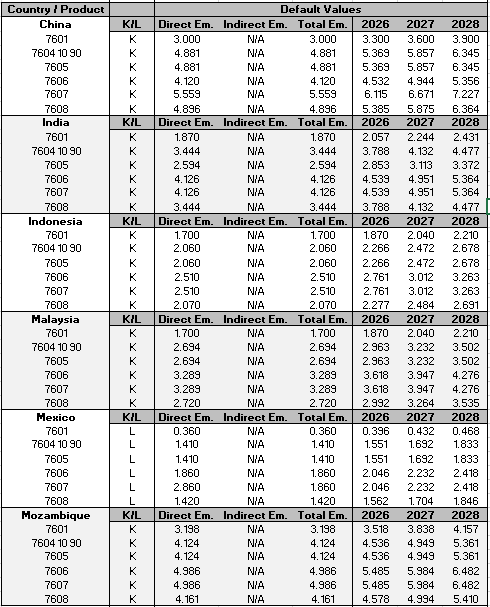
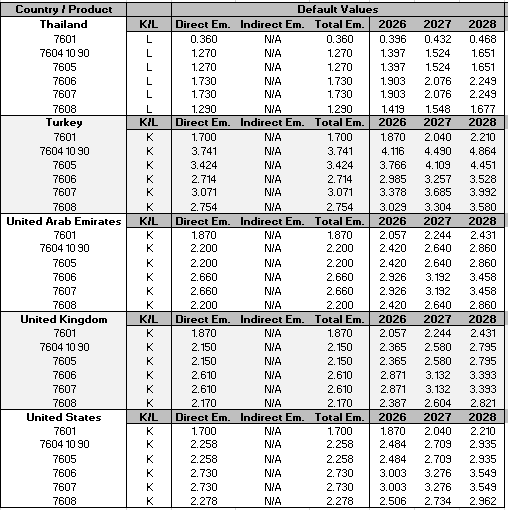
Table 2: CBAM Country and Product Default Values and Mark Up Values
7. Phase‑In Rates and Effective Carbon Cost Under CBAM
As explained earlier, even though CBAM and EU ETS run parallel to each other, measures are taken to ensure that double-carbon pricing is not carried out on relevant imports for aluminium and other sectors. Hence, as EU ETS free allocation decreases, CBAM phase-in values increases, creating a mirrored trajectory where EU producers and importers can deal with trade smoothly, and preventing any scenarios where the cost burden over-pressures local wholesalers. As of December 2025, phase-in rates for CBAM are as follows:
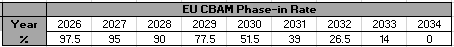
Table 3: CBAM Annual Phase In Rate
Important to note is that even though the CBAM phase-in and default values mark-up both ramp up around the same time frame, they are independent of each other, and each separately contribute to the final import CBAM price.
8. Putting It Together: CBAM Cost Calculations in Practice
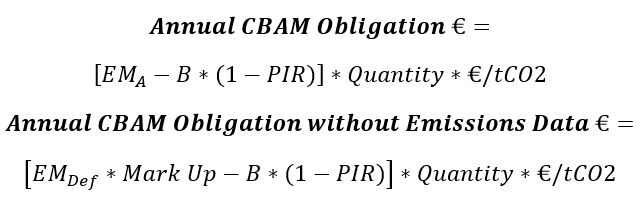
EMA Actual certified total emissions of a product of a certain quantity
EMDef Default emissions of a product; refer to Table 2
B Benchmark values for product, primary or secondary; refer to Table 1
PIR Phase-in Rate, CBAM annual phase-in values; refer to Table 3
Mark Up Mark up rate of aluminium products, 10%: 2026, 20%: 2027, 30%: 2028
Quantity Mass of products imported, in tonnes
€/tCO2 Euro per tonne of embedded carbon, price determined by weekly average of EU Allowances auction clearing prices
All of the values needed for calculations are provided in previous sections of the article to refer back as required. Calculations for import products for aluminium are straightforward, especially with values already provided ahead of time. Following are some examples with default values:
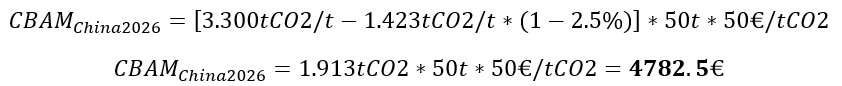
Example 1: Import of 50 tonnes of 7601.10.10 (all primary) from China in 2026, given price at 50€/tCO2
Example 2: Import of 200 tonnes of 7607.11.11 (all secondary) from Mexico in 2028, given price at 75€/tCO2.

9. Conclusion
Asian aluminium exporters will increasingly compete on carbon performance rather than headline prices once CBAM is fully in force. For most major Asian suppliers, CBAM charges will be driven by verified embedded emissions and data quality, so under‑reporting or relying on conservative default values will quickly erode any cost advantage from cheaper production. Exporters should therefore prioritise robust carbon tracking systems, access to plant‑level emissions data, and alignment with CBAM benchmarks and reporting rules in order to minimise effects of trade and environmental policies on existing competitive advantages.