According to data from the National Bureau of Statistics (NBS), in November 2025, the national consumer price index (CPI) rose 0.7% YoY. Specifically, urban areas rose 0.7%, rural areas rose 0.4%; food prices rose 0.2%, non-food prices rose 0.8%; prices of consumer goods rose 0.6%, prices of services rose 0.7%. On average from January to November, the national CPI remained flat compared with the same period last year. In November, the national CPI fell 0.1% MoM. Specifically, urban areas fell 0.1%, rural areas remained flat; food prices rose 0.5%, non-food prices fell 0.2%; prices of consumer goods rose 0.1%, prices of services fell 0.4%.
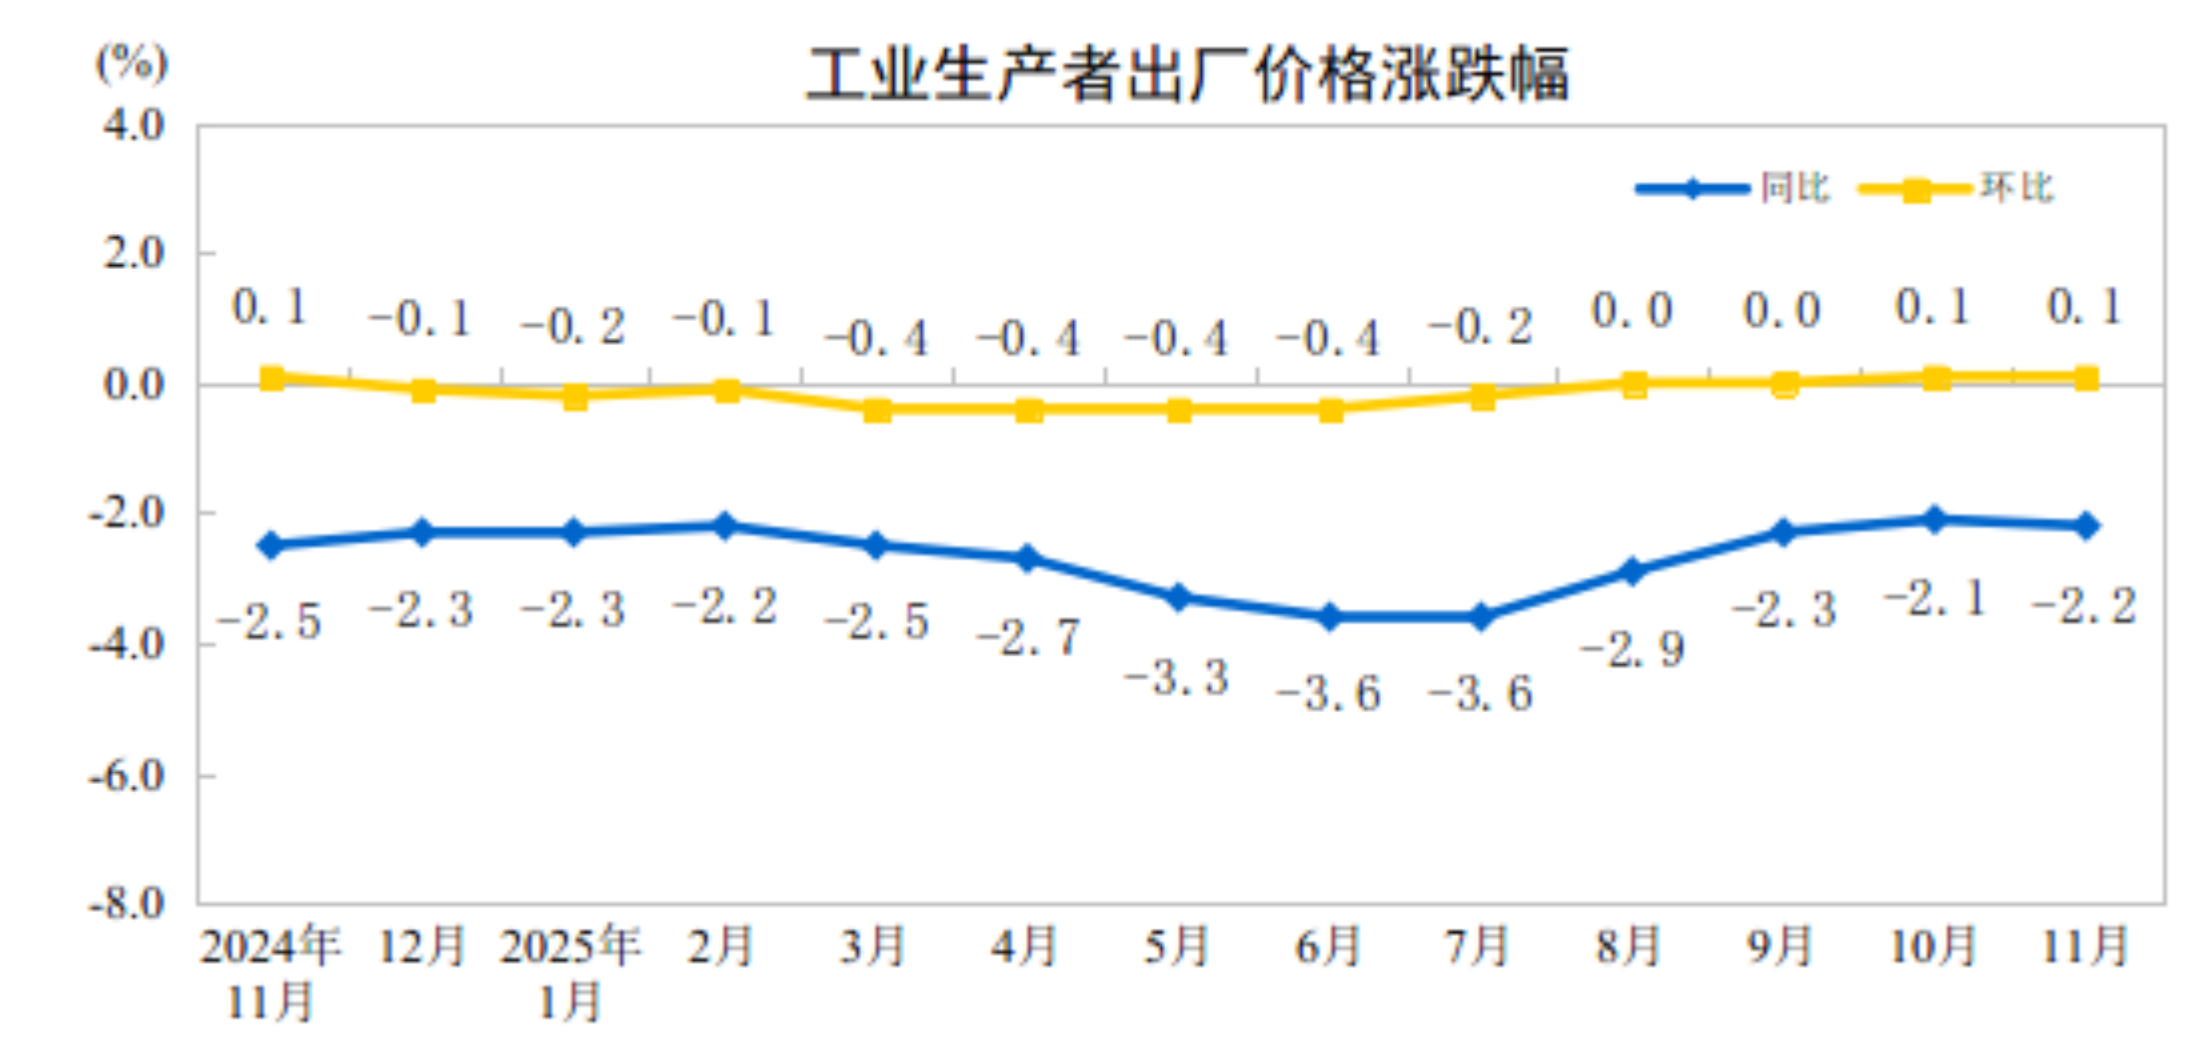
In November, influenced by factors such as optimization of the supply-demand structure in some domestic industries and transmission of international commodity prices, the producer price index (PPI) rose 0.1% MoM and fell 2.2% YoY.
Dong Lijuan, Chief Statistician of the NBS Department of Urban Society, interpreted the CPI and PPI data for November 2025.
Consumer prices rose 0.7% YoY in November 2025
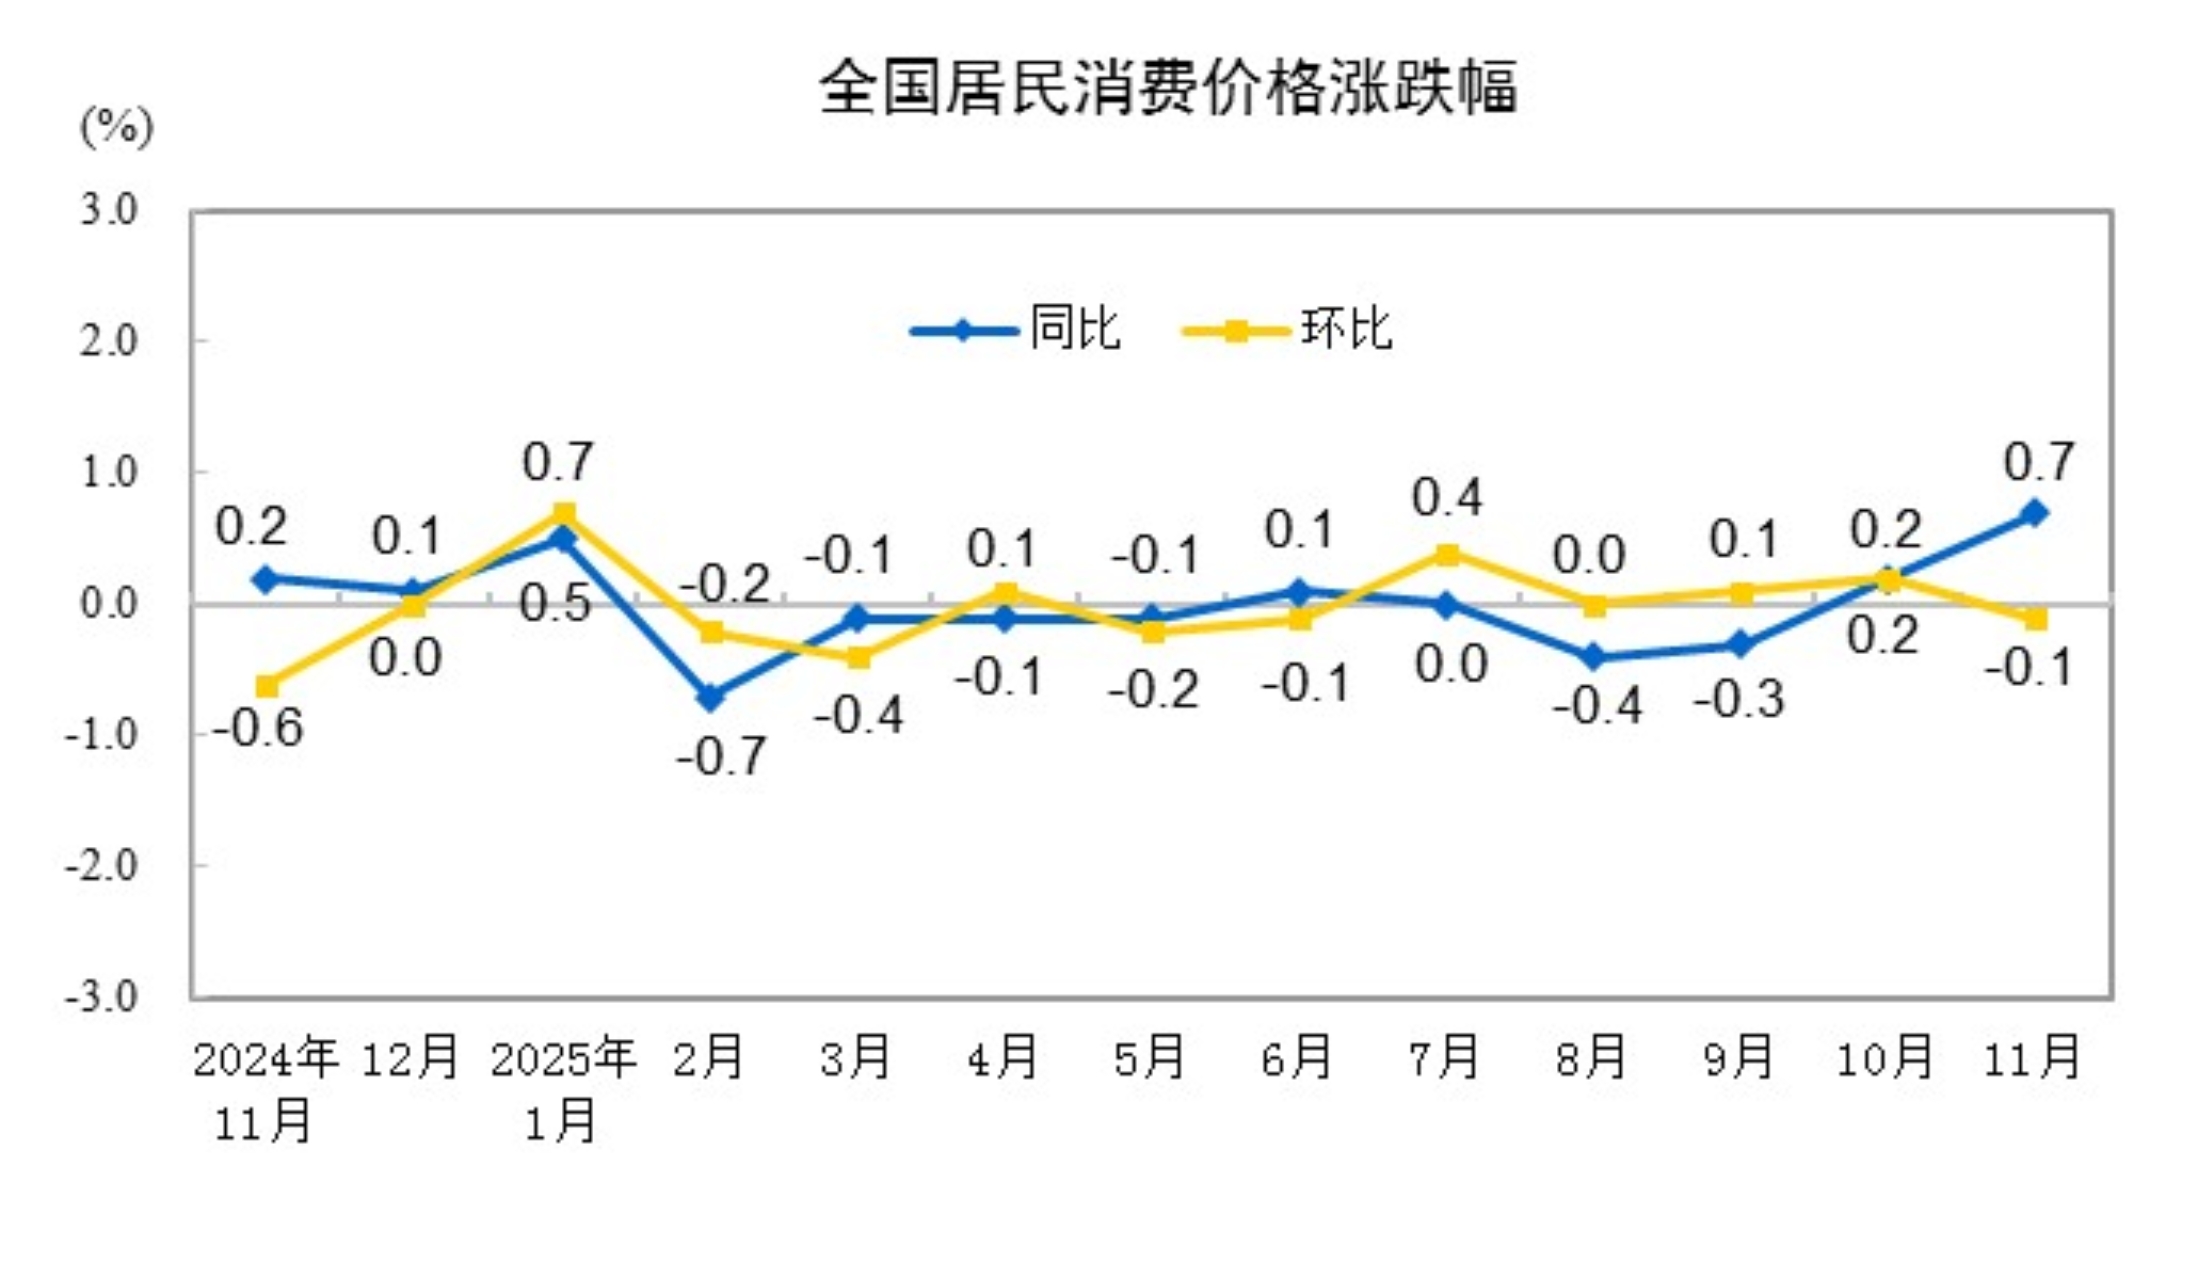
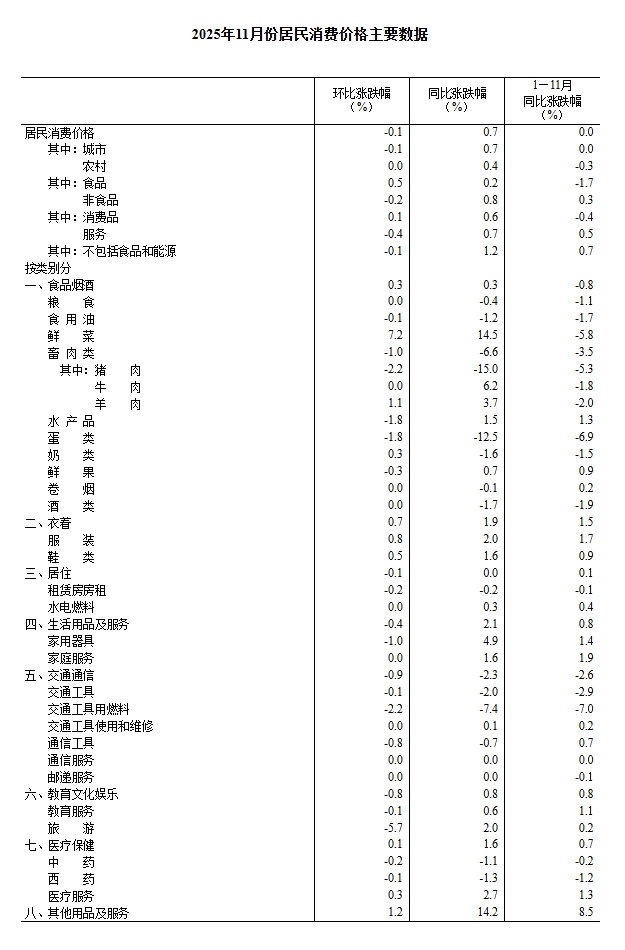
In November 2025, the national consumer price index (CPI) rose 0.7% YoY. Specifically, urban areas rose 0.7%, rural areas rose 0.4%; food prices rose 0.2%, non-food prices rose 0.8%; prices of consumer goods rose 0.6%, prices of services rose 0.7%. On average from January to November, the national CPI remained flat compared with the same period last year.
In November, the national CPI fell 0.1% MoM. Specifically, urban areas fell 0.1%, rural areas remained flat; food prices rose 0.5%, non-food prices fell 0.2%; prices of consumer goods rose 0.1%, prices of services fell 0.4%.
I. Year-on-Year Changes in Prices of Various Goods and Services
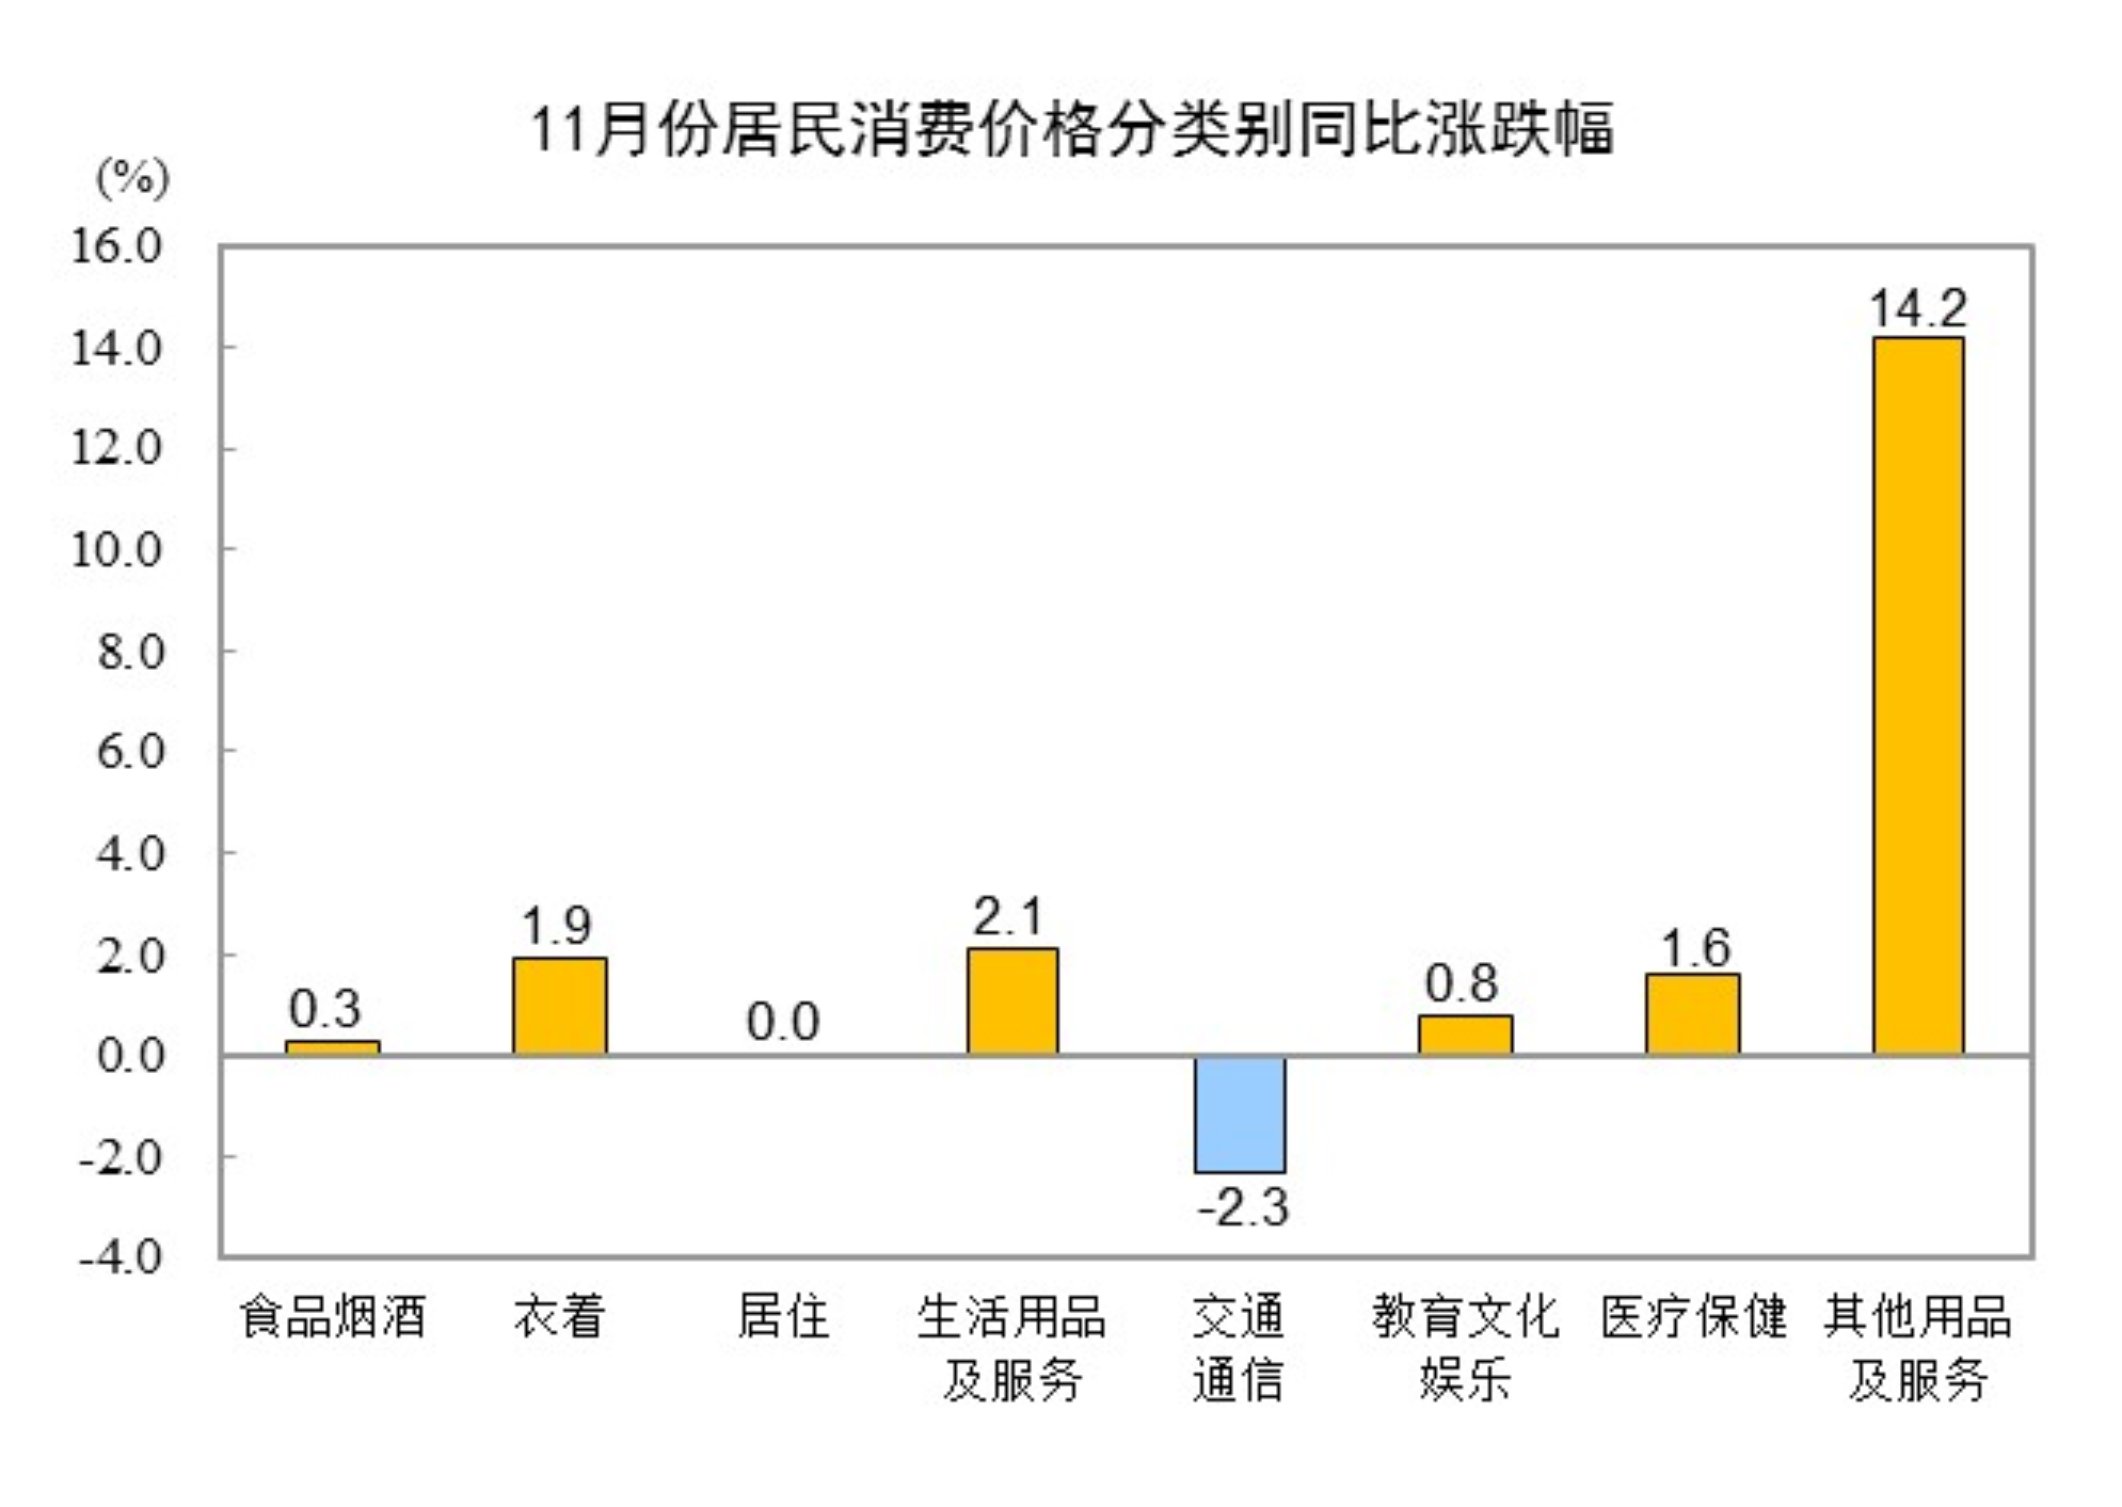
In November, prices of food, tobacco, and alcohol rose 0.3% YoY, contributing approximately 0.09 percentage points to the CPI increase. Among food items, prices of fresh vegetables rose 14.5%, contributing approximately 0.31 percentage points; prices of aquatic products rose 1.5%, contributing approximately 0.03 percentage points; prices of fresh fruits rose 0.7%, contributing approximately 0.01 percentage points; prices of eggs fell 12.5%, contributing approximately 0.08 percentage points to the CPI decrease; prices of livestock meat fell 6.6%, contributing approximately 0.2 percentage points, among which pork prices fell 15.0%, contributing approximately 0.21 percentage points; prices of grains fell 0.4%, contributing approximately 0.01 percentage points.
Among the other seven categories, prices increased in five, remained flat in one, and decreased in one on a YoY basis. Specifically, prices for other articles and services, household goods and services, and clothing rose by 14.2%, 2.1%, and 1.9%, respectively; prices for health care, and education, culture, and recreation increased by 1.6% and 0.8%, respectively; housing prices remained flat; and prices for transportation and communication fell by 2.3%.
II. Month-on-Month Changes in Prices of Various Categories of Goods and Services
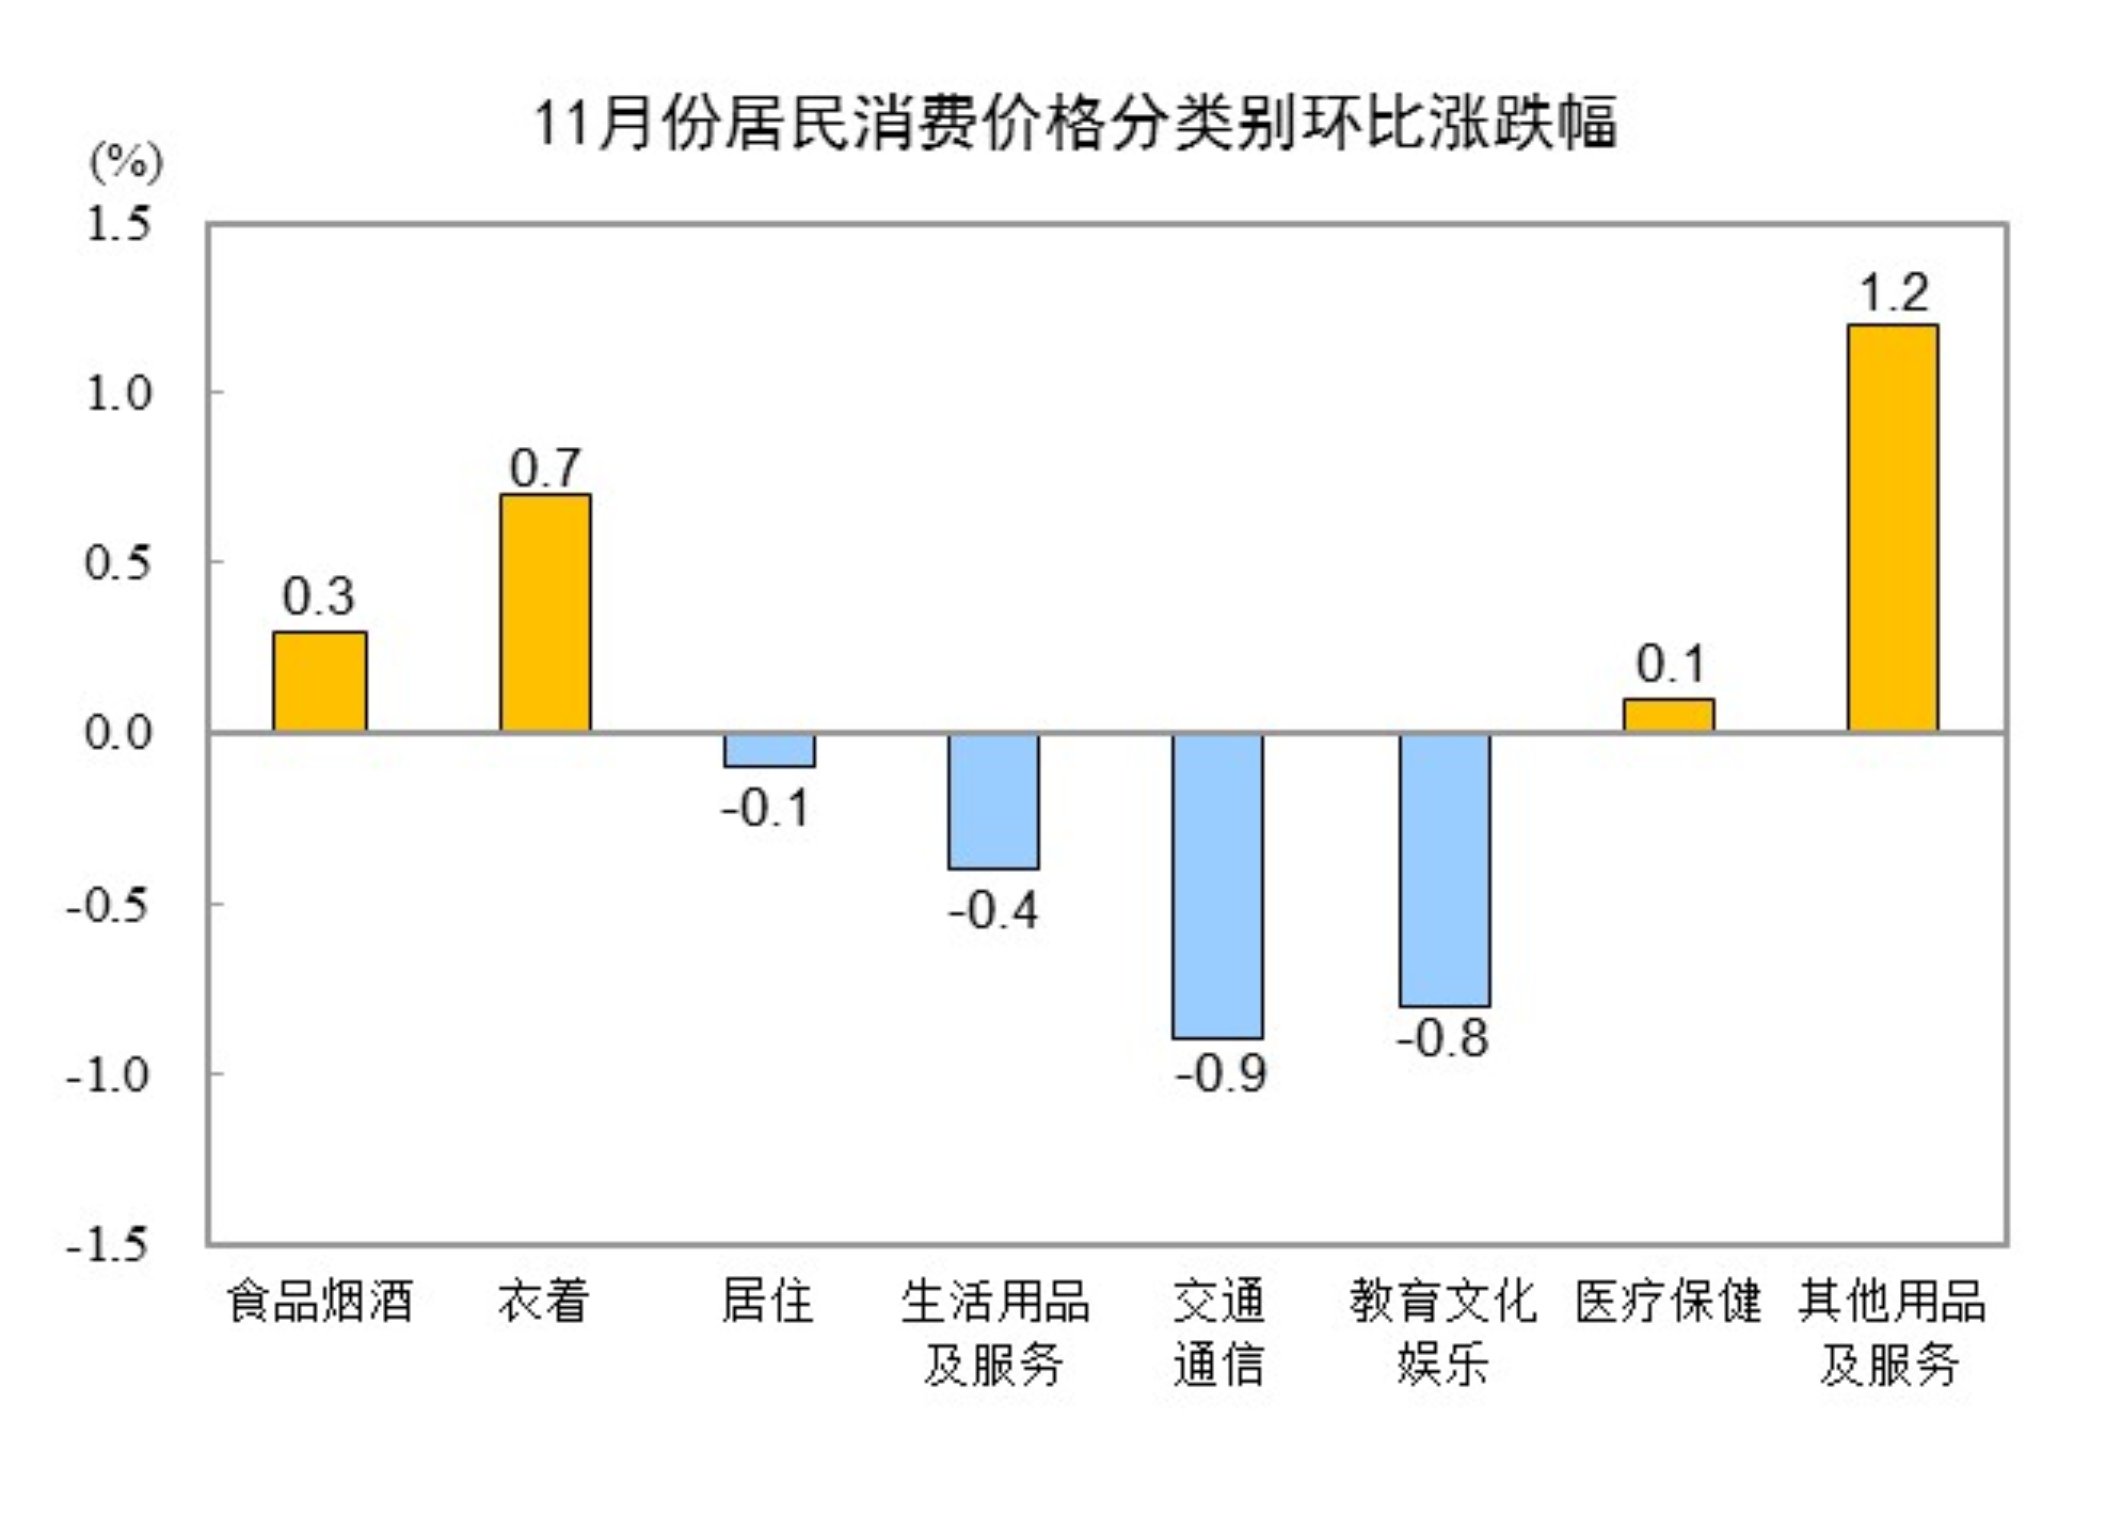
In November, prices for food, tobacco, and alcohol rose by 0.3% MoM, contributing approximately 0.07 percentage points to the CPI increase. Within the food category, prices for fresh vegetables increased by 7.2%, contributing about 0.17 percentage points to the CPI increase; prices for aquatic products fell by 1.8%, dragging down the CPI by about 0.03 percentage points; egg prices dropped by 1.8%, reducing the CPI by about 0.01 percentage points; prices for livestock meat decreased by 1.0%, lowering the CPI by about 0.03 percentage points, among which pork prices fell by 2.2%, contributing about 0.03 percentage points to the CPI decline; and prices for fresh fruit declined by 0.3%, dragging down the CPI by about 0.01 percentage points.
Among the other seven categories, prices increased in three and decreased in four on a MoM basis. Specifically, prices for other articles and services, clothing, and health care rose by 1.2%, 0.7%, and 0.1%, respectively; prices for transportation and communication, and education, culture, and recreation fell by 0.9% and 0.8%, respectively; and prices for household goods and services, and housing decreased by 0.4% and 0.1%, respectively.
Ex-factory Prices of Industrial Producers Continued to Rise MoM in November 2025
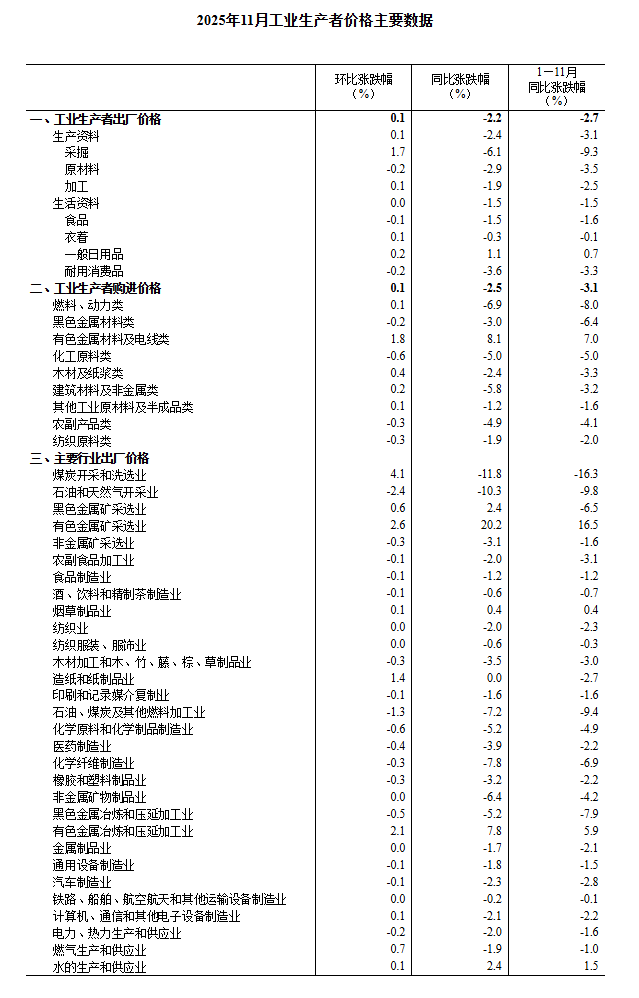
In November 2025, the ex-factory prices of industrial producers nationwide fell by 2.2% YoY, while the purchase prices of industrial producers dropped by 2.5% YoY; both ex-factory prices and purchase prices of industrial producers rose by 0.1% MoM, with the increases the same as the previous month. On average from January to November, the ex-factory prices of industrial producers fell by 2.7% compared with the same period last year, while the purchase prices dropped by 3.1%.

I. Year-on-Year Changes in Industrial Producer Prices
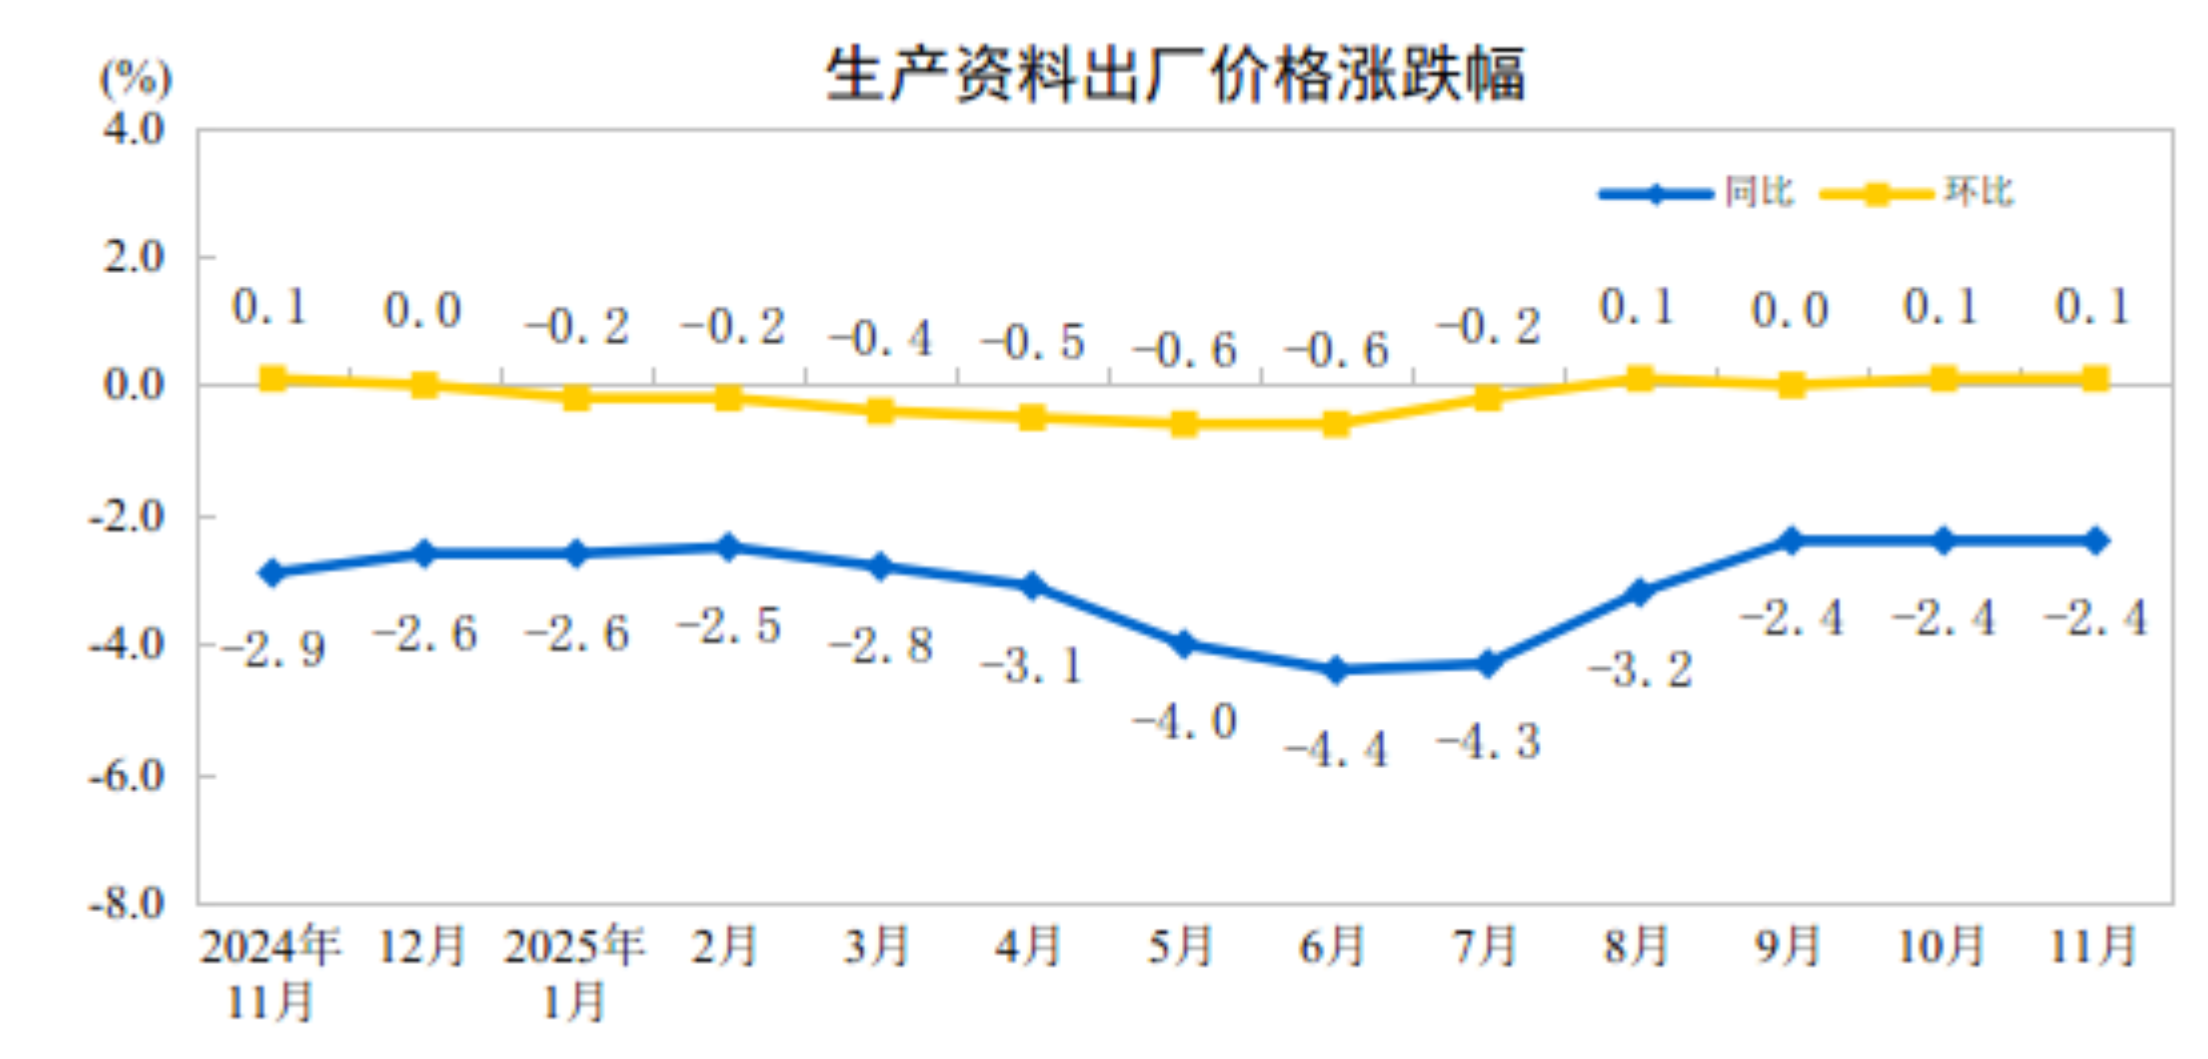
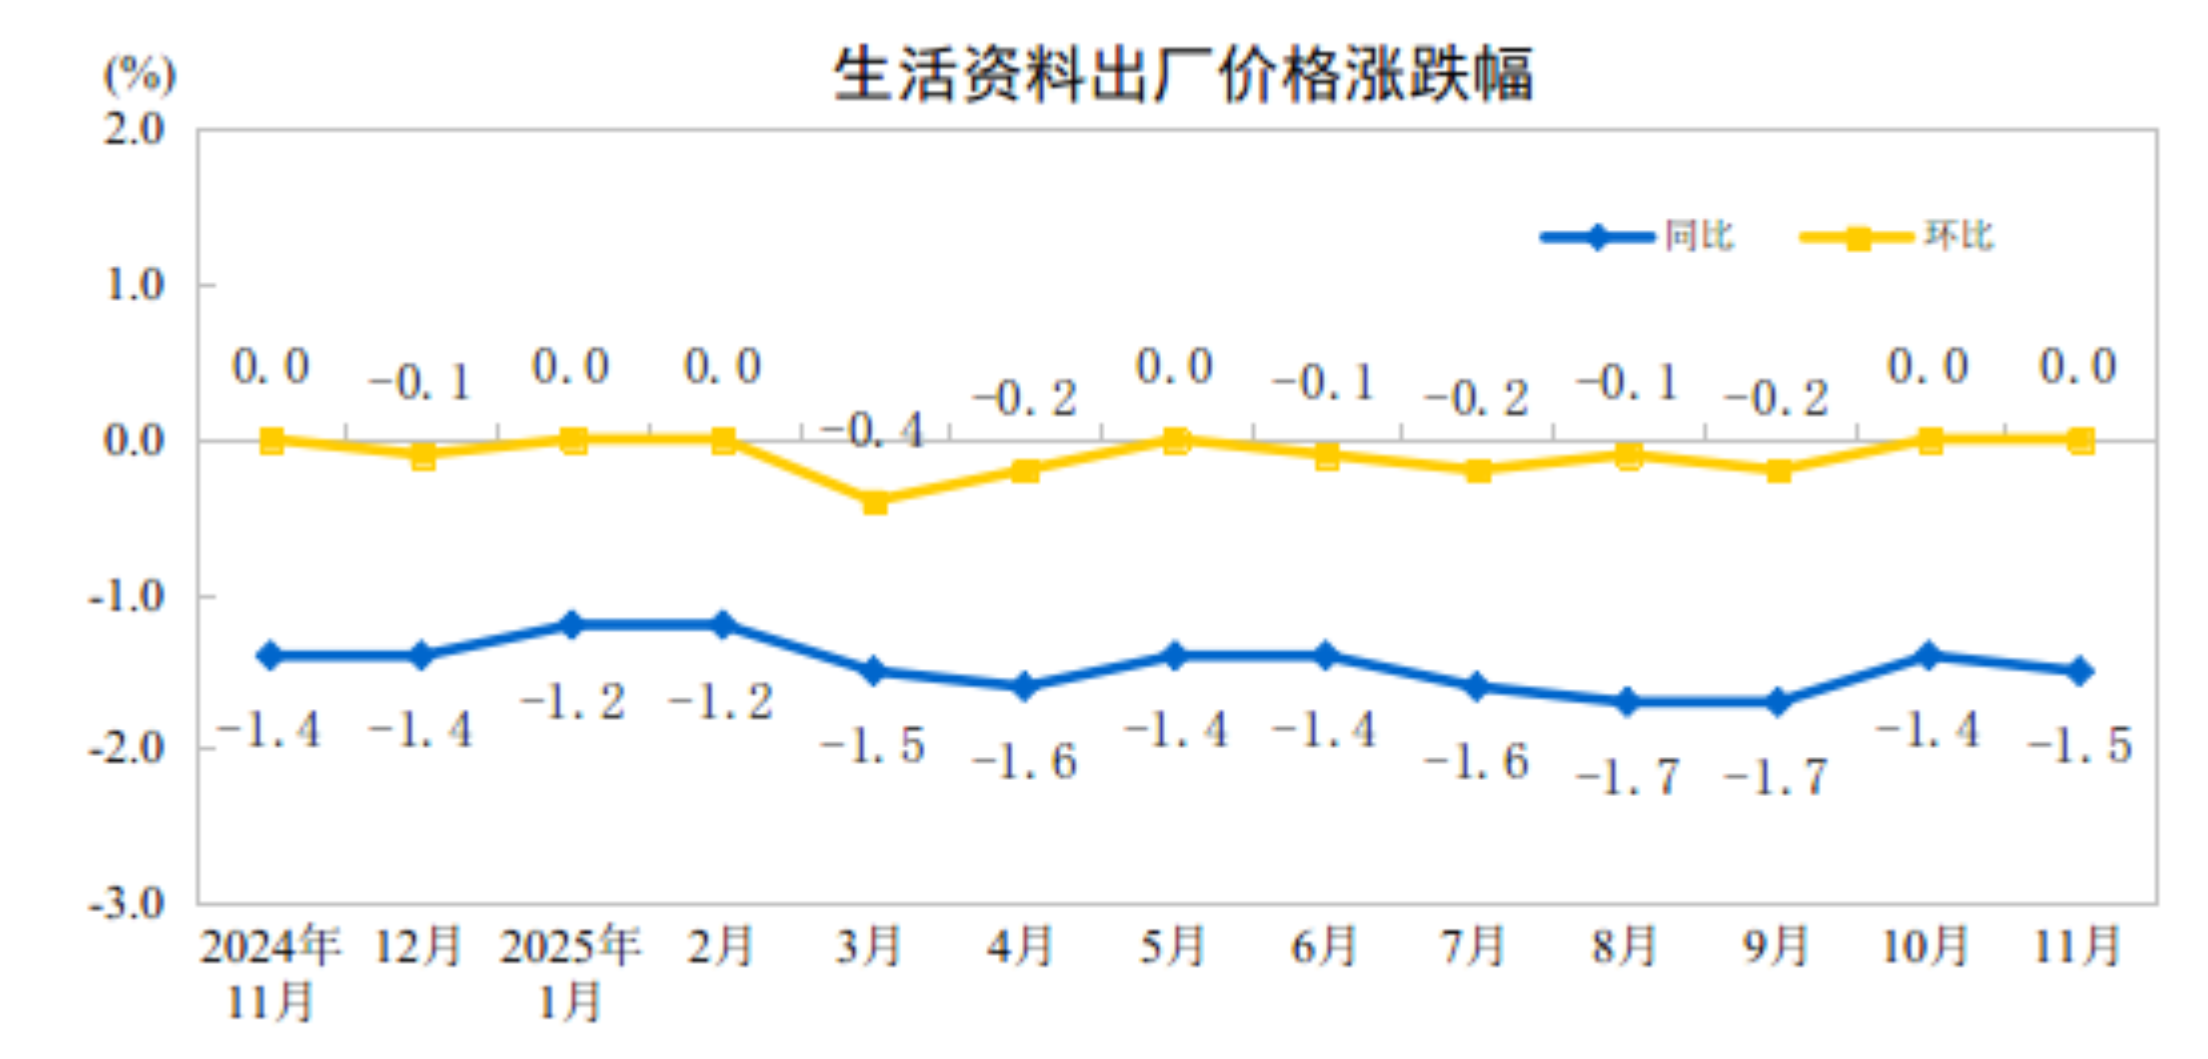
In November, within the ex-factory prices of industrial producers, prices for means of production fell by 2.4%, dragging down the overall ex-factory price level by about 1.79 percentage points. Among these, prices for mining fell by 6.1%, prices for raw materials dropped by 2.9%, and prices for processing industries decreased by 1.9%. Prices for means of subsistence fell by 1.5%, contributing about 0.38 percentage points to the decline in the overall ex-factory price level. Among these, food prices dropped by 1.5%, clothing prices fell by 0.3%, prices for general consumer goods rose by 1.1%, and prices for durable consumer goods decreased by 3.6%.
Among industrial producer purchase prices, fuel and power prices fell by 6.9%, building materials and non-metals prices fell by 5.8%, chemical raw materials prices fell by 5.0%, agricultural and sideline products prices fell by 4.9%, ferrous metals prices fell by 3.0%, and textile raw materials prices fell by 1.9%; non-ferrous metals and wire prices rose by 8.1%.
II. MoM Changes in Industrial Producer Prices
In November, among ex-factory prices for industrial producers, producer goods prices rose by 0.1%, boosting the overall ex-factory price level by approximately 0.08 percentage points. Among them, mining industry prices rose by 1.7%, raw materials industry prices fell by 0.2%, and processing industry prices rose by 0.1%. Consumer goods prices were flat. Among them, food prices fell by 0.1%, clothing prices rose by 0.1%, general daily necessities prices rose by 0.2%, and durable consumer goods prices fell by 0.2%.
Among industrial producer purchase prices, non-ferrous metals and wire prices rose by 1.8%, building materials and non-metals prices rose by 0.2%, and fuel and power prices rose by 0.1%; chemical raw materials prices fell by 0.6%, agricultural and sideline products prices and textile raw materials prices both fell by 0.3%, and ferrous metals prices fell by 0.2%.
CPI YoY Growth Expanded in November 2025, Core CPI Continued to Rise
—Dong Lijuan, Chief Statistician of the NBS City Department, Interprets CPI and PPI Data for November 2025
In November, household consumption continued to recover. The Consumer Price Index (CPI) fell by 0.1% MoM and rose by 0.7% YoY. The core CPI, excluding food and energy, rose by 1.2% YoY. Influenced by factors such as optimized supply-demand structures in some domestic industries and the transmission of international commodity prices, the Producer Price Index (PPI) for industrial producers rose by 0.1% MoM but fell by 2.2% YoY.
I. CPI YoY Growth Expanded, Core CPI Rose by 1.2%
CPI rose by 0.7% YoY, with the growth rate expanding by 0.5 percentage points from the previous month, marking the highest level since March 2024. The expansion in YoY growth was primarily boosted by food prices shifting from decline to increase.Food prices shifted from a 2.9% decline in the previous month to a 0.2% increase, changing their impact on the CPI YoY from a downward pull of 0.54 percentage points last month to an upward pull of 0.04 percentage points. Among food items, fresh vegetable prices shifted from a 7.3% decline in the previous month to a 14.5% increase, marking the first increase after nine consecutive months of decline, increasing their upward pull on the CPI YoY by approximately 0.49 percentage points compared to the previous month; fresh fruit prices shifted from a 2.0% decline to a 0.7% increase; beef and mutton prices rose by 6.2% and 3.7% respectively, with both growth rates expanding; pork and poultry prices fell by 15.0% and 0.6% respectively, with both decline rates narrowing. Energy prices fell 3.4%, with the decline widening by 1.0 percentage point from the previous month, of which the decline in gasoline prices widened to 7.5%. Core CPI, excluding food and energy prices, rose 1.2% YoY, with the increase remaining above 1% for three consecutive months. Prices of services and industrial consumer goods excluding energy rose 0.7% and 2.1%, respectively, contributing approximately 0.29 and 0.53 percentage points to the YoY increase in CPI. Among them, policies and measures to expand domestic demand continued to take effect, with prices of household appliances and clothing rising 4.9% and 2.0%, respectively, and prices of air tickets, domestic services, and dining out rising 7.0%, 2.4%, and 1.2%, respectively. The increase in gold jewelry prices widened to 58.4%. In addition, prices of fuel-powered and new energy passenger cars fell 2.5% and 2.4%, respectively.
CPI fell 0.1% MoM, mainly affected by the seasonal decline in service prices. Service prices fell 0.4%, contributing approximately 0.16 percentage points to the MoM decline in CPI. Among them, post-holiday travel demand pulled back seasonally, with prices of hotel accommodation, air tickets, travel agency fees, and vehicle rental fees falling 10.4%, 10.2%, 6.2%, and 3.6%, respectively, collectively contributing approximately 0.13 percentage points to the MoM decline in CPI; as the housing rental market entered the off-season, rental prices fell 0.2%. Affected by changes in international oil prices, domestic gasoline prices fell 2.2%, contributing approximately 0.07 percentage points to the MoM decline in CPI. Prices of industrial consumer goods excluding energy rose 0.3%, of which domestic gold jewelry prices rose 7.3% due to changes in international gold prices, and clothing prices rose 0.8% due to the launch of new winter collections. Food prices rose 0.5%, 0.9 percentage points higher than the seasonal level, mainly driven by the increase in fresh vegetable prices. Rainfall and cooling in some regions affected the production, storage, and transportation of fresh vegetables, leading to a 7.2% increase in fresh vegetable prices, significantly higher than the seasonal average decline of 3.2%, contributing approximately 0.17 percentage points to the MoM increase in CPI; with relatively sufficient market supply, prices of pork, eggs, and aquatic products fell 2.2%, 2.1%, and 1.8%, respectively, collectively contributing approximately 0.07 percentage points to the MoM decline in CPI.
II. PPI Rose MoM for the Second Consecutive Month, with the YoY Decline Slightly Widening
PPI rose 0.1% MoM, marking two consecutive months of increase. The main characteristics of the MoM movement in PPI this month were: first, seasonal demand increases in some domestic industries drove price rises. As regions began "peak winter" preparations, demand for coal and gas increased seasonally, with prices in coal mining and washing rising 4.1% MoM, coal processing prices rising 3.4%, and gas production and supply prices rising 0.7%. Since the onset of winter, cold-weather products have entered a peak consumption season, with woolen manufacturing prices rising 0.6% and down product manufacturing prices increasing 0.2%. Second, imported factors have influenced the divergent price trends in domestic non-ferrous metals and oil-related industries. The rise in international non-ferrous metal prices led to a 2.6% MoM increase in domestic non-ferrous metal ore mining prices, and a 2.1% increase in non-ferrous metal smelting and rolling processing prices, with copper smelting, gold smelting, and aluminum smelting prices rising 2.9%, 1.4%, and 0.2% respectively. The decline in international oil prices resulted in a 2.4% decrease in domestic oil and natural gas extraction prices, and a 2.2% drop in refined petroleum product manufacturing prices.
The PPI declined 2.2% YoY, with the decline expanding by 0.1 percentage points from the previous month, mainly due to a higher comparison base from the same period last year. China's various macro policies have continued to show effectiveness, leading to positive changes in prices. First, the comprehensive rectification of "involutionary" competition has shown results, with the YoY decline in related industry prices narrowing. Ongoing capacity management in key industries has continuously optimized market competition order, with the YoY decline in coal mining and washing, PV equipment and component manufacturing, and lithium-ion battery manufacturing prices narrowing by 3.8, 2.0, and 0.7 percentage points respectively, all having narrowed for several consecutive months; the YoY decline in new energy vehicle manufacturing prices also narrowed by 0.6 percentage points. Second, the rapid development of emerging industries has driven a YoY increase in related industry prices. With the rapid growth of China's new materials, embodied AI, and other industries, and the deepening of green and low-carbon transformation, demand in related sectors has increased, with external storage device and component prices rising 13.9% YoY, graphite and carbon product manufacturing prices increasing 3.8%, integrated circuit manufacturing prices up 1.7%, service consumption robot manufacturing prices rising 1.1%, control micro-motor prices up 0.4%, and waste resource comprehensive utilization industry prices increasing 0.4%. Third, the effective release of consumption potential has driven a YoY rebound and improvement in related industry prices. The continuous effectiveness of the consumer boost special action has refreshed and enhanced consumer demand, with arts and crafts and ceremonial goods manufacturing prices rising 20.6% YoY, sports ball manufacturing prices up 4.3%, and nutritional food manufacturing prices increasing 1.1%; the YoY decline in household washing machine, television manufacturing, and room air conditioner prices narrowed by 3.7, 0.5, and 0.1 percentage points respectively.