[SMM Analysis] Interpretation of October Steel Export Data
Ø By Country: The Philippines Shows Strong Performance, While Vietnam Remains Top in Negative Growth
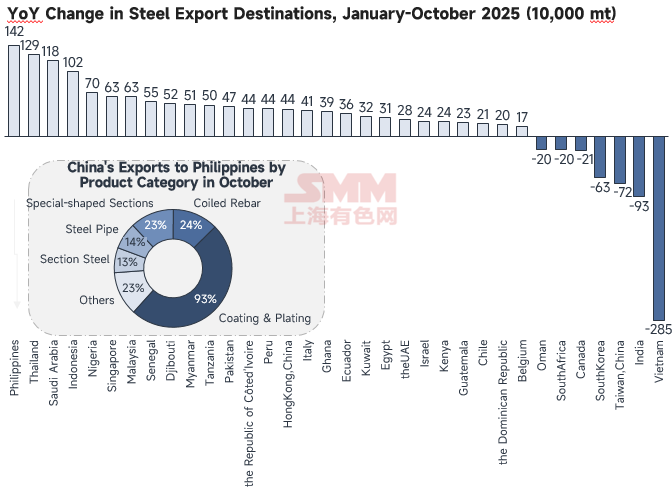
According to data compiled by SMM from the General Administration of Customs, China's cumulative steel exports from January to October 2025 totaled 109.653 million mt, up 13.43% YoY. The Philippines recorded the largest cumulative YoY increase, up 1.424 million mt (a 30.12% growth).
Specifically, among all steel product categories exported to the Philippines in October, steel billet led with a share of 34%, followed by coated and galvanized products at 32%, together accounting for the majority. Notably, coated and galvanized products have consistently dominated the Philippines' steel imports from China this year, with stable monthly imports from China of around 200,000-250,000 mt, exceeding 300,000 mt in September. The primary reasons behind this are the peak period of infrastructure construction (such as the "Build, Build, Build" program) and real estate development in the Philippines, driving robust demand for steel products like color-coated sheets and galvanized sheets used in construction. Simultaneously, the rapid development of local manufacturing industries, including home appliances and automobiles, has increased the demand for high-quality coated and galvanized steel sheets. Although local hot-dip galvanizing production lines have been successfully commissioned in the Philippines for the localized production of galvanized steel sheets and coils for the construction sector, the existing capacity remains relatively limited. Faced with the rapidly growing demand from the construction and manufacturing sectors in the Philippines, there is a significant gap in local supply, which consequently needs to be filled by China, the world's largest steel producer.
Data source: General Administration of Customs, SMM
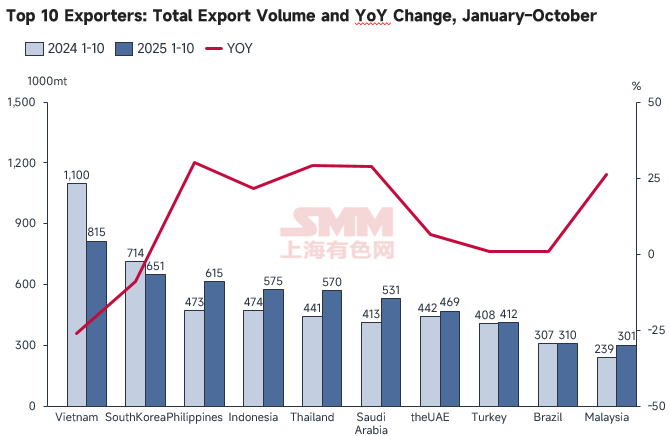
Looking at the total volume and YoY changes for China's top 10 export destinations from January to October, Vietnam still leads by total volume, ranking first with 8.15 million mt, followed by South Korea with 6.51 million mt. Exports to the Philippines are also substantial, reaching 6.15 million mt, ranking third. It is evident that the main consumer markets for Chinese steel remain in Asia, primarily in Southeast Asia, East Asia, and West Asia.
Data source: General Administration of Customs, SMM
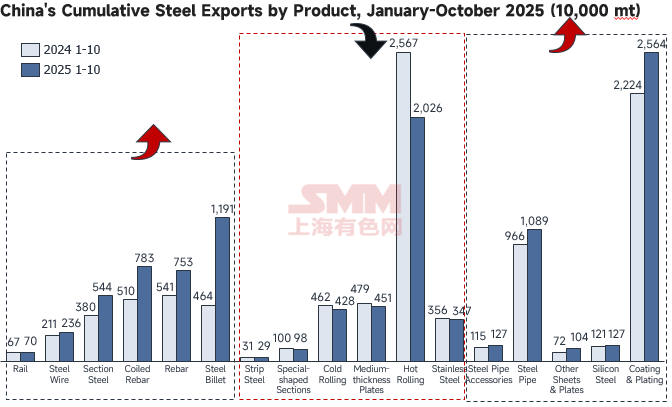
Ø By Product: Special-shaped Sections' Cumulative YoY Growth Turns to Decline; Steel Billet Growth Rate Slows Down
According to data compiled by SMM from the General Administration of Customs, China exported 10.9565 million mt of steel products in October 2025, including 1.1739 million mt of steel billet exports. While the YoY growth continued, the growth rate slowed further to 157%. Meanwhile, the monthly total has been declining since the peak in August, down 21.44% MoM from September. Additionally, the number of products with cumulative YoY declines increased compared to September. Specifically, the cumulative volume of special-shaped sections from January to October was 975,500 mt, turning from growth to a decline of 2.38% YoY.
Data source: General Administration of Customs, SMM
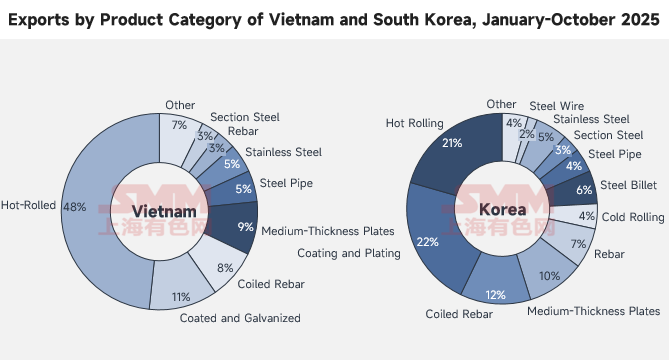
In the end, let's look at the product distribution for the top two countries in China's steel exports from January to October: Vietnam and South Korea. HRC still accounts for half of Vietnam's steel imports from China, followed by coated and coiled rebar. This is due to the rush to export wide coils and the need to maintain local construction and manufacturing demand. However, the window for anti-circumvention policies in November is approaching, and SMM continues to monitor the situation. Based on current market surveys, most traders still expect a pullback in next year's total HRC exports.
Data source: General Administration of Customs, SMM
Copyright and Intellectual Property Statement:
This report is independently created or compiled by SMM Information & Technology Co., Ltd. (hereinafter referred to as "SMM"), and SMM legally enjoys complete copyright and related intellectual property rights.
The copyright, trademark rights, domain name rights, commercial data information property rights, and other related intellectual property rights of all content contained in this report (including but not limited to information, articles, data, charts, pictures, audio, video, logos, advertisements, trademarks, trade names, domain names, layout designs, etc.) are owned or held by SMM or its related right holders.
The above rights are strictly protected by relevant laws and regulations of the People's Republic of China, such as the Copyright Law of the People's Republic of China, the Trademark Law of the People's Republic of China, and the Anti-Unfair Competition Law of the People's Republic of China, as well as applicable international treaties.
Without prior written authorization from SMM, no institution or individual may:
1. Use all or part of this report in any form (including but not limited to reprinting, modifying, selling, transferring, displaying, translating, compiling, disseminating);
2. Disclose the content of this report to any third party;
3. License or authorize any third party to use the content of this report;
4. For any unauthorized use, SMM will legally pursue the legal responsibilities of the infringer, demanding that they bear legal responsibilities including but not limited to contractual breach liability, returning unjust enrichment, and compensating for direct and indirect economic losses.
Data Source Statement:
(Except for publicly available information, other data in this report are derived from publicly available information (including but not limited to industry news, seminars, exhibitions, corporate financial reports, brokerage reports, data from the National Bureau of Statistics, customs import and export data, various data published by major associations and institutions, etc.), market exchanges, and comprehensive analysis and reasonable inferences made by the research team based on SMM's internal database models. This information is for reference only and does not constitute decision-making advice.
SMM reserves the final interpretation right of the terms in this statement and the right to adjust and modify the content of the statement according to actual circumstances.
![Before the holiday, the black chain is unlikely to see a trend-driven market [SMM Steel Industry Chain Weekly Report].](https://imgqn.smm.cn/usercenter/zUFfM20251217171748.jpg)
![[SMM Chromium Daily Review] Inquiries and Transactions Weakened, Chromium Market Showed Mediocre Performance Before the Holiday](https://imgqn.smm.cn/usercenter/ENDOs20251217171718.jpg)