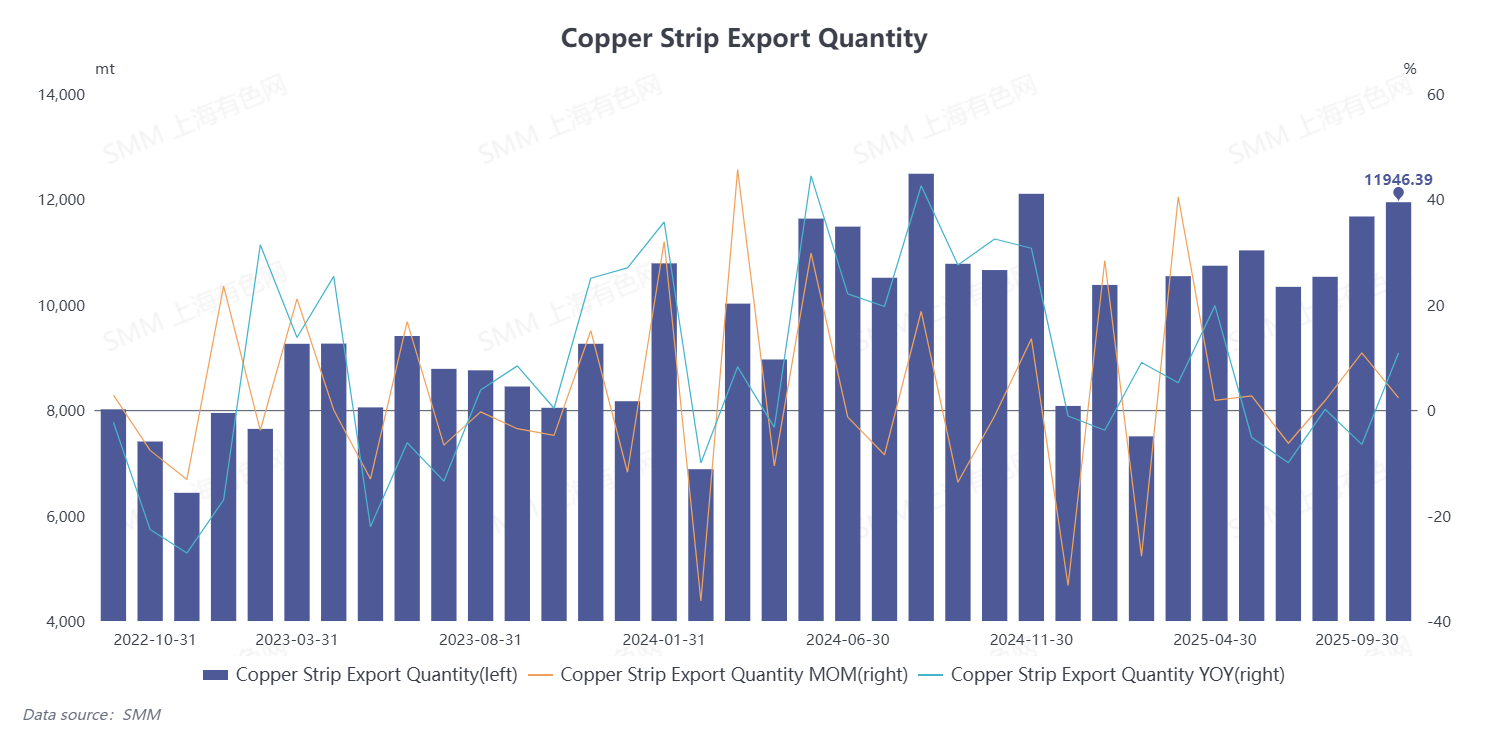
According to data from the General Administration of Customs, China's exports of copper plate/sheet and strip in September 2025 reached 11,946.39 mt, up 2.32% MoM and up 10.84% YoY. From January to September, cumulative exports of copper plate/sheet and strip totaled 94,692.13 mt, with a cumulative increase of 1.22% YoY.
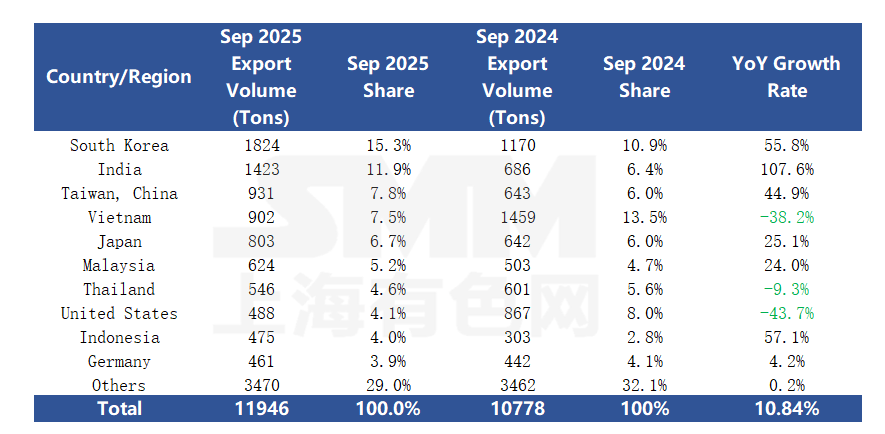
 Customs data shows that in September, China's copper plate/sheet and strip exports continued to expand, reaching 85 countries and regions. In terms of specific export performance, the top markets for copper plate/sheet and strip exports that month showed significant divergence: South Korea and India stood out, ranking first and second with exports of 1,824 mt and 1,423 mt, respectively, and both recorded substantial YoY growth in export volume (55.8% and 107.6%), becoming key growth drivers for copper plate/sheet and strip exports that month. Meanwhile, the Vietnam and US markets were under pressure, with exports of 902 mt and 488 mt, respectively, showing significant YoY declines (38.2% and 43.7%), indicating relatively subdued export performance.
China's copper plate/sheet and strip export trade mode structure exhibits distinct characteristics. September data shows that Processing with Imported Materials was the primary method, with exports reaching 8,187 mt, accounting for 68.5%; Processing and Assembling exports were 1,865 mt, representing 15.6%; Ordinary Trade exports were 1,050 mt, accounting for 8.8%; and other trade modes contributed 844 mt, making up 7.1%. Multiple trade modes worked in synergy to form the export trade landscape for September.
(HS codes: 74091110, 74091190, 74091900, 74092100, 74092900, 74093100, 74093900, 74094000, 74099000)