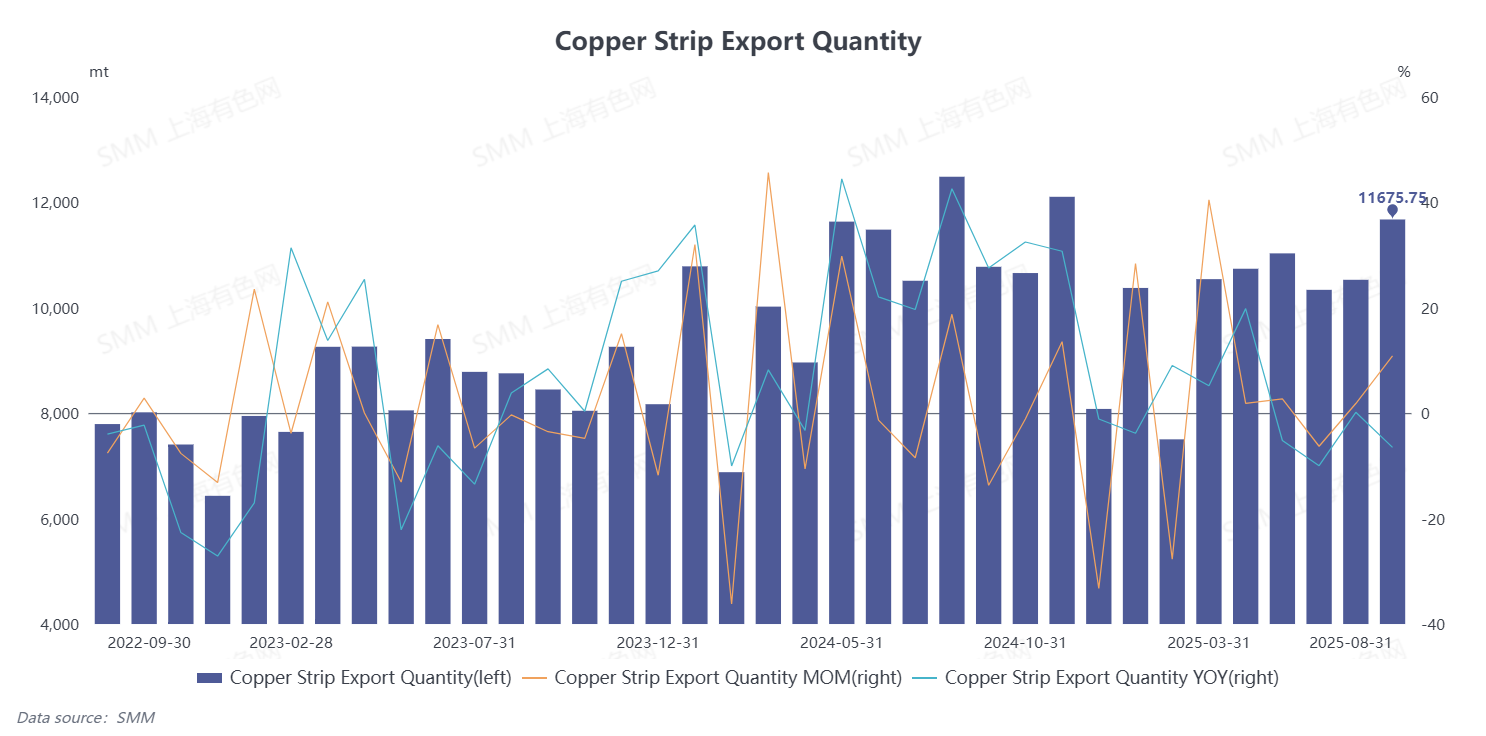
According to data from the General Administration of Customs, China's exports of copper plate/sheet and strip reached 11,675.75 mt in August 2025, up 10.87% MoM but down 6.49% YoY. From January to August, cumulative exports of copper plate/sheet and strip totaled 82,745.74 mt, a cumulative decrease of 0.03% YoY.
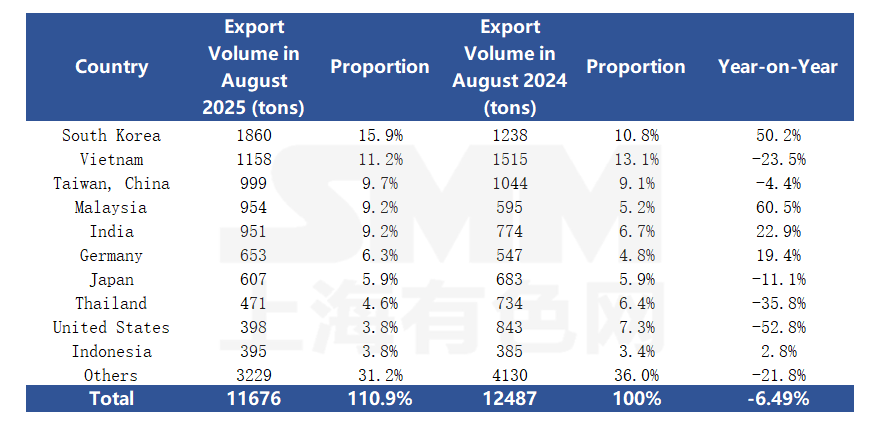
 According to customs data, in August 2025, China's copper plate/sheet and strip exports reached 102 countries and regions, with total exports maintaining a continuous growth trend. Analysis of key export destinations shows differentiated performance across major markets: South Korea ranked first with exports of 1,860 mt, up 50.2% YoY, continuing its strong growth momentum; Malaysia, India, and Germany ranked fourth to sixth in export volume with YoY growth rates of 60.5%, 22.9%, and 19.4%, respectively; Vietnam, Thailand, and the US saw significant YoY declines of 23.5%, 35.8%, and 52.8%, respectively. China's copper plate/sheet and strip exports achieved overall growth in August, but major export markets showed divergence, with some markets experiencing robust growth while others saw significant declines.
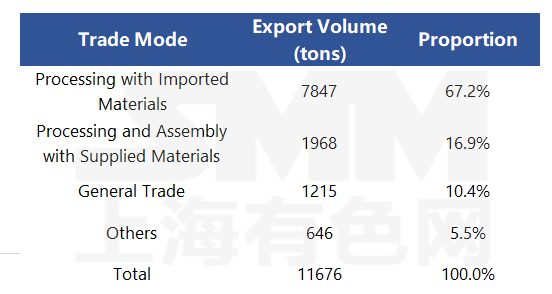
China's copper plate/sheet and strip export trade mode structure exhibited distinct characteristics. August data showed that Processing with Imported Materials was the primary method, with exports reaching 7,847 mt, accounting for 67.2%; Processing and Assembling exports were 1,968 mt, representing 16.9%; Ordinary Trade exports stood at 1,215 mt, making up 10.4%; and other trade modes contributed 646 mt, or 5.5%. Multiple trade modes worked in synergy, collectively shaping the export trade landscape for August.
(HS code 74091110,74091190,74091900,74092100,74092900,74093100,74093900,74094000,74099000)
![Delivery support and resistance to high prices coexisted, while Shanghai spot copper spot premiums remained generally stable [SMM Shanghai Spot Copper]](https://imgqn.smm.cn/usercenter/JnFuh20251217171711.jpg)
![Suppliers Actively Held Prices Firm, but Downstream Purchasing Was Not as Strong as Yesterday [SMM South China Spot Copper]](https://imgqn.smm.cn/usercenter/HeIuV20251217171708.jpg)
![Spot Premiums Rose While Market Activity Cooled [SMM North China Spot Copper]](https://imgqn.smm.cn/usercenter/udUol20251217171712.jpg)