SMM September 22:
Highlights: In August 2025, China's phosphate ore imports exhibited notable characteristics of stable total volume, structural changes, and declining average prices. The pattern of import source countries and entry provinces underwent significant shifts, rapidly transitioning from a dispersed model involving multiple countries and provinces in July to a highly concentrated model in August dominated solely by Egypt, with almost all imports entering through Guangxi ports. Although this led to a slight increase of 8.9% MoM in total imports to 130,000 mt, the total import value decreased by 7.3%, and the comprehensive national average import price fell significantly by 14.9% YoY.
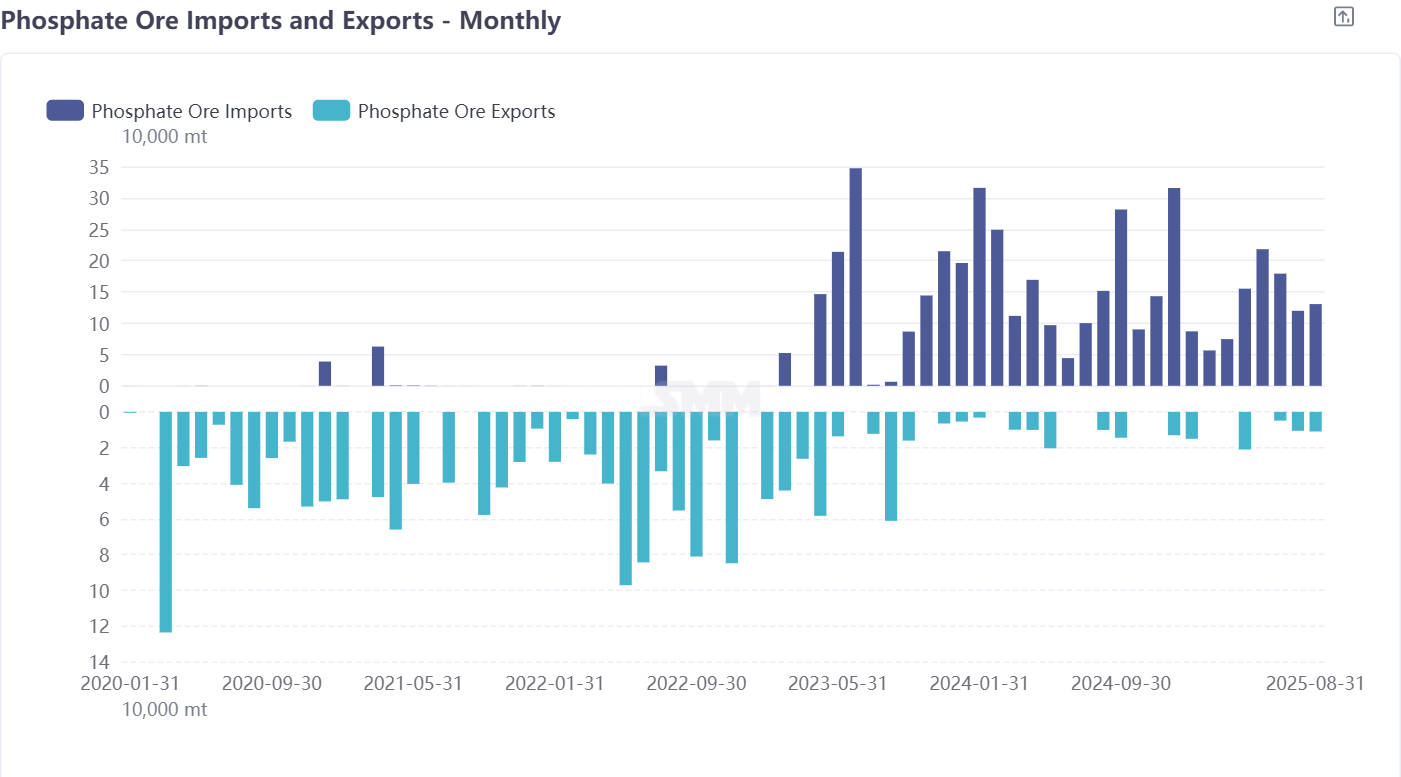
In August 2025, China's phosphate ore imports increased from 120,000 mt in July to 130,000 mt, up 8.9% MoM. The import value decreased by 7.3% MoM from $11.600 million to $10.752 million, primarily due to an overall decline in the average import price. Egypt was the largest source country, accounting for 90% of China's total imports. Exports increased from 106,000 mt in July to 11,000 mt in August, up 4.1% MoM. The main export destination was Fujian in July and Hubei in August.
I. Phosphate Ore Imports: The traditional major sources of China's phosphate ore imports are Egypt, Peru, and Jordan. The primary importing provinces include Guangxi and Hubei, and key importing enterprises are coastal phosphate chemical companies such as Chuan Jin Nuo.
1. Imports: Drastic Adjustment in Source Structure, Guangxi Surges Unexpectedly
Total volume stable: The nationwide total import volume increased from 120,000 mt to 130,000 mt, a relatively small change, maintaining relative stability.
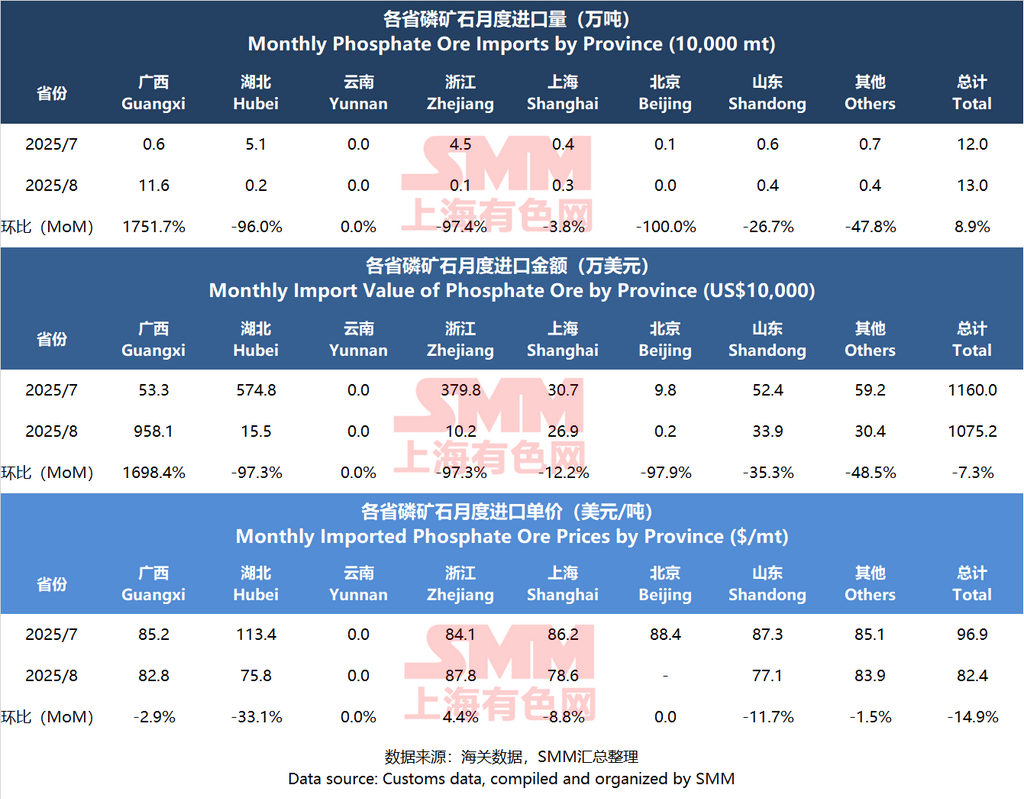
Provincial performance polarized: Guangxi: Imports surged from 6,000 mt to 116,000 mt, up over 1,750% MoM, making it the dominant importing province, accounting for 89% of total imports. This is likely due to a batch of large orders concentrated at the port.
2. Import Value: Total Value Declined, Reflecting Weaker Prices
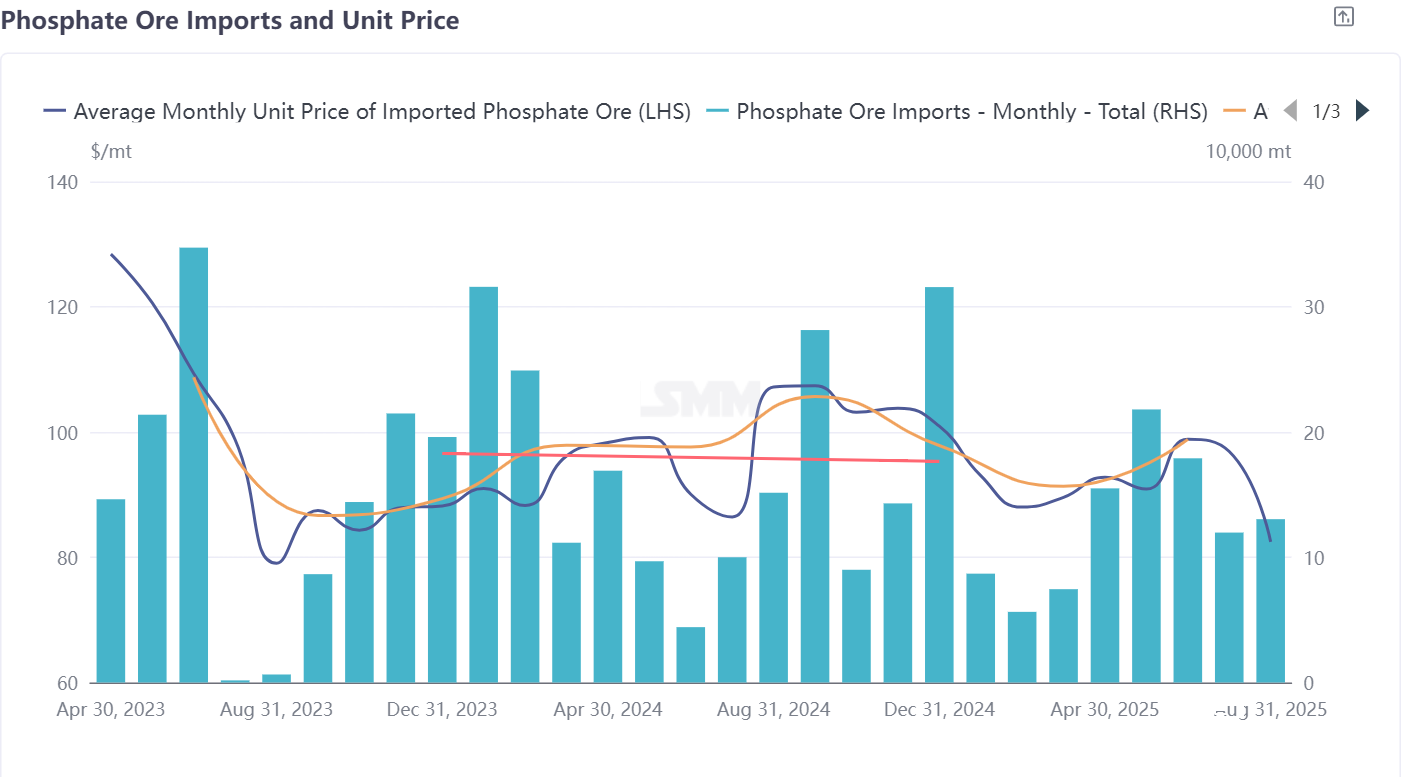
Although total import volume increased slightly, the total import value dropped from $11.60 million to $10.75 million, down 7.3%. This clearly indicates a decrease in the average price paid.
3. Import Unit Price: Nationwide Average Price Fell Broadly, Intensified Competition or Demand Changes
Nationwide composite average price: Decreased from $96.9/mt to $82.4/mt, down 14.9% MoM, a significant drop.
Average price by province: Hubei: The largest decline in average price, from $113.4/mt to $75.8/mt (-33.1%). This may be related to changes in imported ore quality or negotiation and bargaining. Major source Guangxi: The average price remained relatively stable, slightly decreasing from $85.2/mt to $82.8/mt (-2.9%), below the nationwide average from the previous month. Its large volume of imports may have exerted downward pressure on the overall average price. Other provinces such as Shandong and Shanghai also saw declines in average prices (-11.7%, -8.8%). Zhejiang was one of the few provinces with an increase in average price (+4.4%), but due to its minimal import volume, the impact on the overall situation was negligible.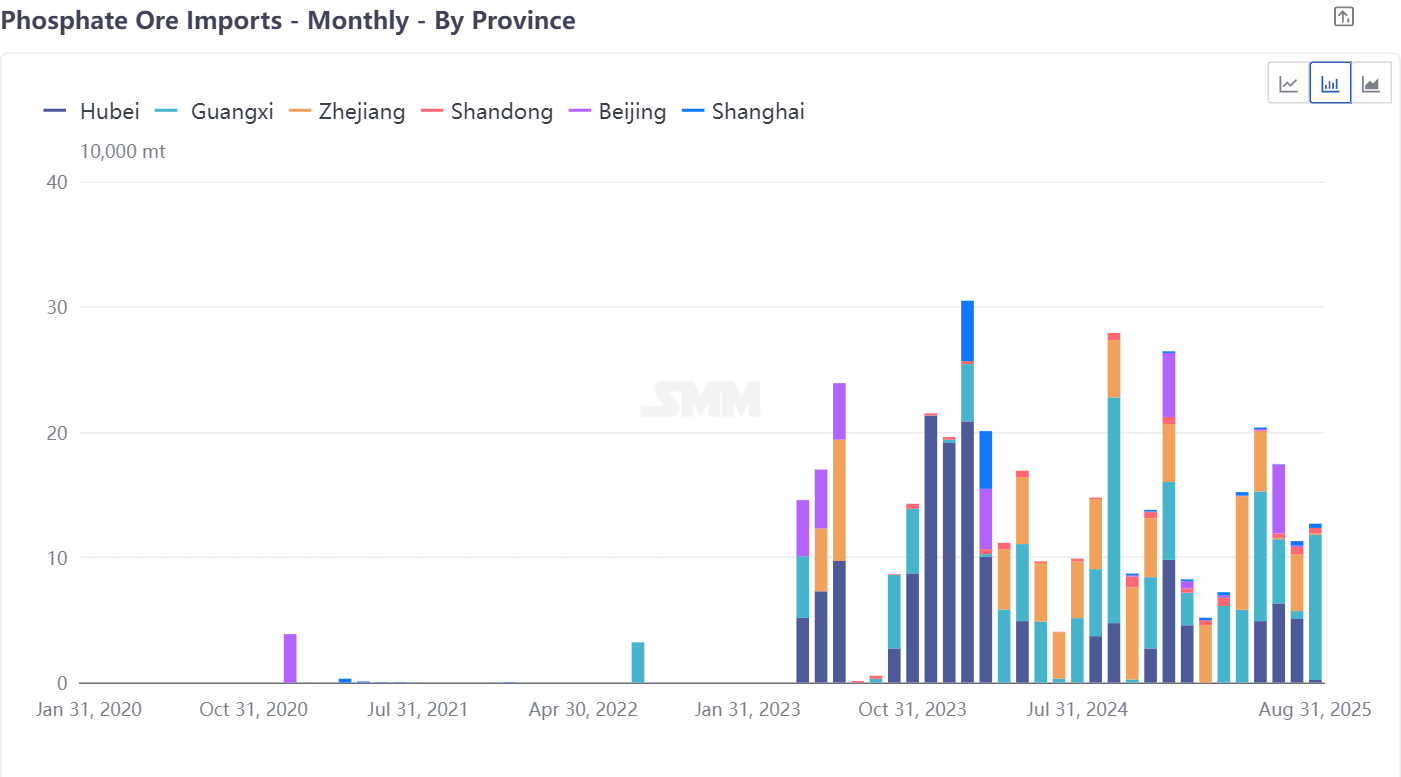 Hubei: As the main import destination last month (July) with 51,000 mt, its imports plummeted 96% in August to just 2,000 mt. This indicates a sharp, jumpy shift in import sources among provinces. Other provinces: Zhejiang also saw a significant drop in imports (-97.4%), while the rest, such as Shanghai, Shandong, and Beijing, maintained low or zero imports (Yunnan and Beijing near zero), mostly down MoM.
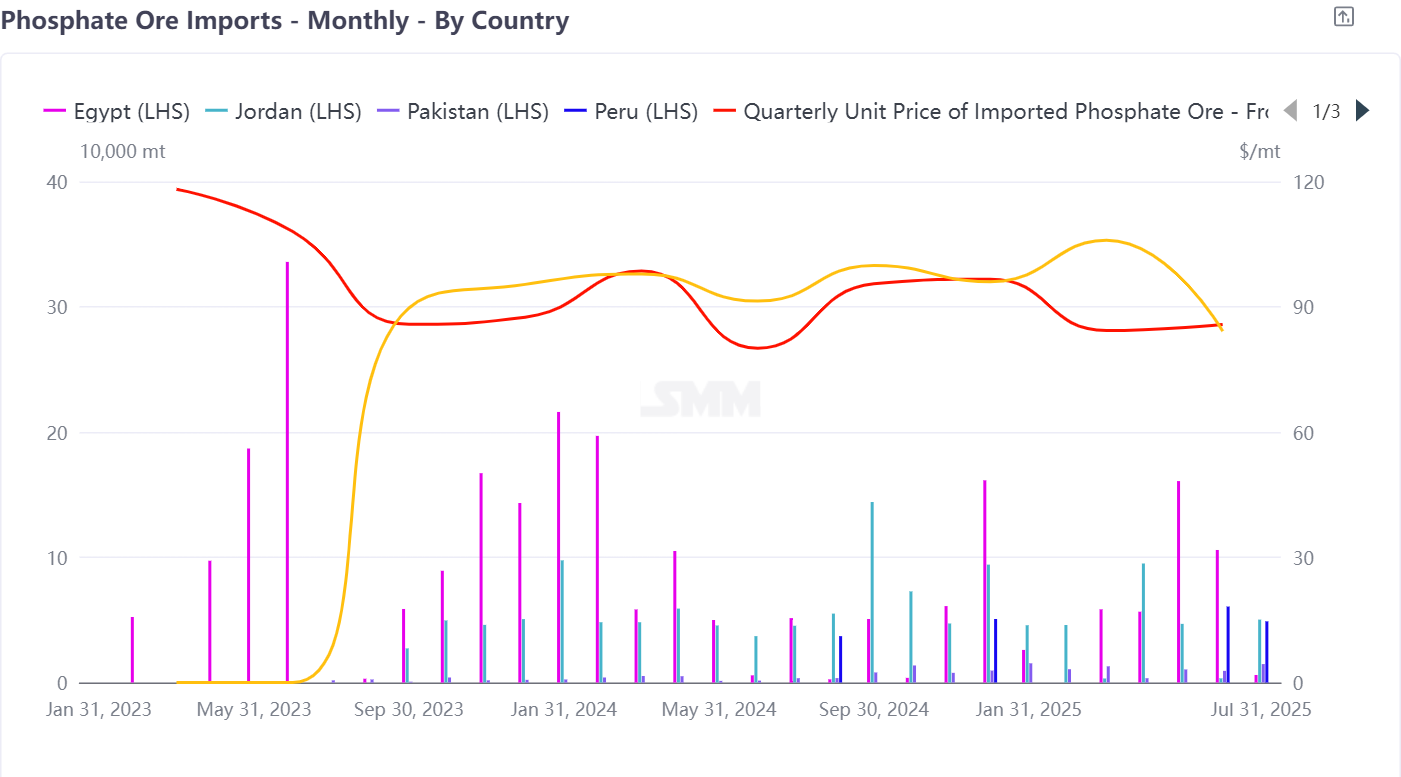
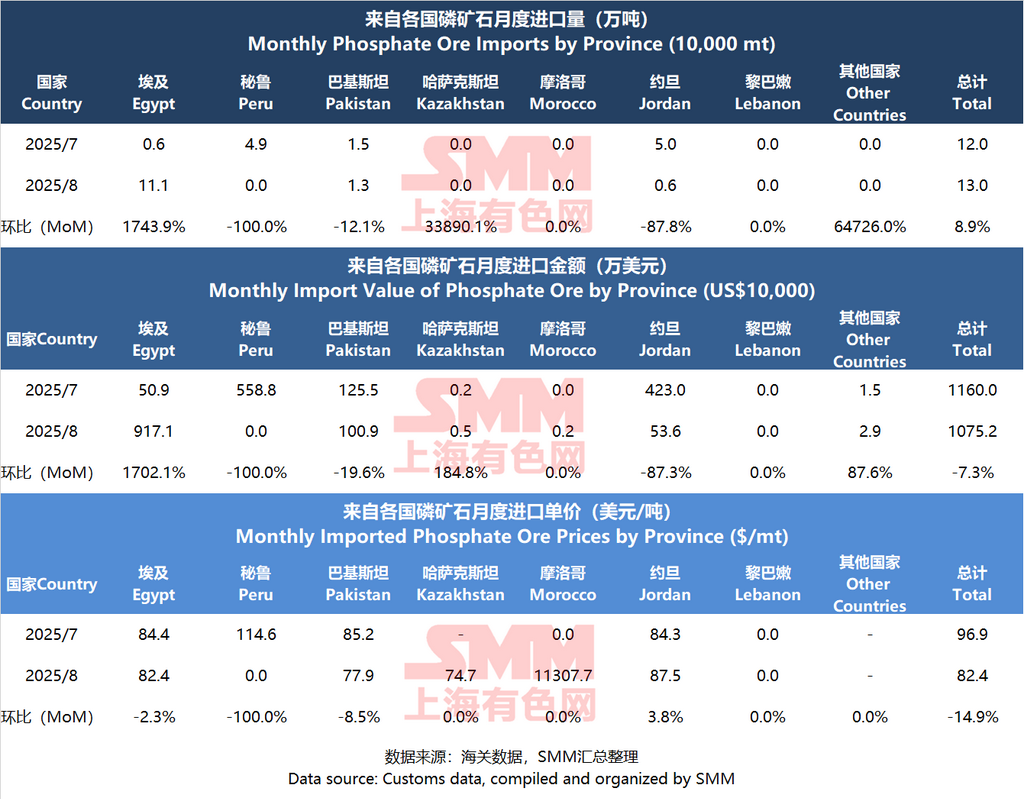
Egypt: Replaced Peru as the largest supplier, with imports surging from 6,000 mt to 111,000 mt (up 1,743.9% MoM), accounting for 85% of total imports in August. This was the sole core factor driving both the total volume growth and structural change this month.
Peru: As the largest supplier in July (49,000 mt), imports plummeted to zero in August (down 100% MoM), representing the other extreme in this source shift.
Jordan: The second-largest supplier in July (50,000 mt), imports contracted sharply by 87.8% MoM in August to just 6,000 mt.
National composite average price: Declined from $96.9/mt to $82.4/mt (down 14.9%). The drop in average price was mainly due to the sharp reduction in procurement volume from high-price source countries (Peru, Jordan), as well as the decline in prices from mainstream sources (Egypt, Pakistan).
II. Phosphate Ore Export Situation
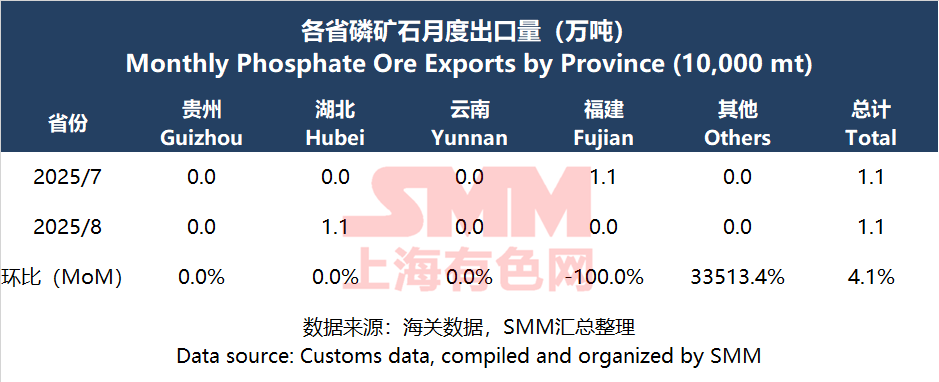 China's total phosphate ore exports increased from 106,000 mt in July to 11,000 mt in August, up 4.1% MoM, with export volume showing steady growth.
Provincial export performances diverged: Fujian was the main export source in July, while Hubei took the lead in August, indicating low overseas demand for Chinese phosphate ore.
In August 2025, China’s phosphate ore export pattern shifted significantly, though the total export volume remained consistently low. Exports increased slightly by 4.1% MoM, staying at an extremely low level of 11,000 mt for two consecutive months. The major change this month was the complete shift of export activity from Fujian Province to Hubei Province.
**Note:** For further details or inquiries regarding solid-state battery or phosphate chemicals development, please contact:
Phone: 021-20707860 (or WeChat: 13585549799)
Contact: Chaoxing Yang. Thank you!