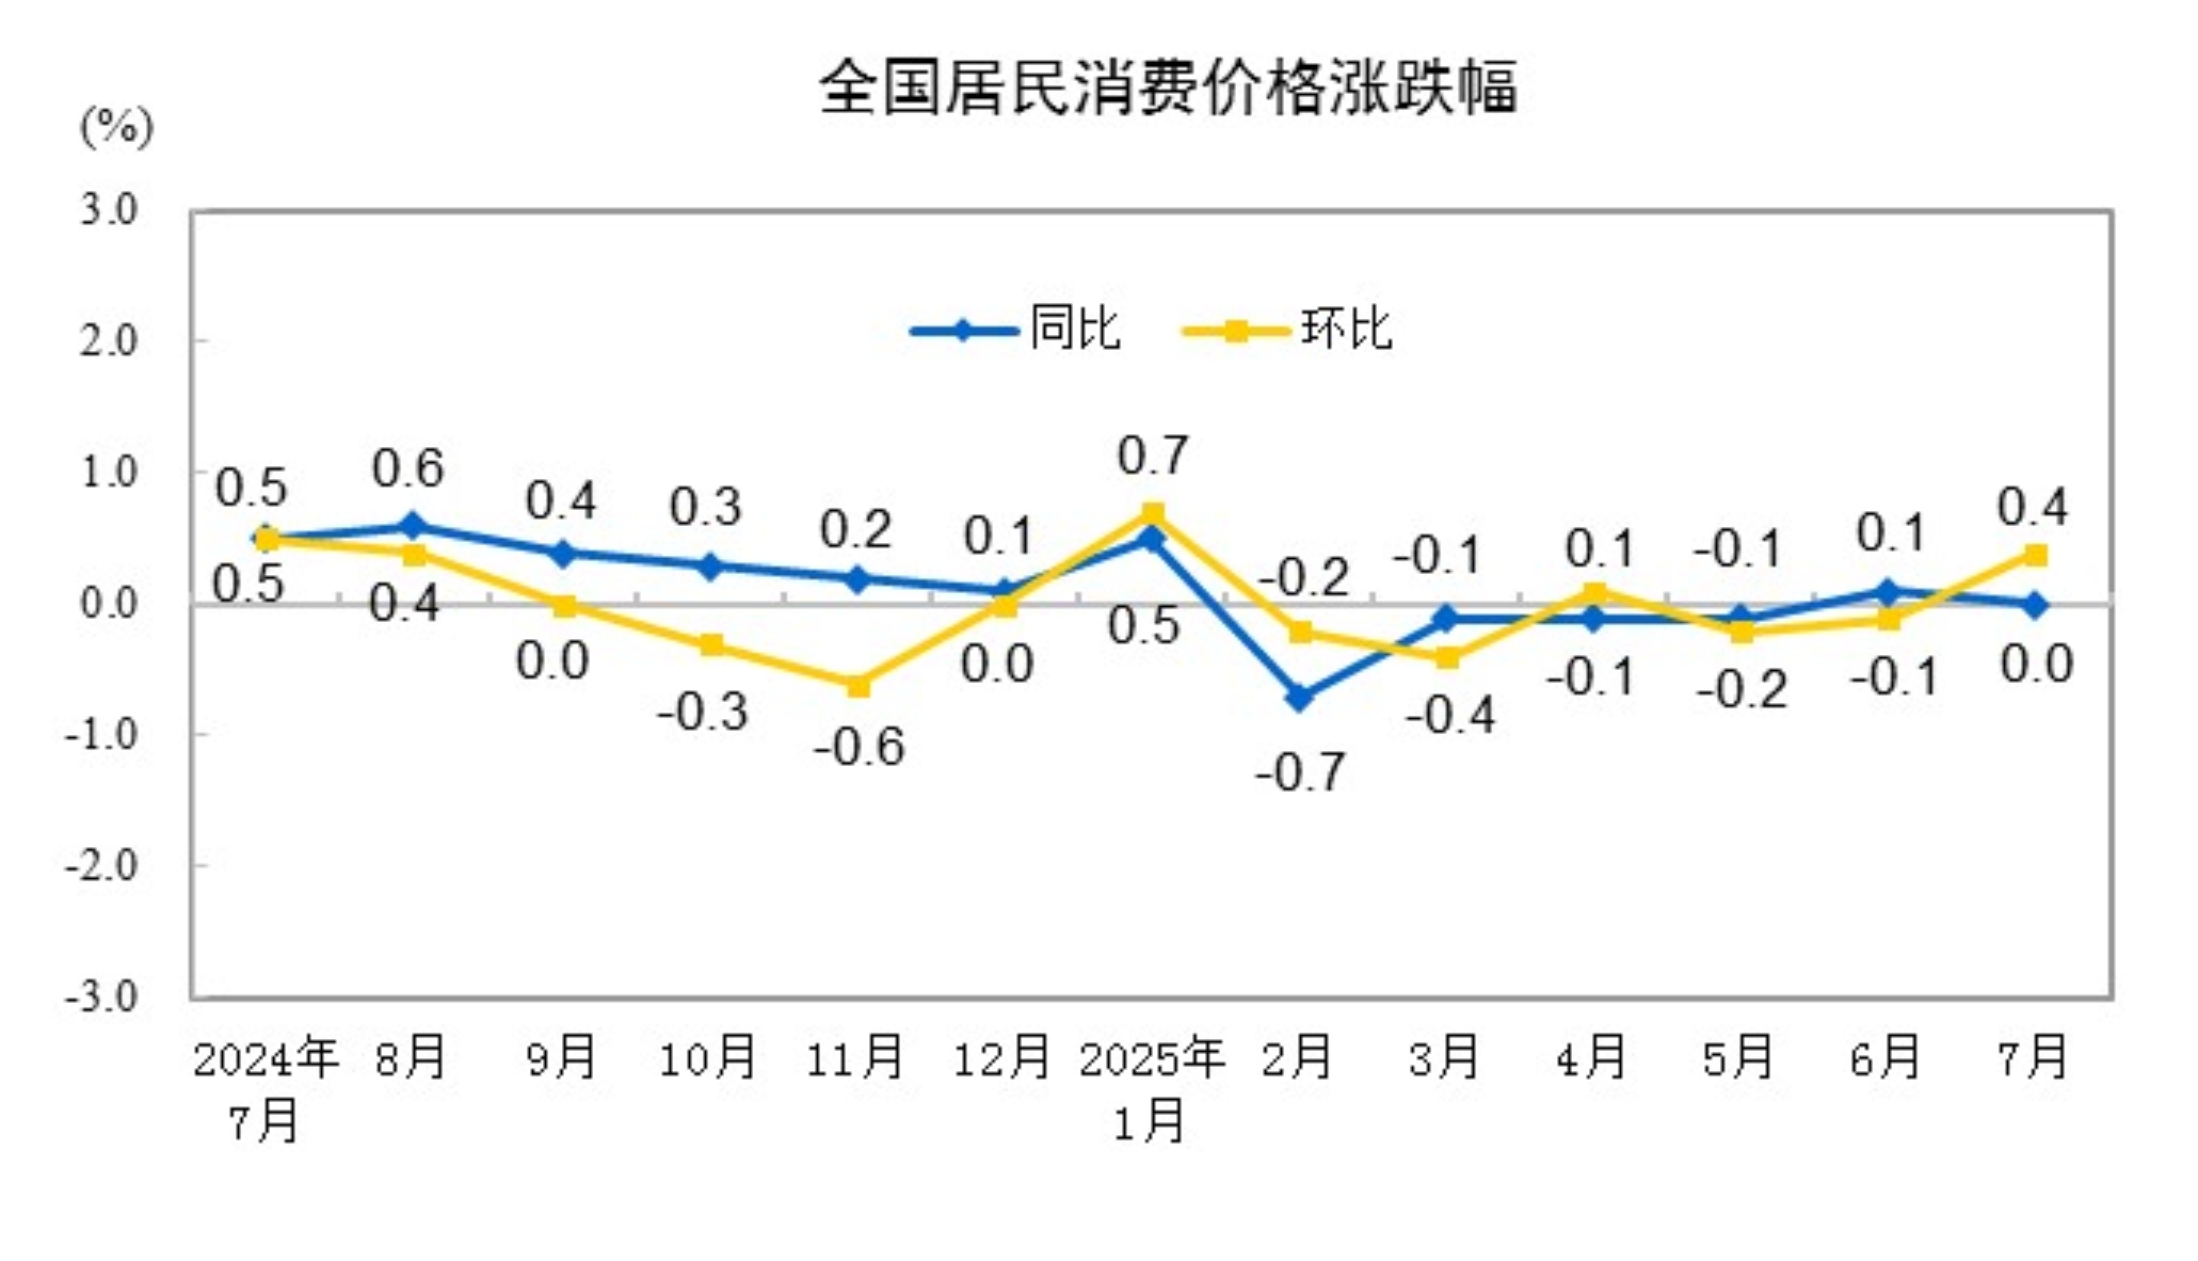
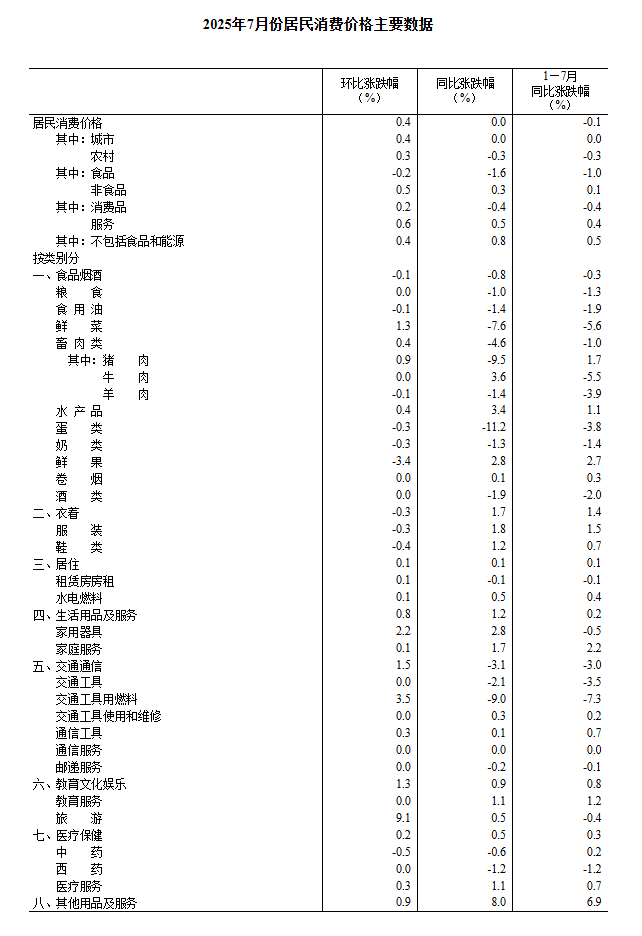
Data released by the National Bureau of Statistics (NBS) showed that in July, the national consumer price index (CPI) remained flat YoY. Specifically, it remained flat in urban areas and decreased by 0.3% in rural areas. Food prices decreased by 1.6%, while non-food prices increased by 0.3%. Prices of consumer goods decreased by 0.4%, while service prices increased by 0.5%. On average from January to July, the national CPI decreased by 0.1% compared with the same period last year. In July, the national CPI increased by 0.4% MoM. Specifically, it increased by 0.4% in urban areas and by 0.3% in rural areas. Food prices decreased by 0.2%, while non-food prices increased by 0.5%. Prices of consumer goods increased by 0.2%, while service prices increased by 0.6%.
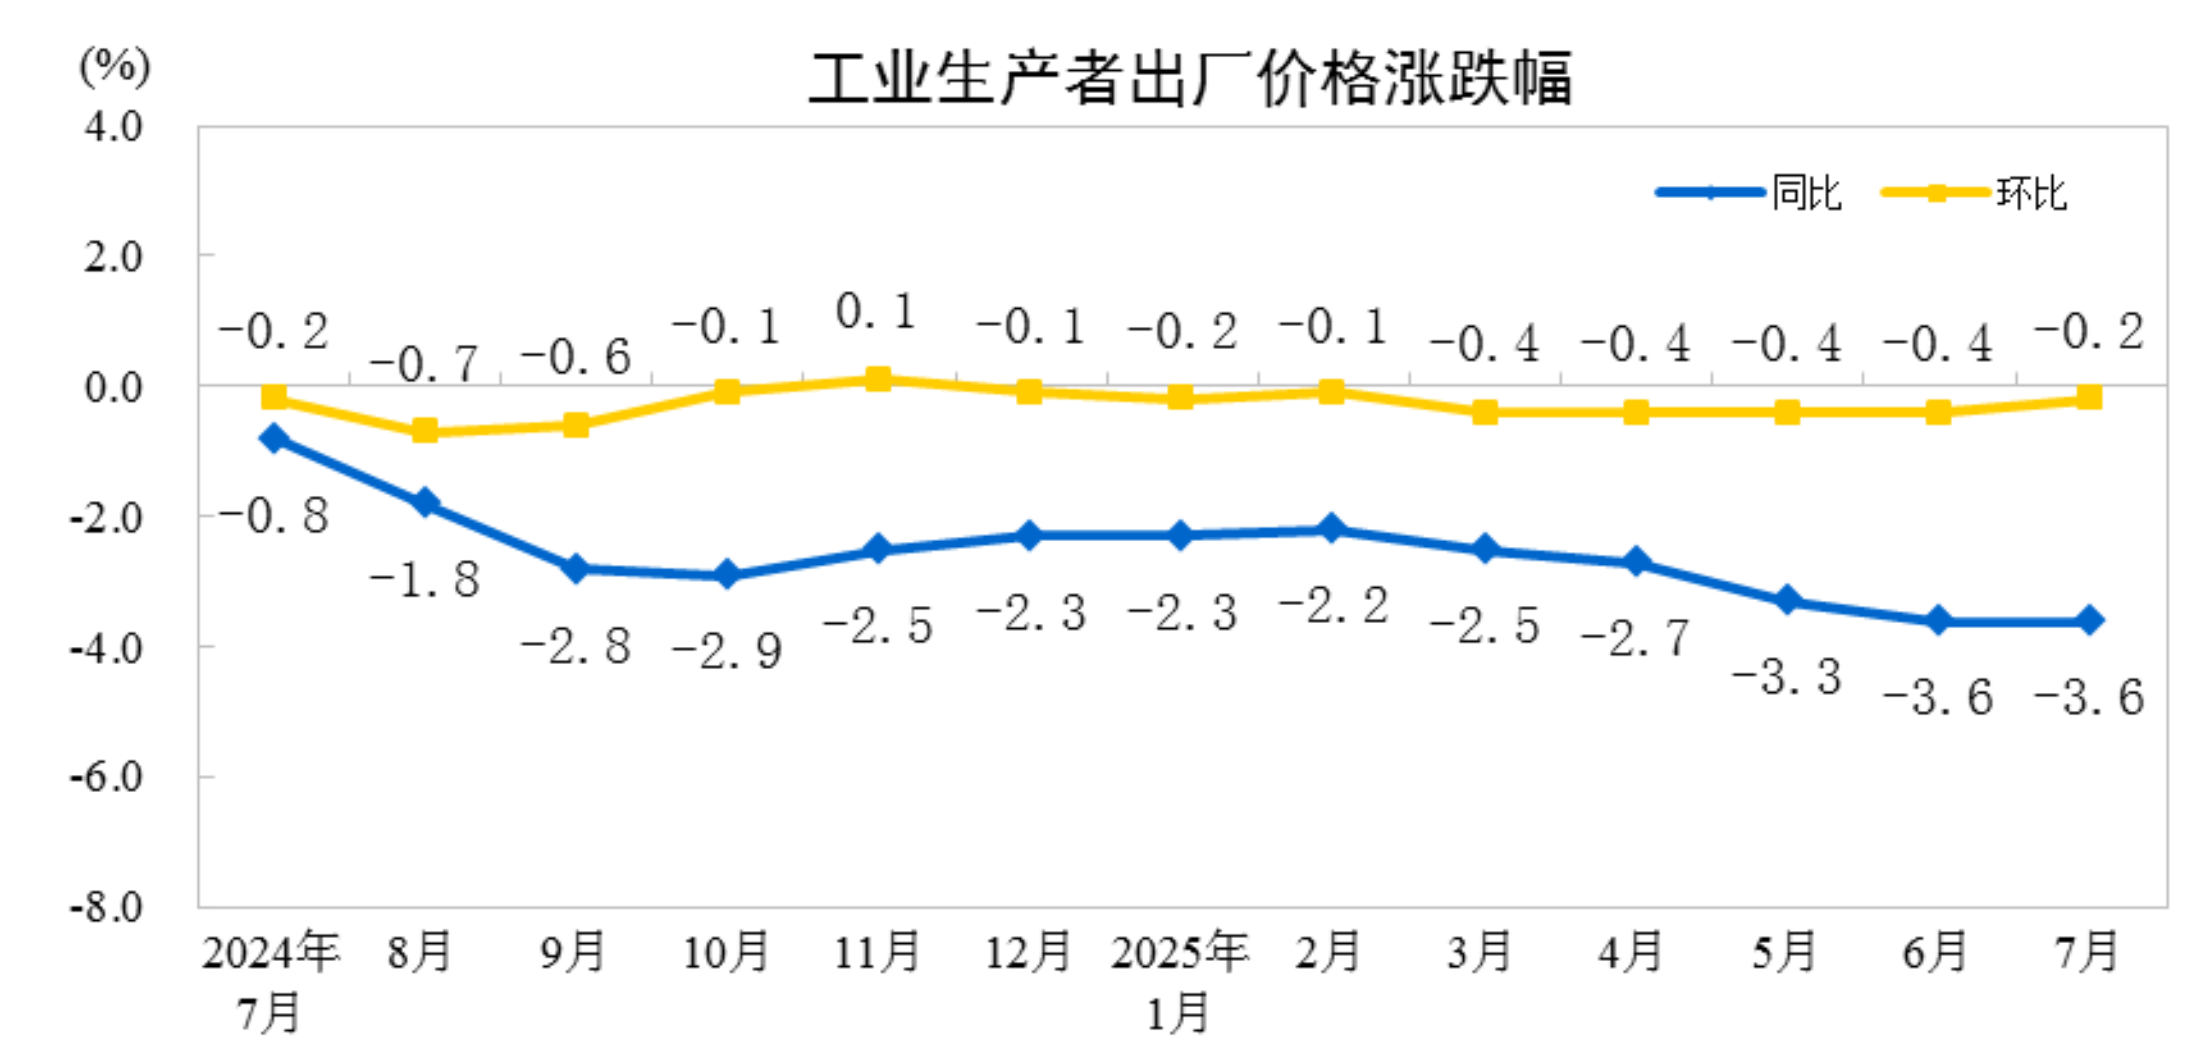
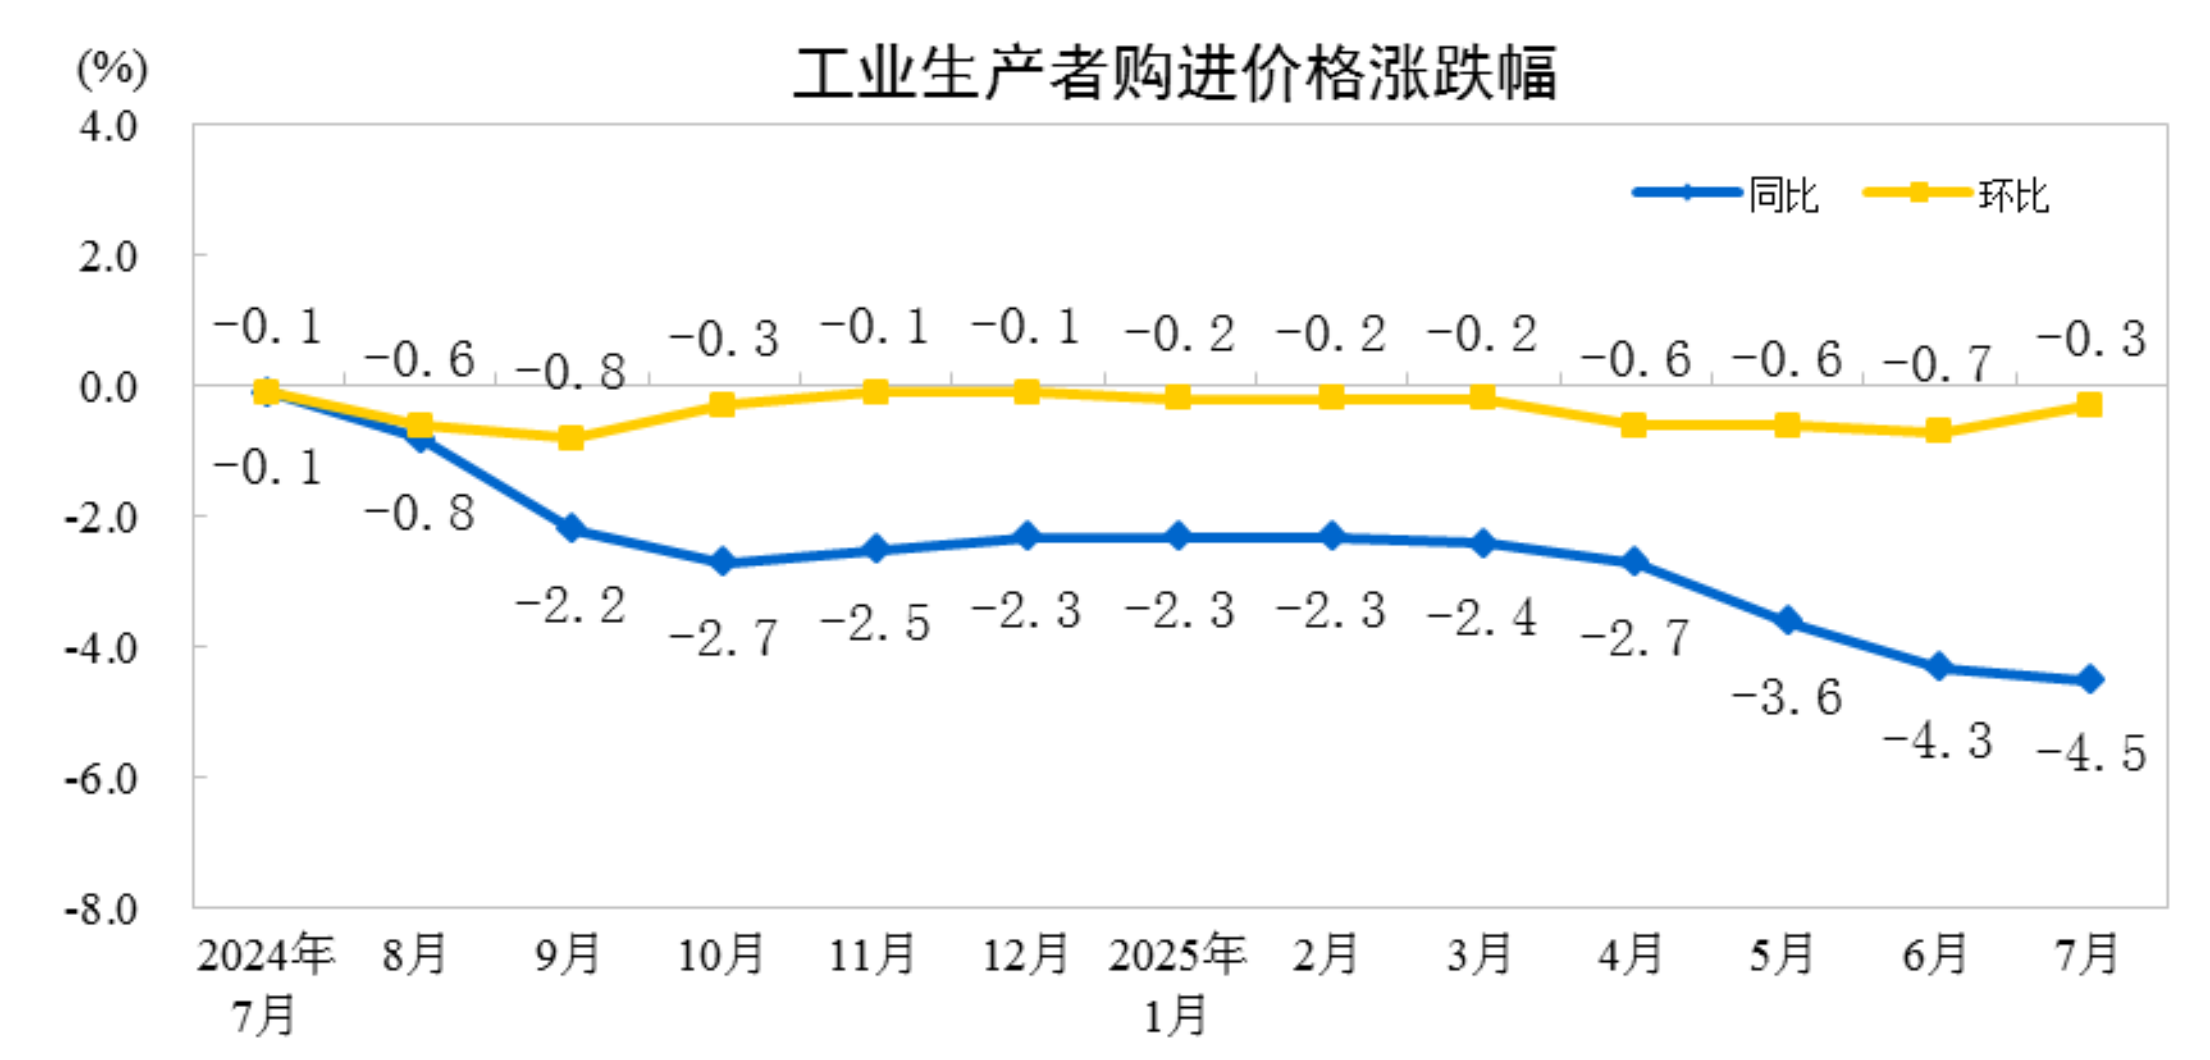
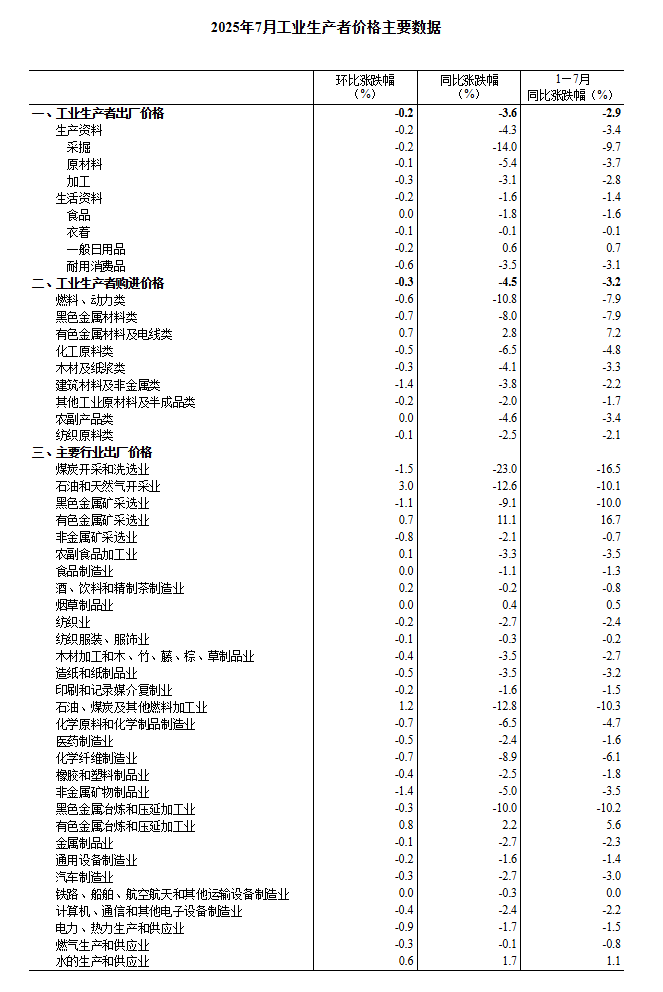
In July, the national ex-factory prices of industrial producers decreased by 0.2% MoM, and the purchase prices of industrial producers decreased by 0.3% MoM, with the decreases narrowing by 0.2 and 0.4 percentage points respectively compared with the previous month. The ex-factory prices of industrial producers decreased by 3.6% YoY, and the purchase prices of industrial producers decreased by 4.5% YoY. On average from January to July, the ex-factory prices of industrial producers decreased by 2.9% compared with the same period last year, and the purchase prices of industrial producers decreased by 3.2%.
Dong Lijuan, the chief statistician of the Urban Department of the NBS, interpreted the CPI and PPI data for July 2025.
In July 2025, the national CPI remained flat YoY.
In July 2025, the national CPI remained flat YoY. Specifically, it remained flat in urban areas and decreased by 0.3% in rural areas. Food prices decreased by 1.6%, while non-food prices increased by 0.3%. Prices of consumer goods decreased by 0.4%, while service prices increased by 0.5%. On average from January to July, the national CPI decreased by 0.1% compared with the same period last year.
In July, the national CPI increased by 0.4% MoM. Specifically, it increased by 0.4% in urban areas and by 0.3% in rural areas. Food prices decreased by 0.2%, while non-food prices increased by 0.5%. Prices of consumer goods increased by 0.2%, while service prices increased by 0.6%.
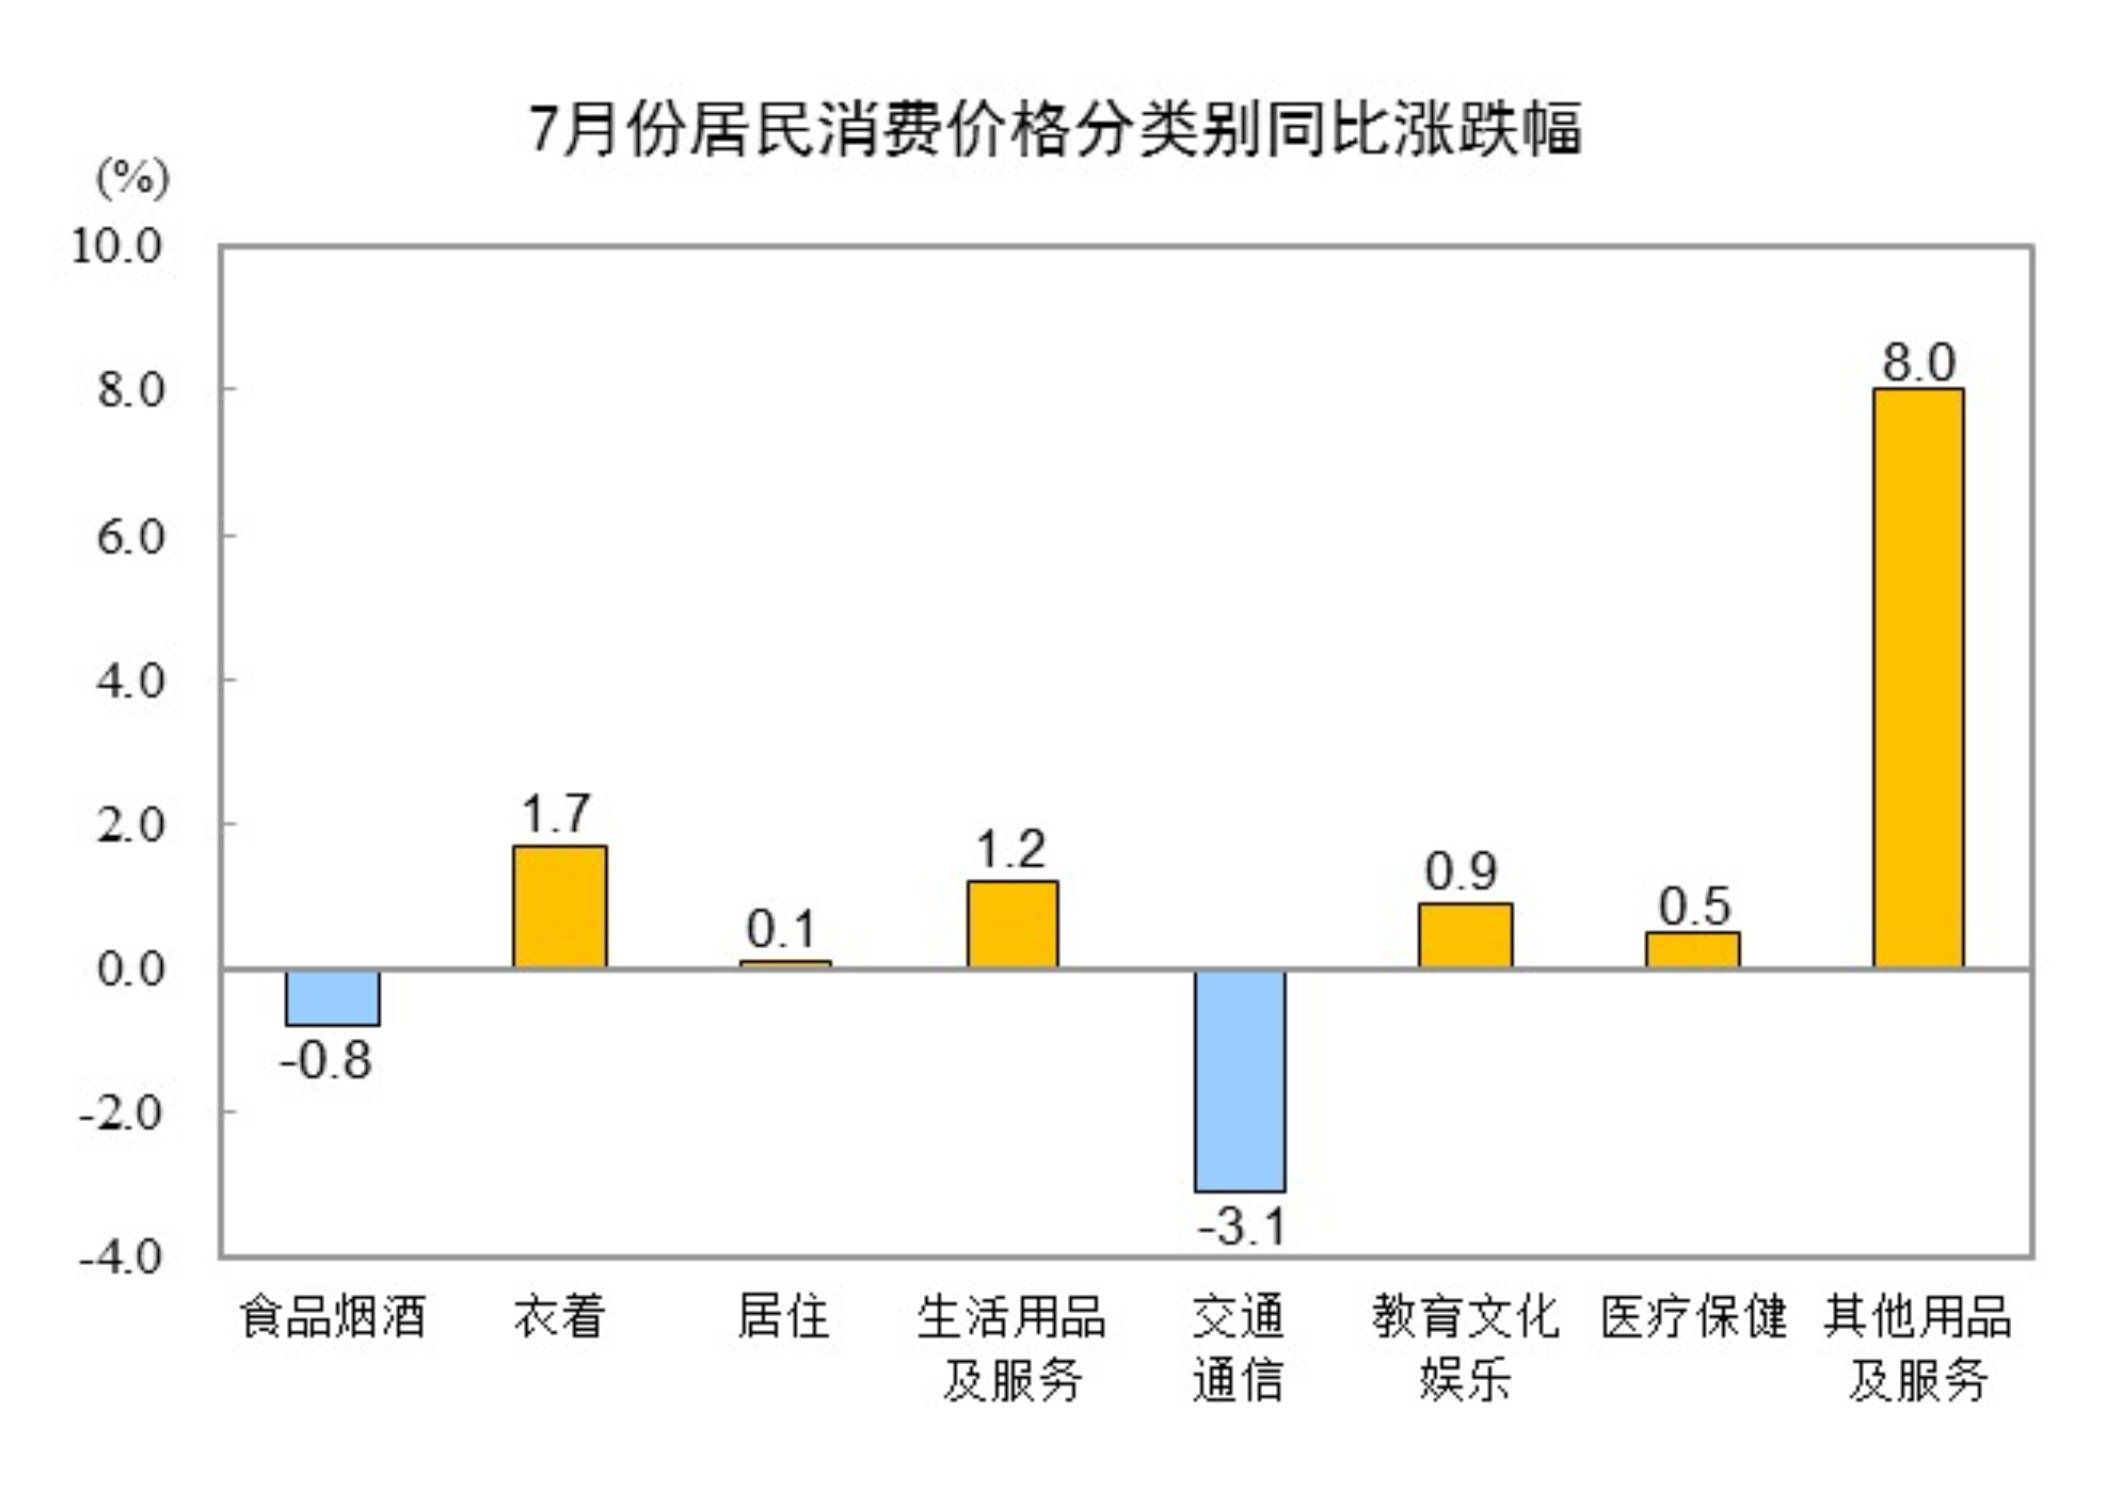
I. YoY Changes in Prices of Various Goods and Services
In July, the prices of food, tobacco, and alcohol decreased by 0.8% YoY, contributing to a decrease of approximately 0.21 percentage points in the CPI. Among food items, egg prices decreased by 11.2%, contributing to a decrease of approximately 0.07 percentage points in the CPI; fresh vegetable prices decreased by 7.6%, contributing to a decrease of approximately 0.16 percentage points in the CPI; livestock meat prices decreased by 4.6%, contributing to a decrease of approximately 0.14 percentage points in the CPI, with pork prices decreasing by 9.5%, contributing to a decrease of approximately 0.13 percentage points in the CPI; grain prices decreased by 1.0%, contributing to a decrease of approximately 0.02 percentage points in the CPI; aquatic product prices increased by 3.4%, contributing to an increase of approximately 0.07 percentage points in the CPI; and fresh fruit prices increased by 2.8%, contributing to an increase of approximately 0.06 percentage points in the CPI.
Prices for the other seven categories saw six increases and one decrease YoY. Among them, prices for other goods and services, clothing, and daily necessities and services rose by 8.0%, 1.7%, and 1.2% respectively, while prices for education, culture, and entertainment, healthcare, and housing rose by 0.9%, 0.5%, and 0.1% respectively. Prices for transportation and communication fell by 3.1%.
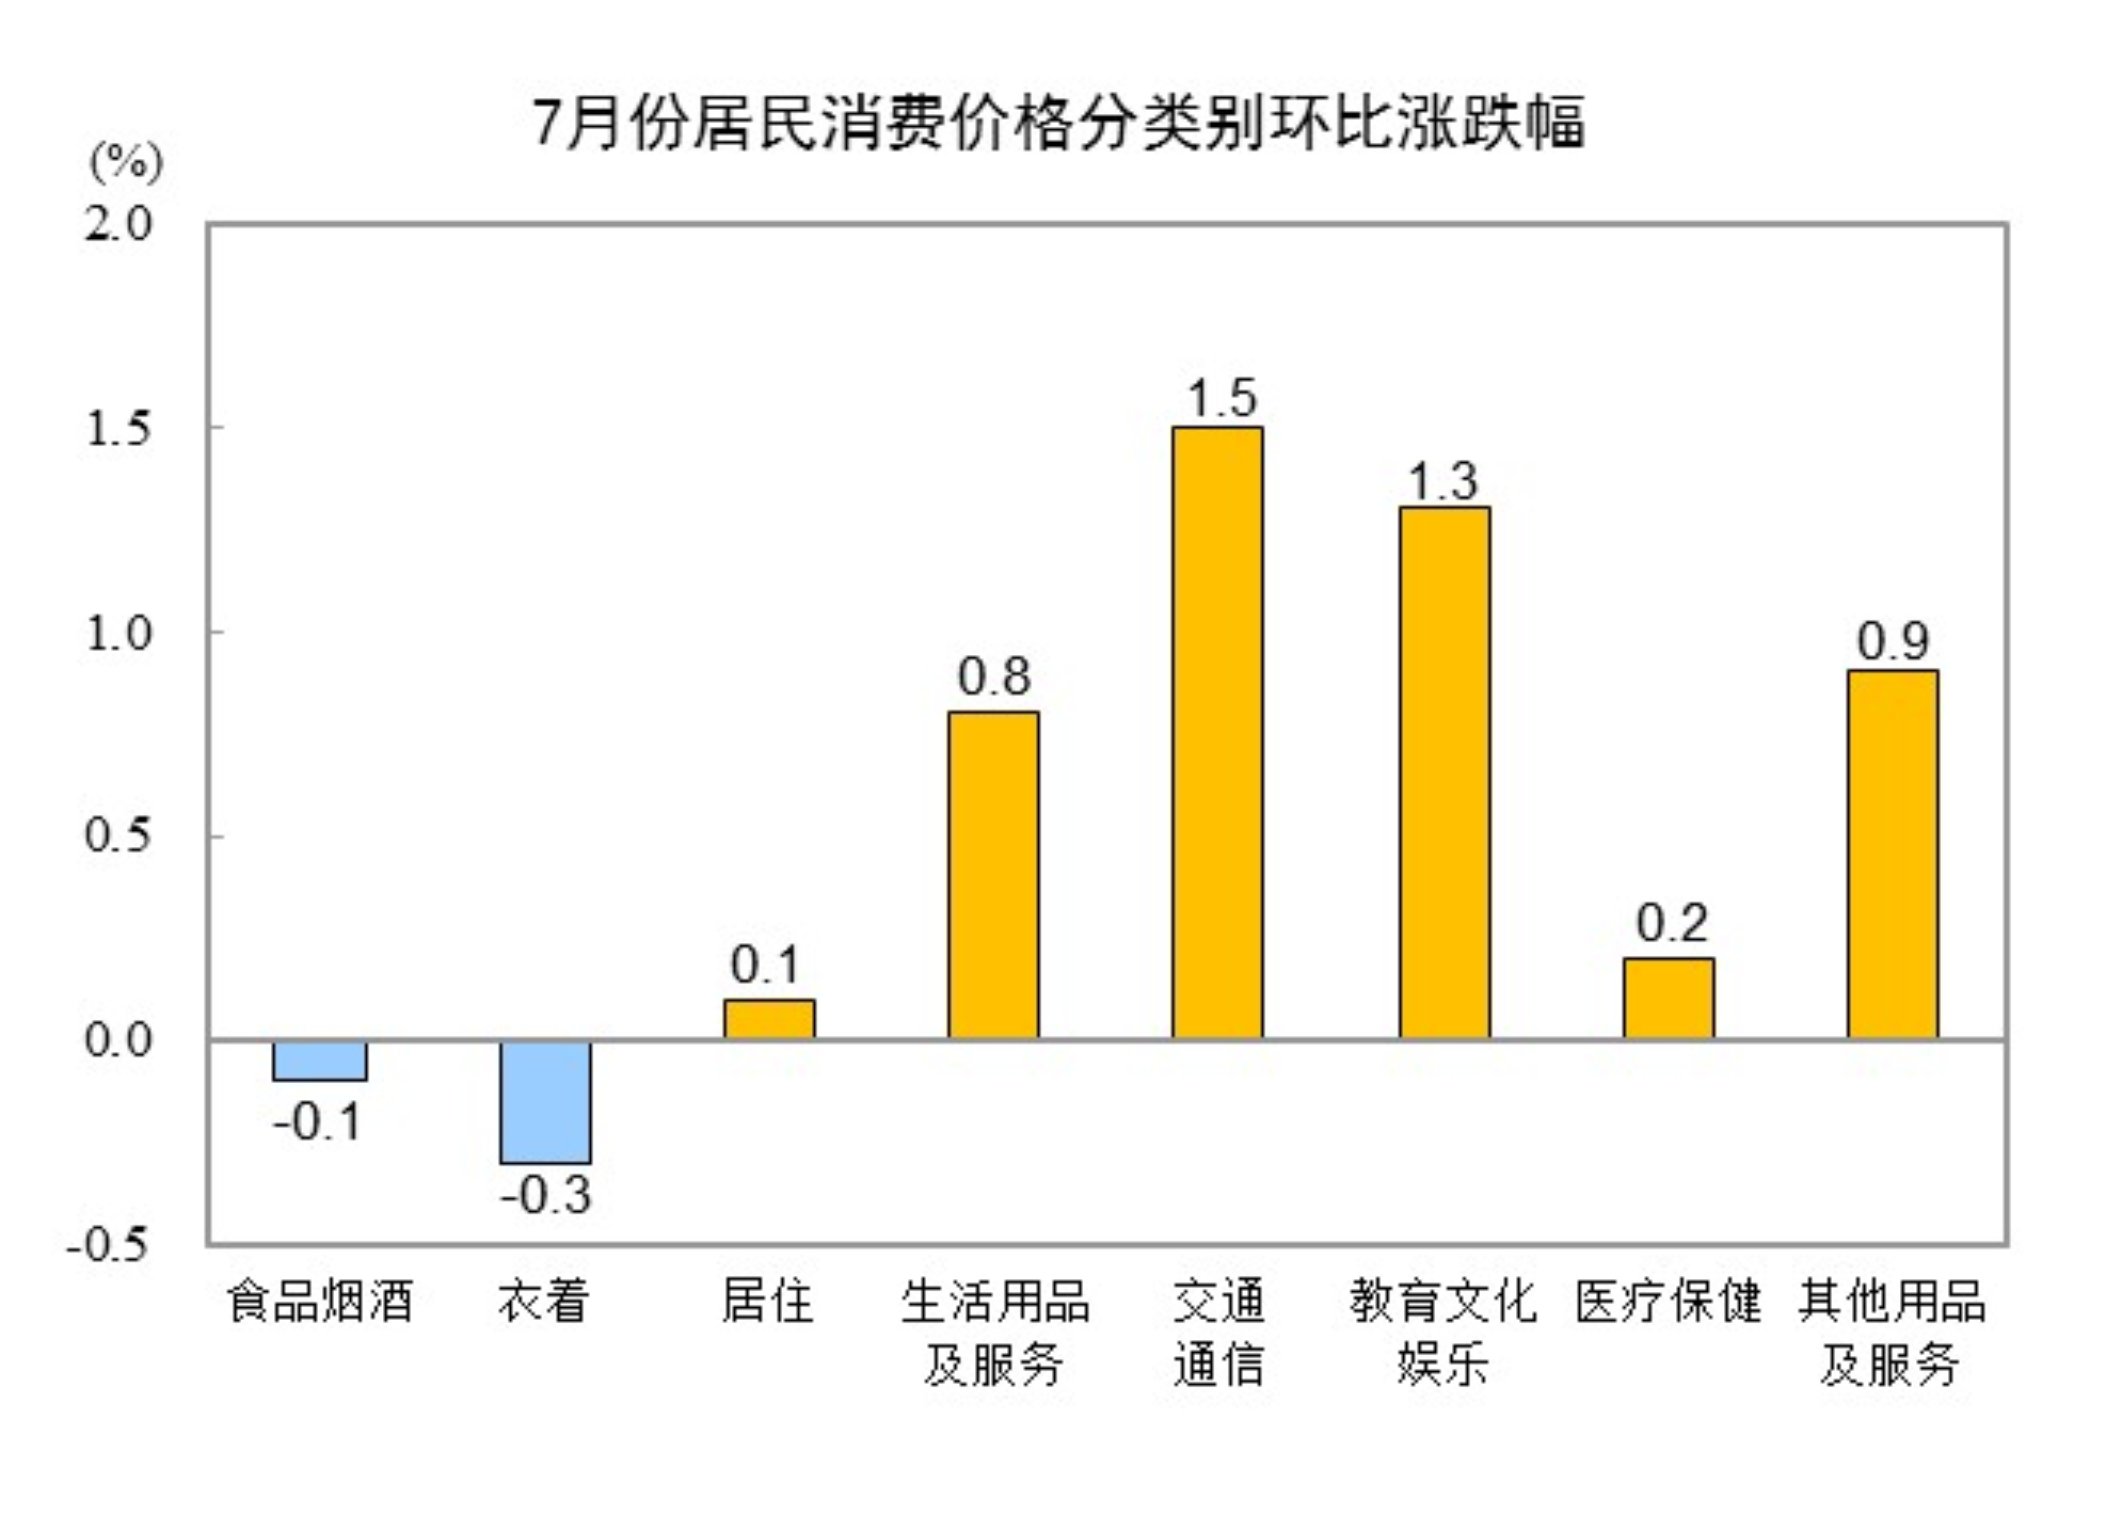
II. Month-on-Month Changes in Prices of Various Goods and Services
In July, prices for food, tobacco, and alcohol fell by 0.1% MoM, contributing to a decrease of approximately 0.04 percentage points in the CPI. Among food items, fresh fruit prices fell by 3.4%, contributing to a decrease of approximately 0.07 percentage points in the CPI; fresh vegetable prices rose by 1.3%, contributing to an increase of approximately 0.03 percentage points in the CPI; prices for livestock meat rose by 0.4%, contributing to an increase of approximately 0.01 percentage points in the CPI, with pork prices rising by 0.9%, contributing to an increase of approximately 0.01 percentage points in the CPI; and aquatic product prices rose by 0.4%, contributing to an increase of approximately 0.01 percentage points in the CPI.
Prices for the other seven categories saw six increases and one decrease MoM. Among them, prices for transportation and communication, education, culture, and entertainment, and other goods and services rose by 1.5%, 1.3%, and 0.9% respectively, while prices for daily necessities and services, healthcare, and housing rose by 0.8%, 0.2%, and 0.1% respectively. Clothing prices fell by 0.3% MoM.
Narrowing of Month-on-Month Decline in Ex-Factory Prices of Industrial Producers in July 2025
In July 2025, the ex-factory prices of industrial producers nationwide fell by 0.2% MoM, and the purchase prices of industrial producers fell by 0.3% MoM, with the declines narrowing by 0.2 and 0.4 percentage points respectively compared to the previous month. The ex-factory prices of industrial producers fell by 3.6% YoY, and the purchase prices of industrial producers fell by 4.5% YoY. On average from January to July, the ex-factory prices of industrial producers fell by 2.9% compared to the same period last year, and the purchase prices of industrial producers fell by 3.2%.
I. Year-on-Year Changes in Prices of Industrial Producers
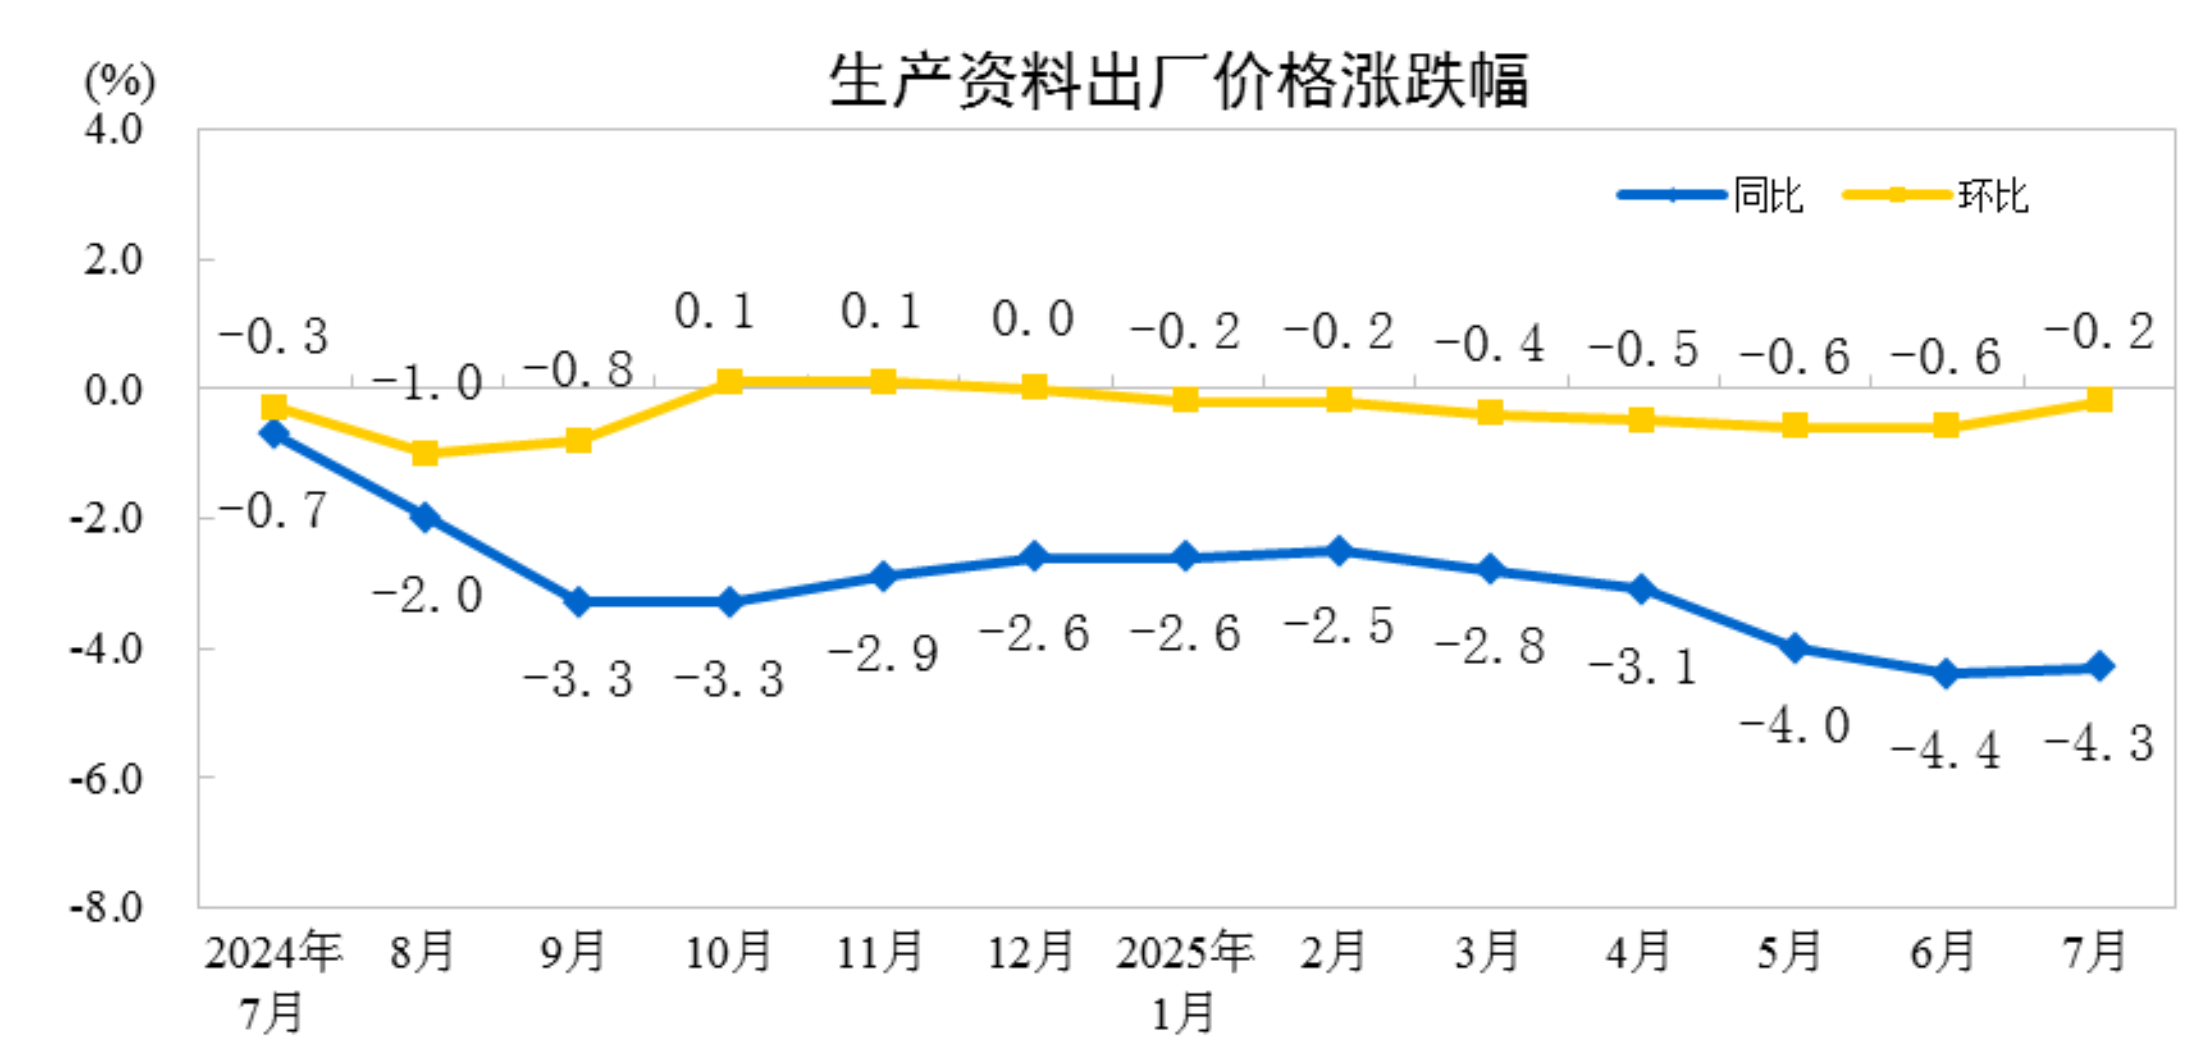
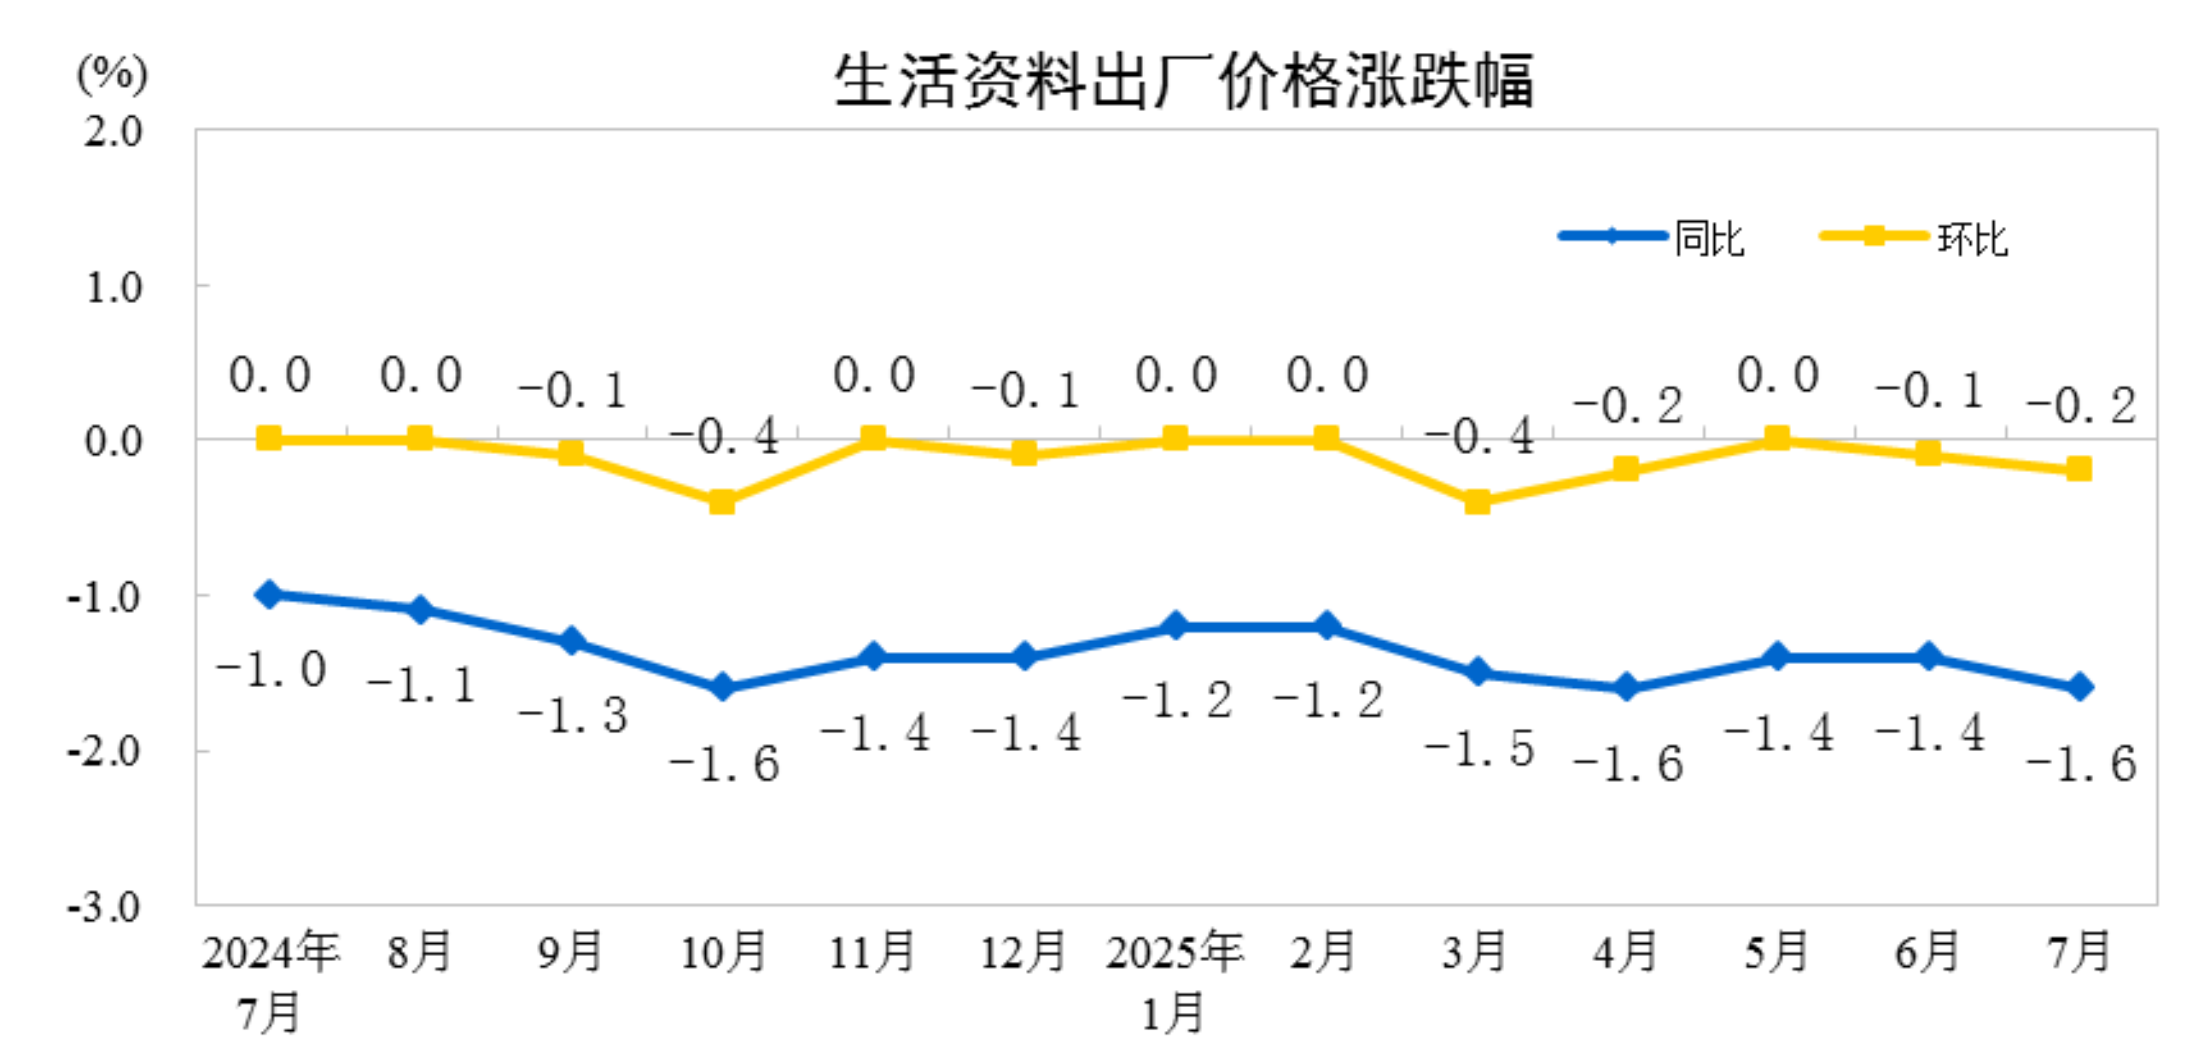
In July, among the ex-factory prices of industrial producers, prices for means of production fell by 4.3%, contributing to a decrease of approximately 3.20 percentage points in the overall level of ex-factory prices of industrial producers. Among them, prices for mining and quarrying industries fell by 14.0%, prices for raw material industries fell by 5.4%, and prices for processing industries fell by 3.1%. Prices for means of subsistence fell by 1.6%, contributing to a decrease of approximately 0.42 percentage points in the overall level of ex-factory prices of industrial producers. Among them, food prices fell by 1.8%, clothing prices fell by 0.1%, prices for general daily necessities rose by 0.6%, and prices for durable consumer goods fell by 3.5%.
Among the purchase prices of industrial producers, the prices of fuel and power fell by 10.8%, those of ferrous metal materials by 8.0%, those of chemical raw materials by 6.5%, those of agricultural and sideline products by 4.6%, those of building materials and non-metals by 3.8%, and those of textile raw materials by 2.5%; while the prices of non-ferrous metal materials and wires rose by 2.8%.
II. Month-on-Month Changes in Industrial Producer Prices
In July, among the ex-factory prices of industrial producers, the prices of means of production fell by 0.2%, contributing to a decrease of approximately 0.17 percentage points in the overall ex-factory price level of industrial producers. Specifically, the prices of mining and quarrying industries fell by 0.2%, those of raw material industries by 0.1%, and those of processing industries by 0.3%. The prices of means of subsistence fell by 0.2%, contributing to a decrease of approximately 0.06 percentage points in the overall ex-factory price level of industrial producers. Among them, food prices remained unchanged, clothing prices fell by 0.1%, general daily necessities prices fell by 0.2%, and durable consumer goods prices fell by 0.6%.
Among the purchase prices of industrial producers, the prices of building materials and non-metals fell by 1.4%, those of ferrous metal materials by 0.7%, those of fuel and power by 0.6%, those of chemical raw materials by 0.5%, and those of textile raw materials by 0.1%; while the prices of agricultural and sideline products remained unchanged; and the prices of non-ferrous metal materials and wires rose by 0.7%.
Core CPI Continued to Rebound on a YoY Basis in July 2025, While PPI's MoM Decline Narrowed
——Interpretation of CPI and PPI Data for July 2025 by Dong Lijuan, Chief Statistician of the Urban Department, National Bureau of Statistics (NBS)
In July, the effects of policies to expand domestic demand continued to manifest. The Consumer Price Index (CPI) rose by 0.4% MoM, reversing from a 0.1% MoM decline in the previous month, and remained unchanged YoY. Excluding food and energy prices, core CPI rose by 0.8% YoY, with the increase expanding for three consecutive months. Affected by seasonal factors and uncertainties in the international trade environment, the Producer Price Index (PPI) for industrial producers fell by 0.2% MoM. However, the domestic market competition order continued to improve, with the MoM decline narrowing by 0.2 percentage points compared to the previous month. PPI fell by 3.6% YoY, unchanged from the previous month.
I. CPI's MoM Increase Slightly Higher Than Seasonal Level, Core CPI Continued to Rebound on a YoY Basis
The effects of policies to expand domestic demand continued to manifest, with prices in the consumption sector continuing to show positive changes. Firstly, CPI rose by 0.4% MoM, 0.1 percentage points higher than the seasonal level. The MoM increase was mainly driven by the price increases in services and industrial consumer goods. Service prices rose 0.6% MoM, contributing to an approximate 0.26 percentage point increase in CPI MoM, accounting for over 60% of the total CPI increase. Among them, influenced by the peak travel season during the summer vacation, airfares, tourism, hotel accommodation, and transportation rental fees increased by 17.9%, 9.1%, 6.9%, and 4.4% MoM respectively, all exceeding seasonal levels, collectively contributing to an approximate 0.21 percentage point increase in CPI MoM. Industrial consumer goods prices rose 0.5% MoM, with the increase expanding by 0.4 percentage points from the previous month, contributing to an approximate 0.17 percentage point increase in CPI MoM. Among them, influenced by changes in international oil prices, energy prices rose 1.6% MoM, contributing to an approximate 0.12 percentage point increase in CPI MoM. Policies to boost consumption drove sustained demand recovery, coupled with the end of the "618" sales promotions, industrial consumer goods prices excluding energy rose 0.2% MoM. Prices of gasoline-powered and new energy passenger cars both turned from a decline of over five consecutive months to flat, while prices of household appliances, daily household sundries, entertainment durable consumer goods, and personal care products increased by between 0.5% and 2.2% MoM.
Secondly, core CPI continued to rebound YoY. Core CPI excluding food and energy prices rose 0.8% YoY, with the increase expanding by 0.1 percentage points from the previous month, reaching the highest level since March 2024. Among them, prices of gold and platinum jewelry rose 37.1% and 27.3% YoY respectively, collectively contributing to an approximate 0.22 percentage point increase in CPI YoY. Service prices rose 0.5% YoY, with the increase remaining stable, contributing to an approximate 0.19 percentage point increase in CPI. Prices of gasoline-powered and new energy passenger cars fell 2.6% and 1.9% YoY respectively, with the decreases being the smallest in nearly 34 months and 28 months respectively.
Secondly, PPI's YoY decline remained unchanged while MoM decline narrowed.
PPI fell 0.2% MoM, with the decline narrowing by 0.2 percentage points from the previous month, marking the first MoM decline narrowing since March. Main reasons for the MoM change in PPI this month: First, seasonal factors combined with the uncertainty in the international trade environment have led to price declines in some industries. The increase in high-temperature and rainy weather during summer has slowed down the construction progress of building projects, affecting the demand for building materials. On the other hand, the abundant water flow in some regions has significantly enhanced the substitution effect of hydropower for thermal power generation, reducing the demand for thermal coal and leading to a decline in electricity prices. As a result, the prices of non-metallic mineral products industry fell by 1.4% MoM, and the prices of ferrous metals smelting and rolling processing industry decreased by 0.3% MoM. The prices of coal mining and washing industry fell by 1.5% MoM, and the prices of electricity, heat power production and supply industry fell by 0.9% MoM. Under the influence of the uncertainty in the international trade environment, the prices of computer, communication and other electronic equipment manufacturing industry fell by 0.4% MoM, the prices of automobile manufacturing industry fell by 0.3% MoM, the prices of electrical machinery and equipment manufacturing industry fell by 0.2% MoM, and the prices of general equipment manufacturing industry fell by 0.2% MoM. The combined impact of these eight industries on the MoM decline in PPI was approximately 0.24 percentage points. Second, the continuous optimization of the domestic market competition order has narrowed the price declines in related industries. With the in-depth advancement of the construction of a unified national market, the market competition order in industries such as coal, steel, PV, cement, and lithium battery has continued to improve. The MoM declines in the prices of coal mining and washing industry, ferrous metals smelting and rolling processing industry, PV equipment and components manufacturing, cement manufacturing, and lithium-ion battery manufacturing narrowed by 1.9, 1.5, 0.8, 0.3, and 0.1 percentage points respectively compared to the previous month. The combined downward impact on PPI MoM was reduced by 0.14 percentage points compared to the previous month. In addition, international input factors have boosted the domestic prices of petroleum and non-ferrous metal-related industries. The prices of oil and natural gas extraction industry rose by 3.0% MoM, and the prices of non-ferrous metal smelting and rolling processing industry rose by 0.8% MoM.
PPI fell by 3.6% YoY, with the decline remaining the same as the previous month. With the continuous and timely implementation of macro policies, the supply-demand relationship in some industries has improved, and prices have shown positive changes. First, industrial transformation and upgrading have boosted the YoY rebound in prices of related industries. The gradual advancement of the transformation and upgrading of traditional industries and the capacity management of key industries, along with the rapid growth and expansion of emerging industries, have led to a YoY rebound in prices of related industries. Caustic soda prices rose by 3.6% YoY, and the decline in glass manufacturing prices narrowed by 0.9 percentage points compared to the previous month. Aircraft manufacturing prices rose by 3.0% YoY, wearable smart device manufacturing prices rose by 1.6% YoY, microwave communication equipment prices rose by 0.9% YoY, and server prices rose by 0.6% YoY. Second, the continuous release of domestic demand potential has boosted the YoY increase in prices of some industries. The special initiative to boost consumption has been thoroughly implemented, leading to the sustained and healthy development of the consumer market. The increase in demand for upgraded consumption has boosted price increases in some industries on a YoY basis. Prices for arts and crafts and ceremonial supplies manufacturing rose by 13.1%, prices for sports ball manufacturing rose by 5.3%, prices for nutritional food manufacturing rose by 1.3%, prices for health food manufacturing rose by 1.2%, and prices for bicycle manufacturing rose by 0.6%.