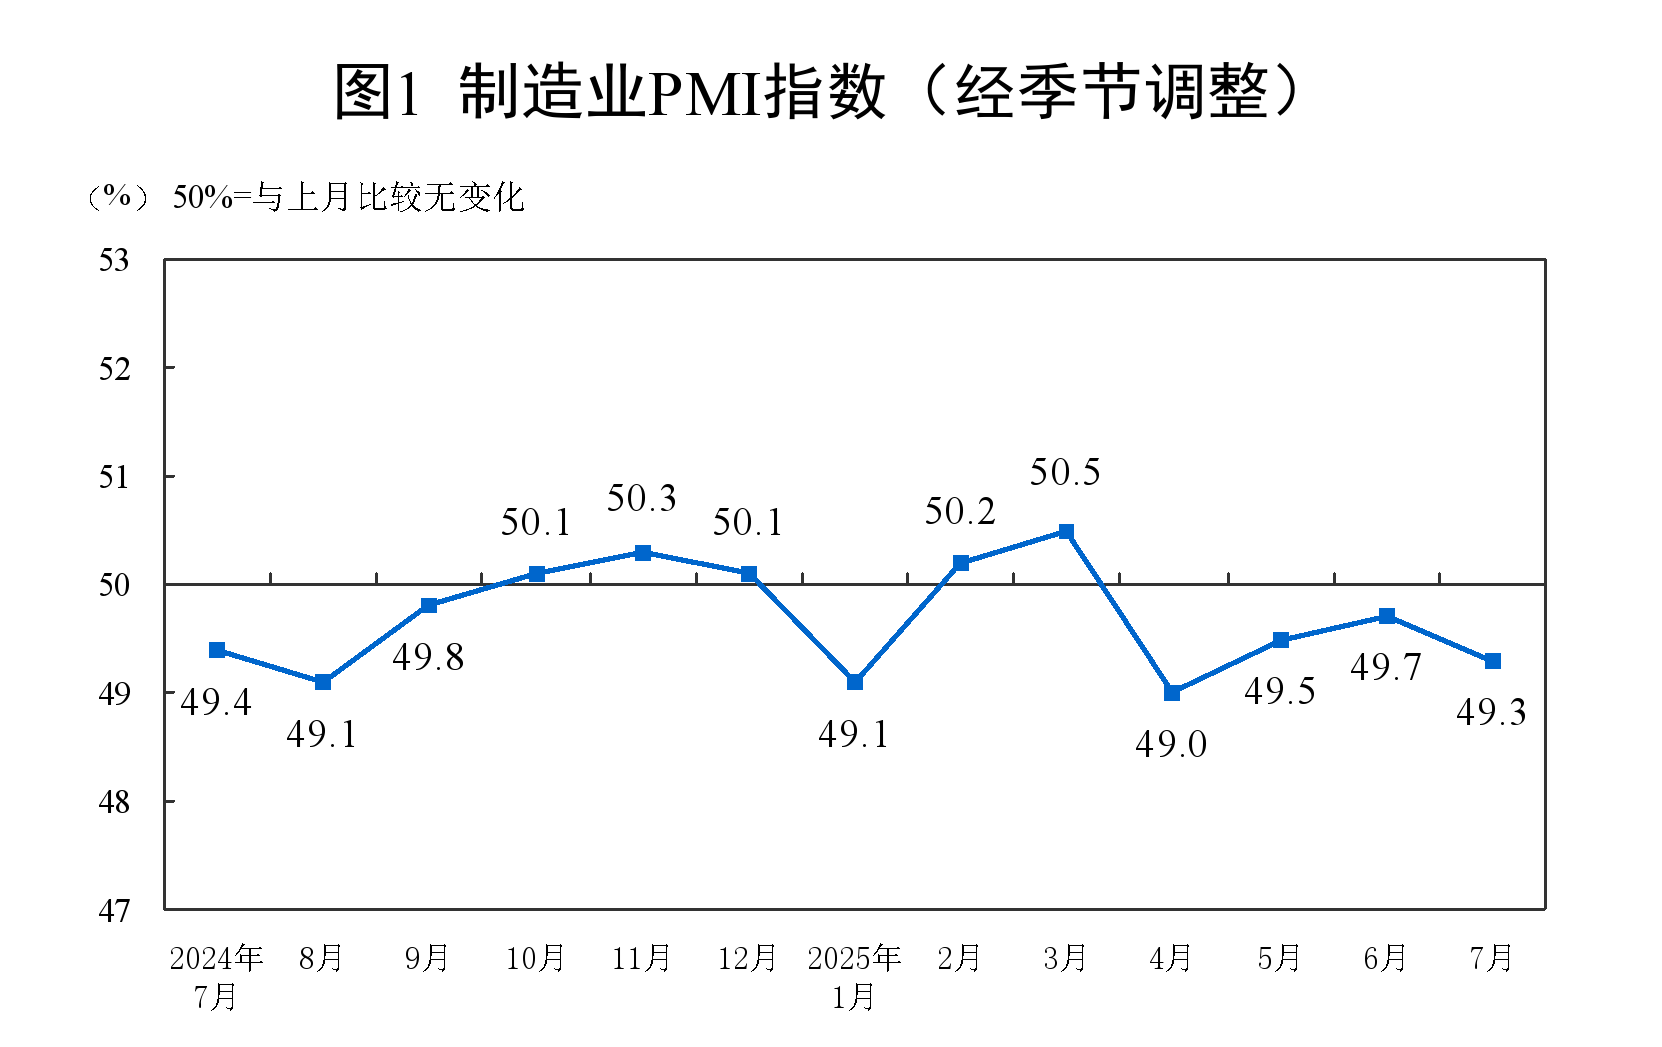
According to data from the National Bureau of Statistics (NBS), in July, the manufacturing purchasing managers' index (PMI) stood at 49.3%, a decrease of 0.4 percentage points from the previous month, indicating a pullback in the manufacturing sector's prosperity level.
Zhao Qinghe, a senior statistician from the NBS Service Industry Survey Center, interpreted China's PMI for July 2025.
Performance of China's PMI in July 2025
I. Performance of China's Manufacturing PMI
In July, the manufacturing purchasing managers' index (PMI) stood at 49.3%, a decrease of 0.4 percentage points from the previous month, indicating a pullback in the manufacturing sector's prosperity level.
By enterprise size, the PMI for large enterprises was 50.3%, a decrease of 0.9 percentage points from the previous month, remaining above the threshold; the PMI for medium-sized enterprises was 49.5%, an increase of 0.9 percentage points from the previous month, staying below the threshold; the PMI for small enterprises was 46.4%, a decrease of 0.9 percentage points from the previous month, remaining below the threshold.
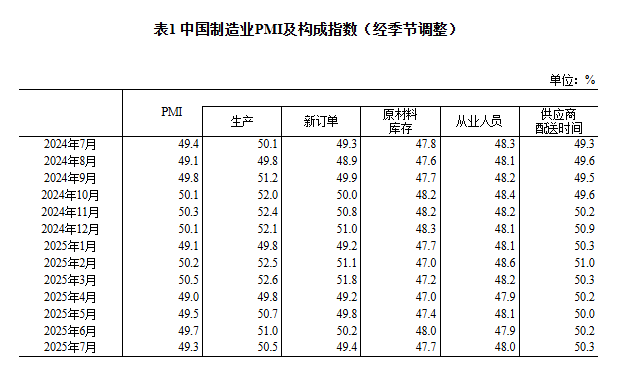
By sub-indices, among the five sub-indices that constitute the manufacturing PMI, the production index and the supplier delivery time index were both above the threshold, while the new orders index, the raw material inventory index, and the employment index were below the threshold.
The production index was 50.5%, a decrease of 0.5 percentage points from the previous month, still remaining above the threshold, indicating a continued expansion in manufacturing production.
The new orders index was 49.4%, a decrease of 0.8 percentage points from the previous month, indicating a slowdown in manufacturing market demand.
The raw material inventory index was 47.7%, a decrease of 0.3 percentage points from the previous month, indicating a continued decrease in the inventory of major raw materials in the manufacturing sector.
The employment index was 48.0%, an increase of 0.1 percentage points from the previous month, indicating a slight rebound in the employment prosperity of manufacturing enterprises.
The supplier delivery time index was 50.3%, an increase of 0.1 percentage points from the previous month, indicating a continued acceleration in the delivery time of raw material suppliers in the manufacturing sector.
II. Performance of China's Non-manufacturing PMI
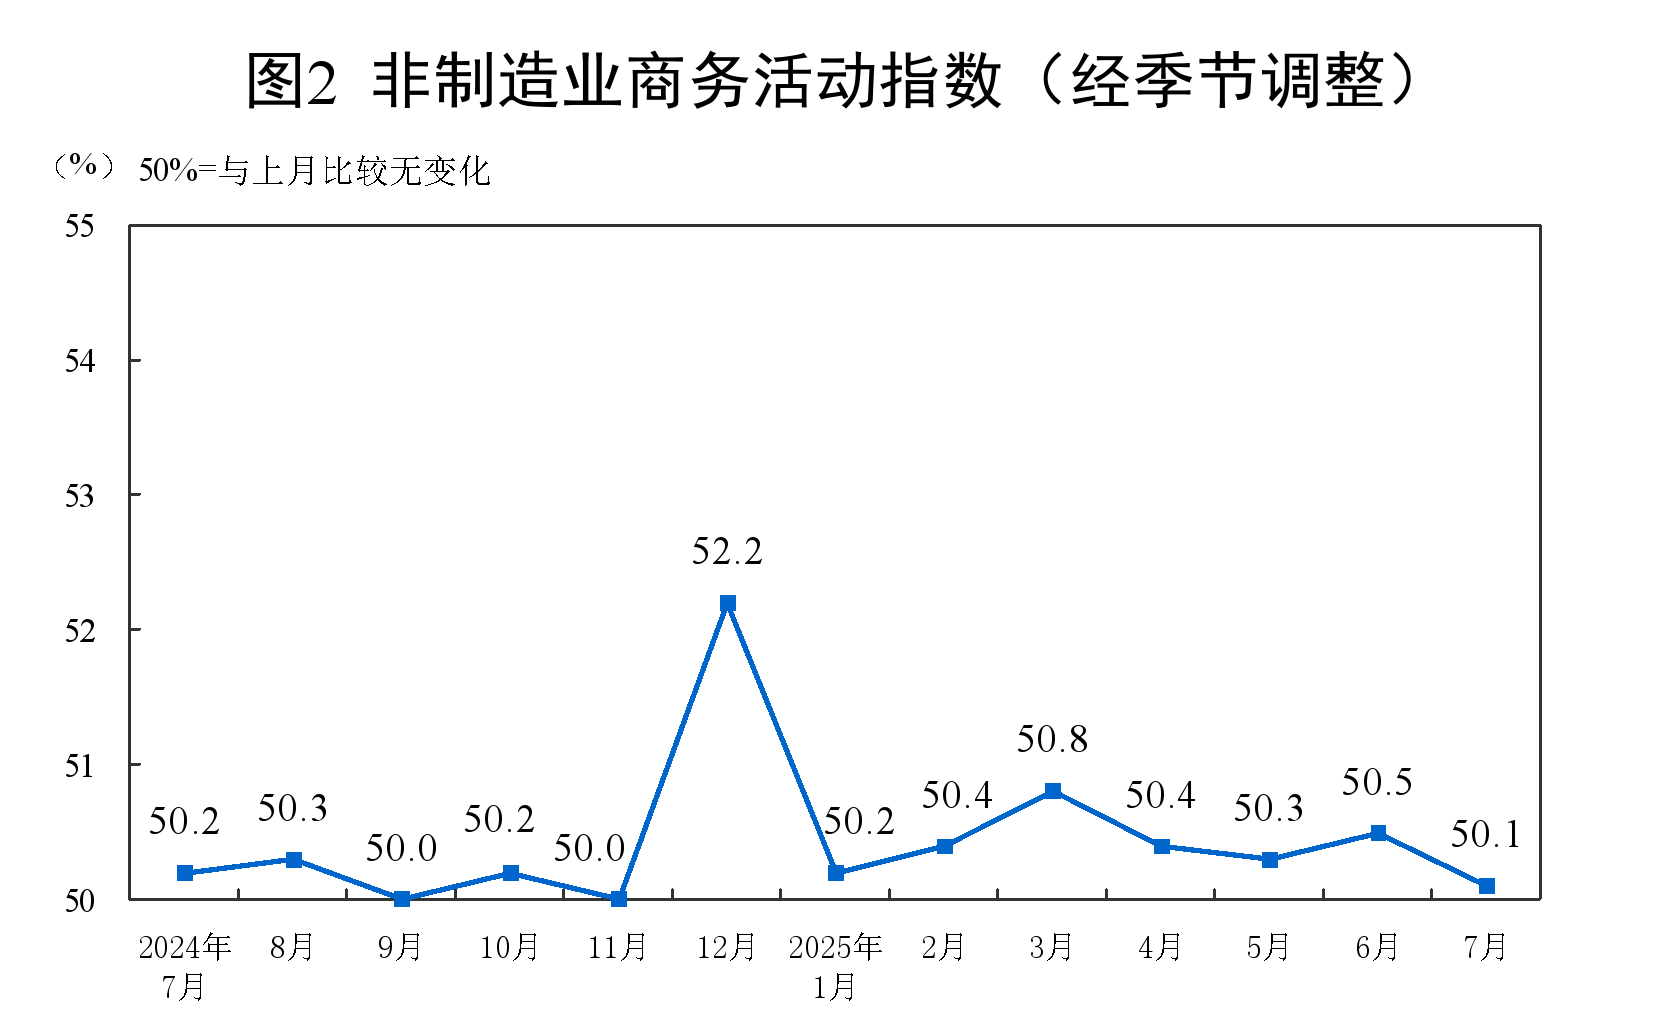
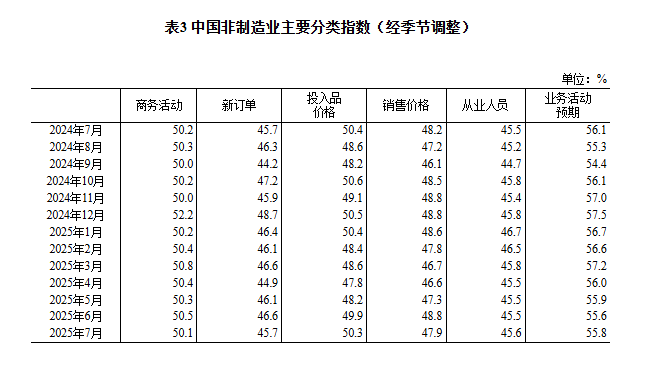
In July, the non-manufacturing business activity index was 50.1%, a decrease of 0.4 percentage points from the previous month, still remaining above the threshold.
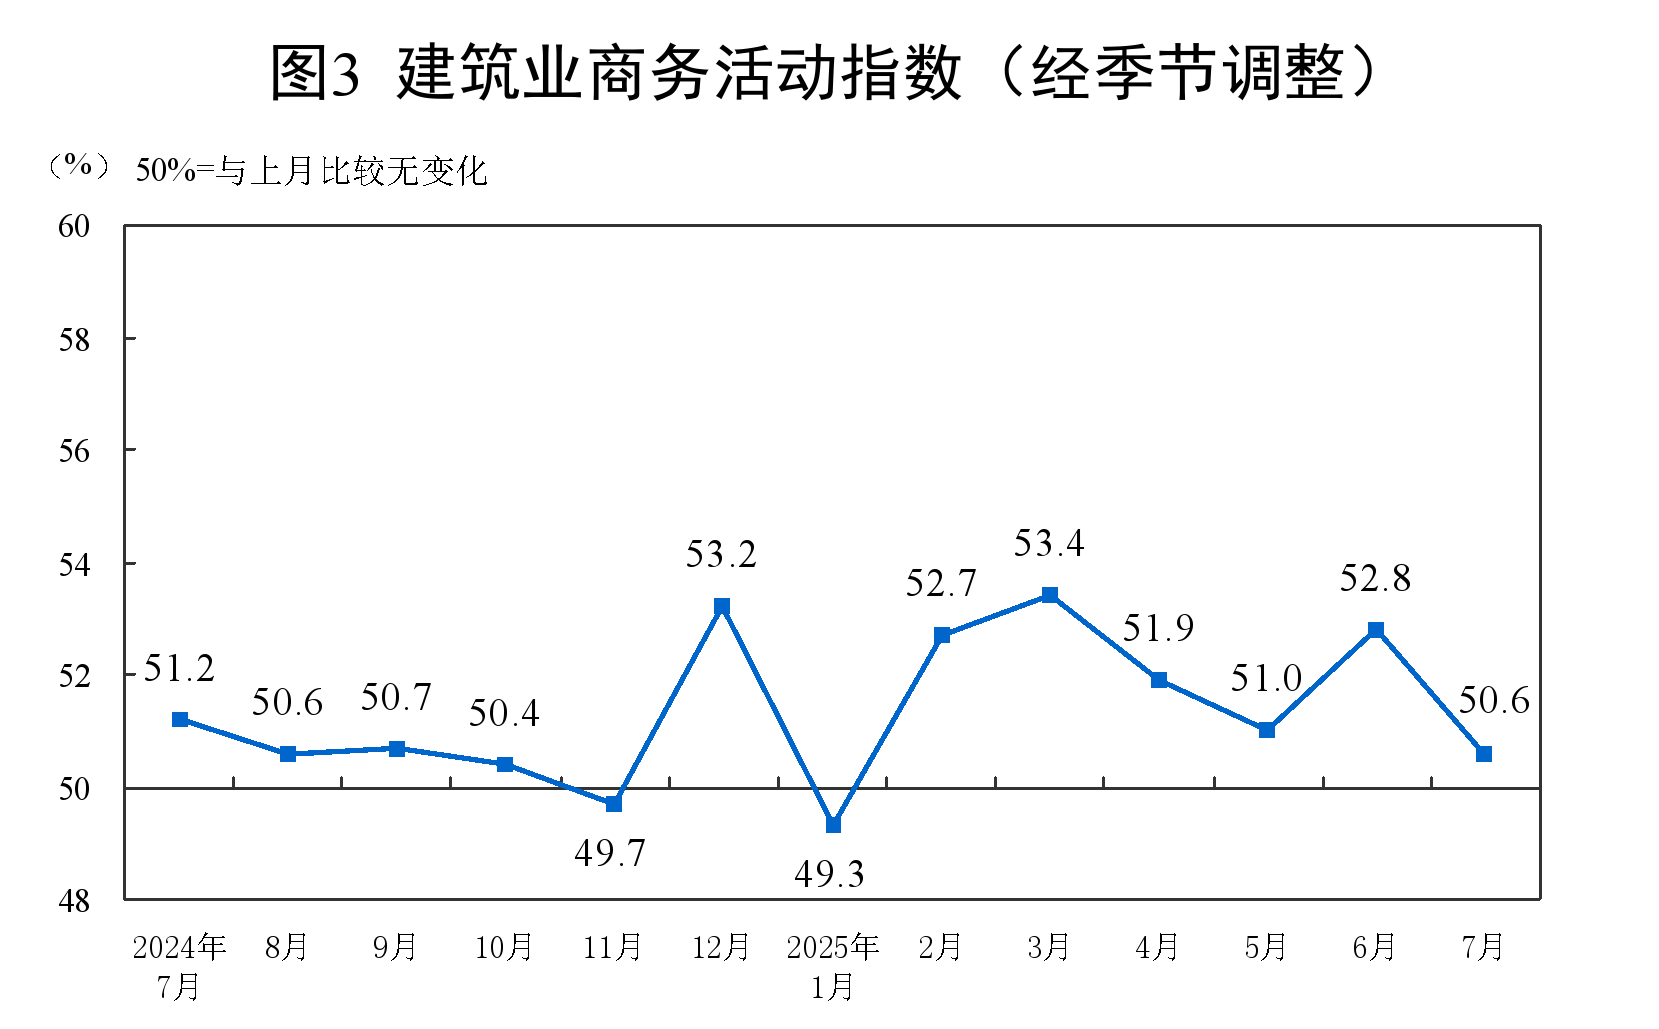
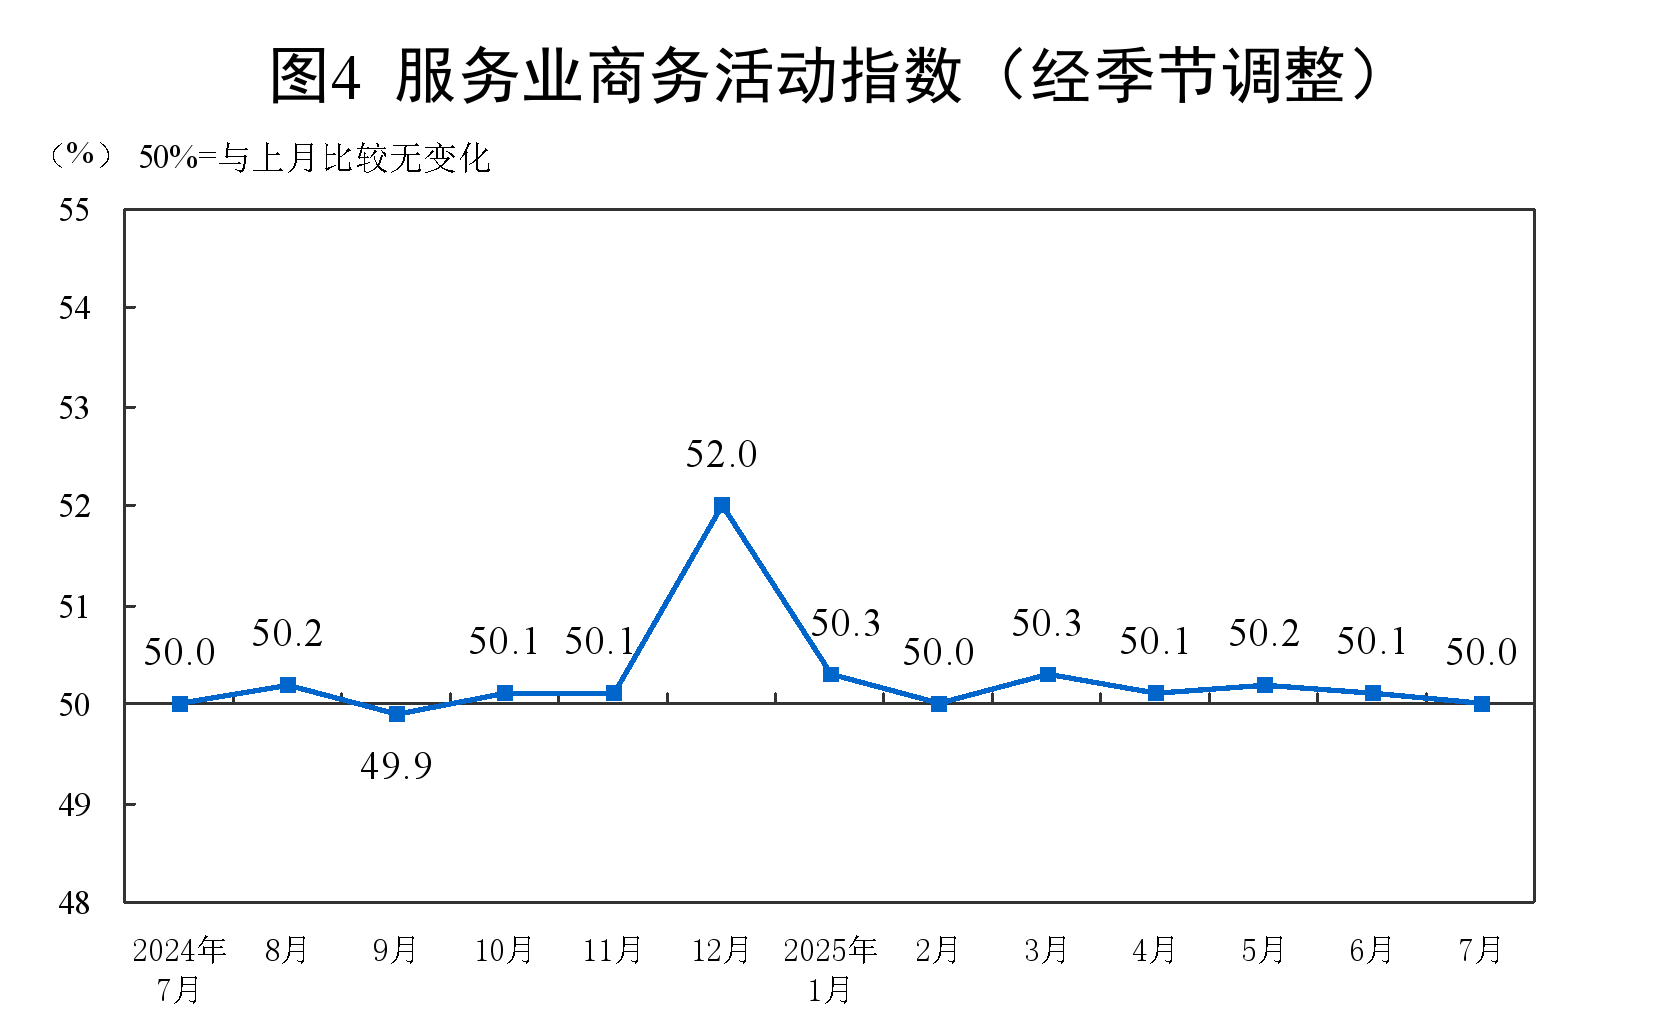
By industry, the business activity index for the construction industry was 50.6%, a decrease of 2.2 percentage points from the previous month; the business activity index for the service industry was 50.0%, a decrease of 0.1 percentage points from the previous month. By industry, the business activity indices for railway transportation, air transportation, postal services, culture, sports, and entertainment were all above the high-prosperity range of 60.0%; the business activity indices for real estate, residential services, and other industries were all below the threshold.
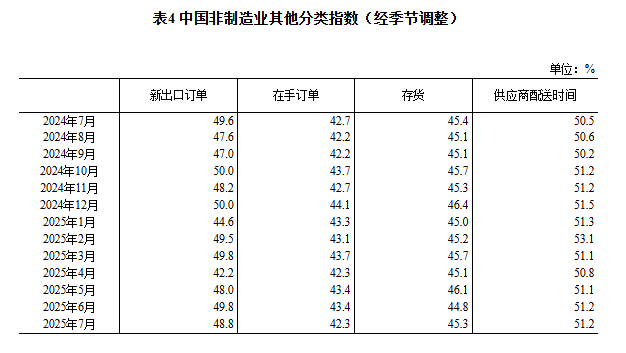
The new orders index stood at 45.7%, a decrease of 0.9 percentage points MoM, indicating a pullback in market demand for the non-manufacturing sector. By industry, the new orders index for the construction industry was 42.7%, a decrease of 2.2 percentage points MoM, while that for the service industry was 46.3%, a decrease of 0.6 percentage points MoM.
The input prices index was 50.3%, an increase of 0.4 percentage points MoM, indicating an overall rise in the prices of inputs used by non-manufacturing enterprises in their business activities. By industry, the input prices index for the construction industry was 54.5%, an increase of 6.2 percentage points MoM, while that for the service industry was 49.6%, a decrease of 0.6 percentage points MoM.
The selling prices index was 47.9%, a decrease of 0.9 percentage points MoM, indicating an overall decline in the selling prices of the non-manufacturing sector compared to the previous month. By industry, the selling prices index for the construction industry was 49.2%, an increase of 0.9 percentage points MoM, while that for the service industry was 47.7%, a decrease of 1.2 percentage points MoM.
The employment index was 45.6%, an increase of 0.1 percentage points MoM, indicating a slight improvement in the employment situation of non-manufacturing enterprises. By industry, the employment index for the construction industry was 40.9%, an increase of 1.0 percentage points MoM, while that for the service industry was 46.4%, unchanged from the previous month.
The business activity expectations index was 55.8%, an increase of 0.2 percentage points MoM, remaining in a relatively high growth range, indicating that most non-manufacturing enterprises remain optimistic about market development. By industry, the business activity expectations index for the construction industry was 51.6%, a decrease of 2.3 percentage points MoM, while that for the service industry was 56.6%, an increase of 0.6 percentage points MoM.
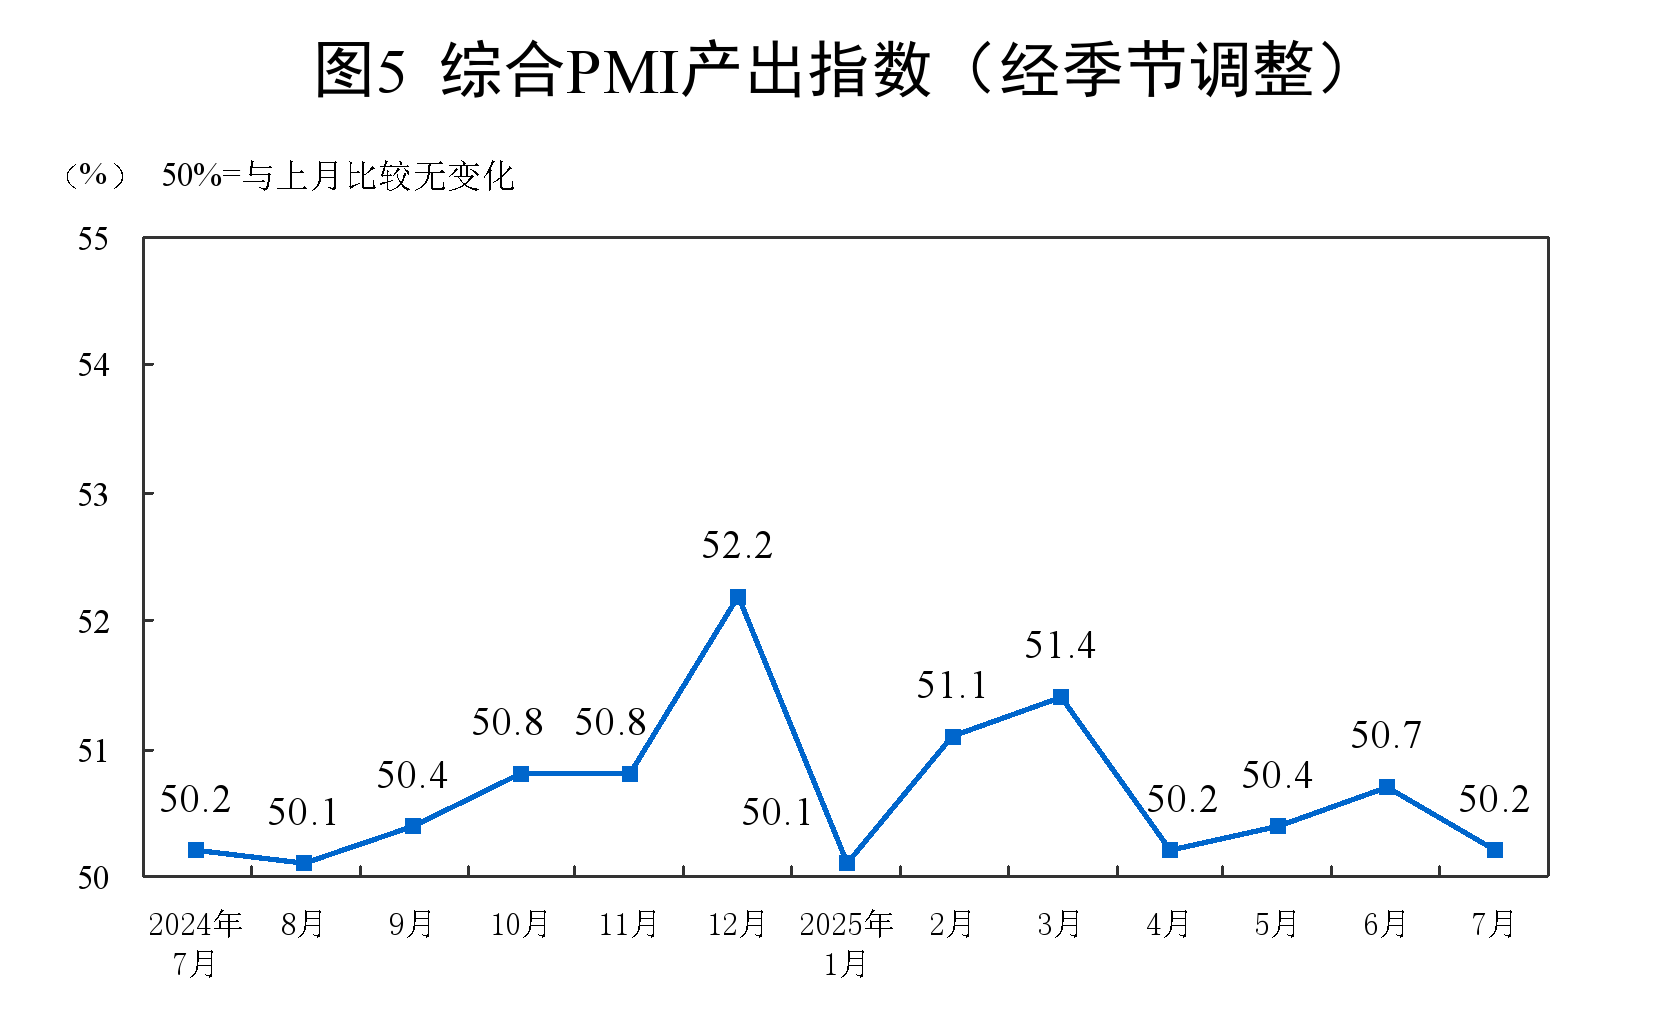
III. Performance of China's Composite PMI Output Index
In July, the composite PMI output index was 50.2%, a decrease of 0.5 percentage points MoM, but still above the critical point, indicating that the production and business activities of China's enterprises remained in expansion overall.
The manufacturing PMI pulled back slightly in July
The non-manufacturing business activity index remained in expansion
——Interpretation by Zhao Qinghe, Senior Statistician of the Service Industry Survey Center, National Bureau of Statistics, on China's PMI in July 2025
On July 31, 2025, the Service Industry Survey Center of the National Bureau of Statistics and the China Federation of Logistics and Purchasing released China's PMI. Zhao Qinghe, Senior Statistician of the Service Industry Survey Center, National Bureau of Statistics, provided an interpretation.
In July, the manufacturing PMI stood at 49.3%, a decrease of 0.4 percentage points MoM. The non-manufacturing business activity index and the composite PMI output index were 50.1% and 50.2% respectively, both declining by 0.4 and 0.5 percentage points MoM, yet remaining above the critical point, indicating that China's overall economic output continued to expand.
I. Manufacturing PMI Pulls Back
In July, affected by factors such as the manufacturing sector entering the traditional off-season for production, as well as high temperatures, heavy rainfall, and floods in some regions, the PMI fell to 49.3%, indicating a pullback in the manufacturing sector's prosperity level compared to the previous month.
(1) The production index remains in expansion territory. The production index and new orders index were 50.5% and 49.4% respectively, a decrease of 0.5 and 0.8 percentage points MoM. Manufacturing production activities continued to expand, while market demand slowed down. By industry, the production index and new orders index for railway, shipbuilding, aerospace equipment, computer, communication, and electronic equipment industries remained in the expansion territory, with both supply and demand being relatively active. For chemical raw materials and chemical products, non-metallic mineral products, and other industries, both indices continued to be below the critical point, indicating weak supply and demand in the market.
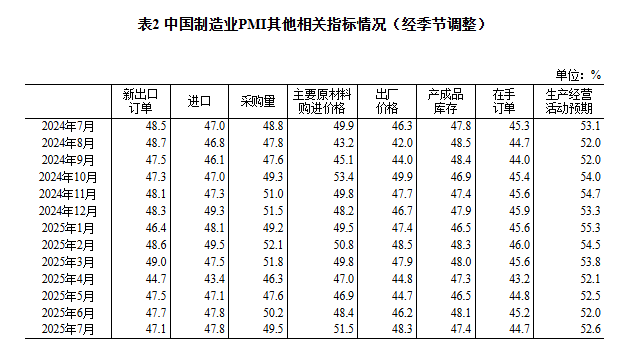
(2) The price index continues to rebound. Affected by factors such as the recent increase in the prices of some bulk commodities, the purchasing price index of major raw materials and the ex-factory price index were 51.5% and 48.3% respectively, an increase of 3.1 and 2.1 percentage points MoM. Among them, the purchasing price index of major raw materials rose above the critical point for the first time since March this year, indicating an overall improvement in the market price level of the manufacturing sector. By industry, the purchasing price index of major raw materials and the ex-factory price index for industries such as petroleum, coal, and other fuel processing, as well as ferrous metal smelting and pressing processing, rebounded significantly, with market prices in related industries improving.
(3) Large enterprises continue to expand. The PMI for large enterprises was 50.3%, a decrease of 0.9 percentage points MoM. Their production index and new orders index were 52.1% and 50.7% respectively, both remaining in the expansion territory for three consecutive months, indicating that large enterprises maintained a good production and operation situation. The PMI for medium-sized enterprises was 49.5%, an increase of 0.9 percentage points MoM, with the prosperity level continuing to improve. The PMI for small enterprises was 46.4%, a decrease of 0.9 percentage points MoM.
(4) New momentum continues to grow. By key industry, the PMI for equipment manufacturing and high-tech manufacturing were 50.3% and 50.6% respectively, both remaining above the critical point, indicating that the high-end equipment manufacturing sector continued to expand. The PMI for the consumer goods industry was 49.5%, a decrease of 0.9 percentage points MoM. The PMI for high energy-consuming industries was 48.0%, an increase of 0.2 percentage points MoM, indicating an improvement in prosperity.
(V) Market expectations rebound. The expected index for production and business activities stood at 52.6%, up by 0.6 percentage points from the previous month, indicating increased confidence among manufacturing enterprises in the near-term market development. By industry, the expected indices for production and business activities in the automotive, railway, shipbuilding, aerospace equipment, electrical machinery and equipment industries were all above 55.0%, indicating a relatively high level of prosperity, with relevant enterprises being more optimistic about industry development.
II. Non-manufacturing business activity index remains in expansion territory
In July, the non-manufacturing business activity index was 50.1%, down by 0.4 percentage points from the previous month, but still above the critical point.
(I) The service sector business activity index remains generally stable. The service sector business activity index was 50.0%, down slightly by 0.1 percentage points from the previous month. By industry, driven by the summer holiday effect, the business activity indices for railway transportation, air transportation, postal services, culture, sports, and entertainment industries, which are related to residents' travel and consumption, were all above 60.0%, indicating a high level of prosperity and rapid growth in total business volume. The business activity indices for industries such as leasing and business services, ecological protection, and public facility management were all in the expansion territory, with the tourism-related industry market being relatively active. The business activity indices for industries such as real estate and residential services were all below the critical point, indicating a relatively weak level of prosperity. From the perspective of market expectations, the expected index for business activities was 56.6%, up by 0.6 percentage points from the previous month, indicating that most service sector enterprises were relatively optimistic about market expectations.
(II) The construction sector business activity index pulls back. Affected by unfavourable factors such as the recent continuous high temperatures and rainstorm and flood disasters in some regions, construction activities in the construction sector have slowed down somewhat, with the business activity index standing at 50.6%, down by 2.2 percentage points from the previous month. From the perspective of market expectations, the expected index for business activities was 51.6%, down by 2.3 percentage points from the previous month.
III. Composite PMI output index expansion slows down
In July, the composite PMI output index was 50.2%, down by 0.5 percentage points from the previous month, but still above the critical point, indicating that the production and business activities of China's enterprises remained generally in expansion territory. The manufacturing production index and non-manufacturing business activity index, which constitute the composite PMI output index, were 50.5% and 50.1%, respectively.