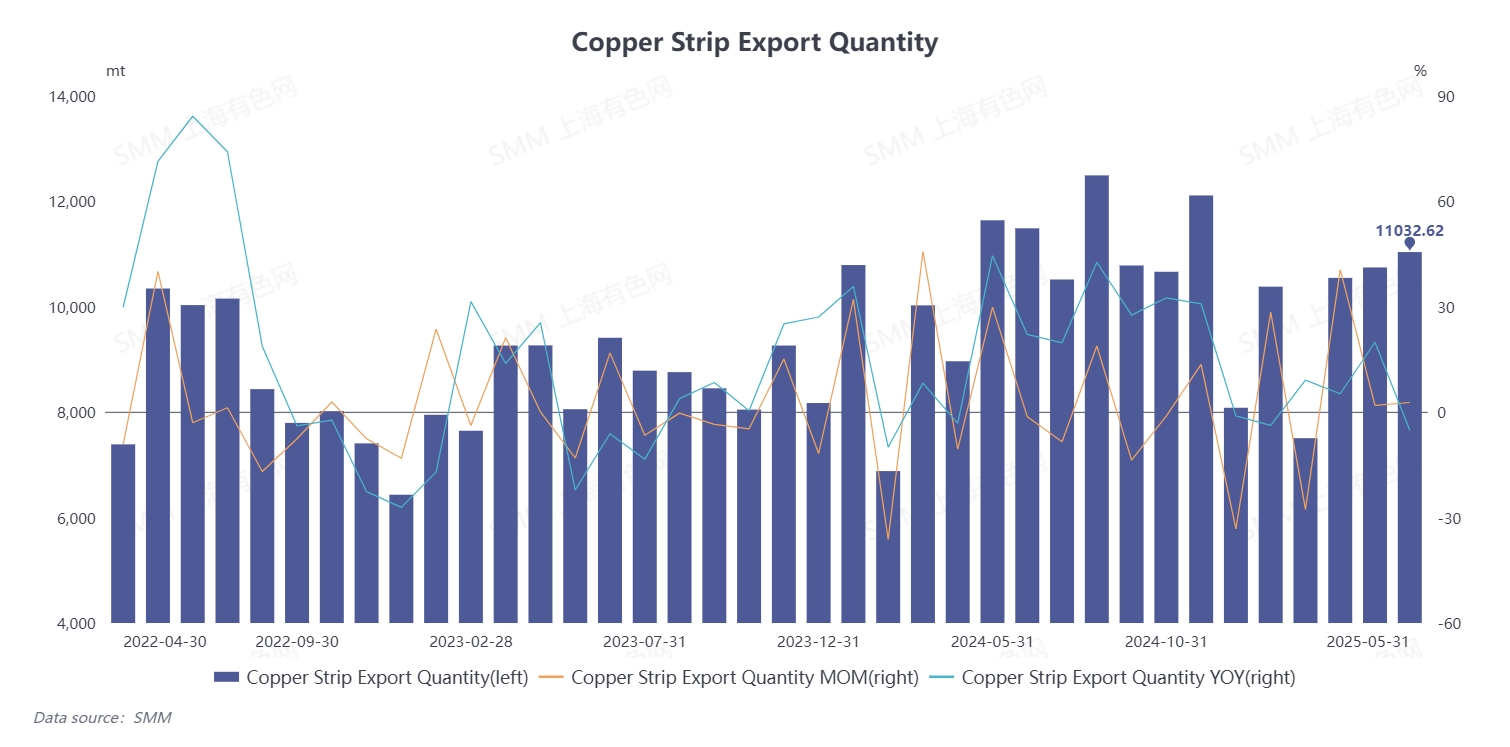
According to data from the General Administration of Customs, domestic exports of copper plate/sheet and strip reached 11,033 mt in May 2025, up 2.71% MoM and down 5.18% YoY. As of April, cumulative exports of copper plate/sheet and strip in China stood at 50,198 mt, up 3.96% YoY.
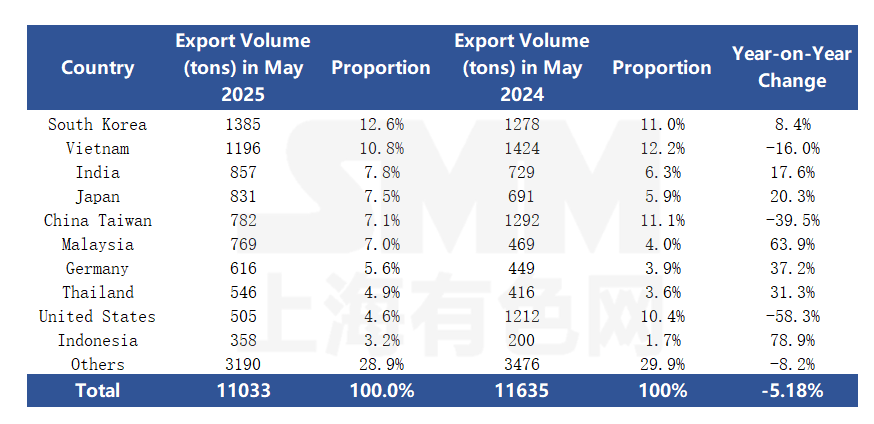
In May 2025, China's copper plate/sheet and strip export market showed a differentiated development trend. Customs data indicated that in May, China's copper plate/sheet and strip exports covered 85 countries and regions. Although total exports pulled back YoY (down 5.18% YoY), there were still bright spots when considering market dynamics. Against the backdrop of ongoing Sino-US tariff disputes, China actively adjusted its export structure, increasing export efforts to regions such as India and ASEAN. This strategy also showed results in the export data for May. Specifically, among the top 10 countries and regions for China's copper plate/sheet and strip exports in May, South Korea, Vietnam, and India ranked first, second, and third with 1,385 mt, 1,196 mt, and 857 mt, respectively. Among them, exports to South Korea were up 8.4% YoY, continuing to improve; exports to India surged 17.6% YoY, indicating significant demand growth; while exports to Vietnam fell 16.0% YoY, showing pressure. Additionally, exports of copper plate/sheet and strip to Indonesia and Malaysia saw significant increases, rising 78.9% and 63.9% compared to the same period in previous years, ranking tenth and sixth, respectively. As an important ASEAN country, Indonesia became one of the beneficiary markets for the export shift. However, the volume of copper plate/sheet and strip exported to the US and Taiwan, China in May suffered a sharp decline, dropping 58.3% and 39.5% YoY, respectively.
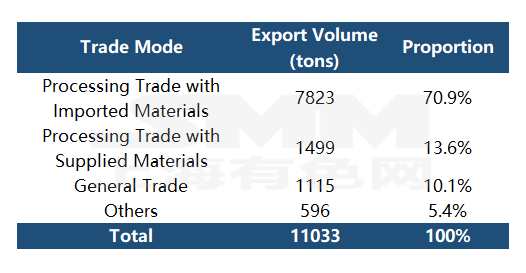
The structure of China's copper plate/sheet and strip export trade modes is distinct. Processing with Imported Materials is the dominant trade mode, with exports of 7,823 mt in May, accounting for 70.9%; Processing Trade with Supplied Materials had exports of 1,499 mt, accounting for 13.6%; Ordinary Trade had exports of 1,115 mt, accounting for 10.1%; and other trade modes had exports of 596 mt, accounting for 5.4%, supplementing diverse trade scenarios and jointly shaping the overall pattern. (HS codes: 74091110, 74091190, 74091900, 74092100, 74092900, 74093100, 74093900, 74094000, 74099000)